HAL Id: hal-01603851
https://hal.archives-ouvertes.fr/hal-01603851
Submitted on 16 May 2020HAL is a multi-disciplinary open access archive for the deposit and dissemination of sci-entific research documents, whether they are pub-lished or not. The documents may come from teaching and research institutions in France or abroad, or from public or private research centers.
L’archive ouverte pluridisciplinaire HAL, est destinée au dépôt et à la diffusion de documents scientifiques de niveau recherche, publiés ou non, émanant des établissements d’enseignement et de recherche français ou étrangers, des laboratoires publics ou privés.
Distributed under a Creative Commons Attribution - ShareAlike| 4.0 International License
3D virtual wheat scenes
Nathalie Al Makdessi, Pierre-Antoine Jean, Martin Ecarnot, Nathalie
Gorretta, Gilles Rabatel, Pierre Roumet
To cite this version:
Nathalie Al Makdessi, Pierre-Antoine Jean, Martin Ecarnot, Nathalie Gorretta, Gilles Rabatel, et al.. How plant structure impacts the biochemical leaf traits assessment from in-field hyperspectral images: A simulation study based on light propagation modeling in 3D virtual wheat scenes. Field Crops Research, Elsevier, 2017, 205, pp.95-105. �10.1016/j.fcr.2017.02.001�. �hal-01603851�
1
How plant structure impacts the biochemical leaf traits assessment from
in-field hyperspectral images: a simulation study based on light propagation
modeling in 3D virtual wheat scenes
Nathalie Al Makdessi1*([email protected]), Pierre-Antoine Jean2* ([email protected]), Martin Ecarnot2 ([email protected]), Nathalie Gorretta1 ([email protected]), Gilles Rabatel1 ([email protected]), Pierre Roumet2 ([email protected])
1
IRSTEA, UMR ITAP, 361 rue Jean-François Breton, F-34196 Montpellier, France 2INRA, UMR AGAP, 2 place Pierre Viala, 34060 MONTPELLIER Cedex 02
*These authors contributed equally to this work.
Author for correspondence: Nathalie Al Makdessi Tel: +33 4 67046377
2
Abstract
Light propagation modeling in 3-dimensional virtual scenes has been successfully applied to many fields, including plant canopies. However, its application to detailed analyses on how multiple scattering affects spectral-based biochemistry assessments has never been proposed.
In this article, a wheat canopy model has been built using simulation models included in the open source software platform Open-Alea. Adel-Wheat, a 3D dynamic model of the aerial growth of winter wheat, has been associated with spectra collected on wheat leaves with an ASD spectrometer, and then used as input of the Caribu light propagation model. Caribu calculates the proportion of direct and scattered light for all polygons of the 3D scene. Principal component analysis was first applied to analyze the distribution of resulting spectra in the spectral feature space. Then the influence of canopy structure on quantitative regression models has been considered. For this purpose, a typical agronomical problem, i.e. nitrogen content retrieval, was addressed, using a Partial Least Square regression model.
This study exhibits some important results concerning the distribution of collected spectra in the spectral feature space due to multiple scattering, and underlines the physical interpretation of these results. In the short term, it shows that satisfactory nitrogen content prediction (error about 0.5% of dry matter) can be obtained at the plant level, when considering only the plant top leaves. Moreover, its paves the way for future researches to develop spectral analysis tools able to overcome such multiple scattering phenomena.
Keywords: 3D virtual scenes, canopy light propagation, Caribu, leaf nitrogen content, multiple
3
1 Introduction
In agriculture, improving plant performance requires to understand how genotypes interact with the environment in order to develop more efficient varieties under various production conditions.
For this purpose, plant performance has to be assessed in terms of growth and development, stress resistance and biochemical composition, for a wide range of genetic diversity. It highly depends on canopy ability to acquire and use external resources (light interception, water or nutrient uptakes), which is determined by the biochemical content and the spatial distribution (architecture traits) of its organs (Araus and Cairns 2014).
To document these features, rapid, non-invasive and non-destructive approaches are highly desirable. Indeed, remote optical sensors offers a relevant opportunity for quantitative assessment of vegetation properties at different plant scales (Colombo et al. 2008). Because incoming radiation in the optical domain strongly interacts with vegetation through absorption and scattering processes, the reflected radiation contains valuable information to infer biochemical organ contents (Jacquemoud and Baret 1990) or architectural traits (Verhoef 1984). Numerous phenotyping approaches based on such optical information have been recently reported over the world (Fiorani and Schurr 2013).
At individual leaf scale, a contact between leaf and active incident light thanks to a clamp allows to capture reflectance or transmittance signals. These signals directly result from the target leaf properties without being altered by canopy structure. Indeed chlorophyll content can be inferred easily from leaf transmittance (Baret and Fourty 1997) or leaf reflectance (Xue and Yang 2009) at dedicated wavelengths. For other leaf components most of the studies have been based on spectral signals involving an enlarged range of wavelengths (including both visible and near
4
infrared regions), coupled with statistically-based methods such as Partial Least Squares regression (PLS-R) (Wold et al. 2001) to build calibrations. Recently, accurate inferences of Leaf Nitrogen Content (LNC) have been reported both for annual crop (Ecarnot et al. 2013) and tree species (Serbin et al. 2012).
At canopy scale, hyperspectral remote sensing with satellites or aircrafts allows assessing the spatial and temporal variability of vegetation status from local to global scales (Jay et al. 2016). This has led to numerous agricultural and environmental applications such as the retrieval of leaf pigments (Blackburn 2007; Nicotra et al. 2003), the early detection of leaf diseases (Mahlein et al. 2013) or the mapping of forest biodiversity (Féret and Asner 2014). As hyperspectral cameras are now becoming more affordable, close-range remote sensing data are also increasingly available to the scientific community. Compared with aircraft and satellite data, these sensors offer up to a sub-millimeter spatial resolution. The images are generally processed by applying statistically-based methods (PLS-R, Stepwise multiple linear regression, etc.) to estimate various leaf biochemical properties (Jay et al. 2014; Nicotra et al. 2003; Vigneau et al. 2011). However vegetation canopy reflectance spectra differ substantially from those of single leaves because internal shadowing and multiple scattering inside the canopy induce strong non-linear effects on the spectrum (Verhoef and Bach 2003) and thus possible bias in measurements (Ollinger 2011). Indeed, Vigneau et al. (2011) collected hyperspectral images of leaves and observed a decrease of the performance of calibration for leaf N content as the scene get more complex (considering successively isolated flat leaves, isolated plants and field scenes).
The goal of the present study was to document in detail such canopy multiple scattering effects in the context of hyperspectral imagery, in order to assess their influence on PLS-R prediction of
5
biochemical content, and possibly to develop adapted processing tools in a further step. Such a study required to isolate the phenomena under consideration, e.g. to compare their effect on virtually the same leaf for various positions in the canopy. For this purpose, a simulation approach has been chosen, allowing dealing with simplified situations.
Several authors proposed simulation tools to document light-vegetation interactions according to canopy architecture. Three main approaches have been developed: analytical formulation, ray-tracing computation and nested radiosity computation (Widlowski et al. 2007).
A typical example of analytic formulation is the SAIL (Scattering by Arbitrarily Inclined Leaves) model developed by (Verhoef 1984). The author proposed to consider the canopy as a turbid medium characterized by scattering and light extinction coefficients, in order to define its bidirectional reflectance distribution function (BRDF) at a macroscopic scale. Required inputs are the reflectance and transmittance of isolated leaf (considered as Lambertian), measurements conditions (solar zenith angle), leaf area index and a statistical distribution of leaf inclination. This model has been widely used, either to estimate effect of leaf and architecture variables on canopy reflectance (Bacour et al. 2002; Danson and Bowyer 2004), or to assess canopy parameters through reflectance.
Ray tracing models such as DART (Landier et al. 2015) simulate the radiance spectrum of every leaf in the canopy by taking into account their local BRDF, the plant-light interactions being dynamically simulated for each organ (Chelle et al. 2007). Such models were used to evaluate photosynthetically active radiation (PAR), light interception by canopy (Cici et al. 2005), or gap fraction (Duthoit et al. 2008).
6
Nested radiosity (Chelle and Andrieu 1998) can be considered as intermediate between the two previous ones. Here, leaves are considered as Lambertian: their BRDF does not depend on incident and observation angles, leading to a simplified computation of multiple scattering in any point of the scene. Indeed, once the equation describing the radiative equilibrium has been solved, it can be used to compute leaf radiances for any wavelength (Dorigo et al. 2007). Therefore, compared to ray tracing, nested radiosity requires much less computing resources.
Evers et al. (2007) used it to simulate the influence of red/far-red ratio on wheat. Nested radiosity has also been used to simulate light distribution within canopy structures (Barillot et al. 2013; Sarlikioti et al. 2011; Wiechers et al. 2011).
Among the three modeling approaches for light-vegetation interactions described above, only the first one (SAIL) has been designed explicitly for optical measurement applications. However, its output consists in a unique average radiance spectrum (for a given observation angle). In that sense, it is not well-suited to close range hyperspectral imagery, for which a detailed analysis of the spatial distribution of the observable radiances should be preferable. On the other hand, ray tracing and nested radiosity approaches are relevant since they allow spatializing multiple scattering effects. Furthermore, they can be coupled with 3D architectural models to simulate various canopy structures as well.
We have chosen here to use the nested radiosity computation model CARIBU (Chelle et al. 2004), coupled with the 3D ADEL-Wheat architectural model (Fournier et al. 2003), which generates realistic wheat canopies. We used it to analyze the statistical distribution of multiple scattering effects in the spectral space, and to precise how this statistical distribution impacts the
7
performance of standard spectral prediction tools like PLS-R in a synthesized hyperspectral image.
The remaining of this article is organized as follows. Section 2 presents the simulation tools as well as the methodology used to set up our approach. In section 3, the results are presented and analyzed according to their physical interpretation. Finally, conclusions and perspectives are drawn in section 4.
2 Material and methods
The methodology used in this study is summed up in the flowchart given in Figure 1. It relies on the use of Caribu and Adel wheat models in order to simulate spectra impacted by multiple scattering. To analyze these simulated spectra, a PCA analysis was first conducted. Then the effect of multiple scattering on regression performance in predicting leaf nitrogen content has been considered.
8
Figure 1: Flowchart of the methodology implemented in this study
LNC: Leaf Nitrogen Content PLS-R: Partial least squares regression
2.1 Simulation tools
ADEL-Wheat and Caribu models are integrated in the OpenAlea platform (Pradal et al. 2007), an open source platform dedicated to Plant Architecture modeling. These tools are briefly presented in the present section, as well as the required adaptations made.
2.1.1 Crop structure simulation with ADEL-Wheat
ADEL-Wheat (Fournier et al. 2003), is a canopy model dedicated to wheat crops, which allows generating 3D dynamic descriptions of canopy structure, from sowing to harvest stages. Its development has been based on real data observation, taking into account dynamic evolution rules as well as structural parameters that can be adjusted from one variety to the other (leaf
ASD spectrometer
Transmittance spectra Reflectance spectra LNC reference values
Data set of wheat leaves
ADEL-Wheat
(wheat canopy structure)
Simulated spectra
with/without multiple scattering Variety LNC prediction Assessment (PLS-R) PCA Analysis in the spectral feature space Caribu (light propagation)
9
curvature and disposition, tiller geometry and inclination, etc.). Other parameters like the senescence rate can also be controlled.
As a result, ADEL-Wheat can generate a 3D canopy representation at any given phenological stage specified by the user expressed in cumulative degree days (°C d) since plant emergence. Every organ is represented by a set of polygons. A label is attached to each polygon, indicating the type of organ (stem, fresh leaf, senescent leaf, etc.). ADEL-Wheat, as well as the necessary tools for the visualization of its 3D output (PlantGL, 3D Viewer) is included in the OpenAlea platform. Figure 2 shows examples of wheat canopy patterns simulated by ADEL-Wheat for Maxwell and Soissons varieties at 1200 °C d. These two varieties are characterized by different leaf structural parameters: flexible for Soissons and erected for Maxwell. These patterns are associated with a periodization function, in order to obtain a virtual canopy of infinite dimensions for further light propagation simulation.
Figure 2: Examples of canopy simulation at 1200 °C d for two varieties with ADEL-Wheat
10
2.1.2 Light propagation simulation with Caribu
Once typical wheat canopy scenes have been modeled using ADEL-Wheat patterns, the second step was to simulate light propagation inside of them according to leaf optical properties. For this purpose, the light propagation model Caribu has been used.
Caribu was initially developed to evaluate the amount of light received by each organ in a given canopy structure, in the frame of physiological studies. It is a simulation tool proposed by the OpenAlea platform, which relies on the nested radiosity model developed by Chelle and Andrieu (1998). In addition to 3D canopy geometry defined above, Caribu requires to characterize the optical properties of each type of organ (and thus of each polygon) in terms of reflectance and transmittance, as well as the lighting source distribution above the canopy.
In the following, we used a standard lighting set of sources proposed by the Caribu package, which corresponds to a usual cloudy sky. It is made of sixteen directional sources distributed above the canopy, in order to simulate real conditions of a diffuse illumination. The intensity of the source radiance increases when approaching the zenith (Figure 3).
11
Figure 3: Lighting source distribution used for Caribu simulation (polar representation).
The size of each of the 16 plots is proportional to the corresponding source radiance.
Zenith is at the center of the circle. Surrounding figures refer to azimuth angles (°).
Once the illumination sources have been defined, Caribu calculates for all the polygons of the 3D scene the amount of direct and scattered light received.
To achieve this computation, several hypotheses are made. First, the polygons are supposed to be Lambertian surfaces, i.e. the amount of reflected light does not depend on the incidence and reflecting direction. Moreover, beyond a certain distance, the radiosity contribution of surrounding vegetation, which is very weak, is approximated using a multilayer model (far contributions): each layer is represented by a SAIL model (turbid medium) and for each one, leaf orientation statistics are computed from the Adel scene. In the present study, this distance threshold was fixed to 0.7 meters. The Figure 4 illustrates this computation scheme.
0.6 30 210 60 240 90 270 120 300 150 330 180 0
12
Figure 4: Near contributions (nested radiosity computation) and far contributions (multilayer model) in Caribu simulation scheme for a periodised Adel-wheat canopy
2.1.3 Caribu adaptation to hyperspectral imagery simulation
As our goal was to simulate and analyze the apparent reflectance observed from a hyperspectral imager settled above the canopy and pointing to the nadir, some minor adaptations have been made to the Caribu model:
a) Multiple scattering option:
Leaves are usually illuminated partly by direct light from the sky, and partly by light reflection or transmission from neighboring leaves (multiple scattering). In order to assess the multiple scattering effects, an input option has been added, which allowed setting all polygon reflectance and transmittance values to zero. Depending on this option, multiple scattering could be enabled (MSE) or disabled (MSD) during the simulation.
Nested approach
13
b) Filtering of visible polygons:
Only a part of the polygons forming the 3D canopy description are visible from the nadir view, and thus contribute to the hyperspectral image. To select them, a first simulation was made for each canopy scene, in which the only light source was a directional light source in the nadir direction, and the multiple scattering option was disabled. Then, only polygons receiving light in these conditions were selected for the study.
c) Radiance output adaptation:
The standard output of Caribu is the amount of light Ei received on each face of each
polygon i. As our objective was to compute the amount of reflected light collected by the hyperspectral sensor from each polygon, each Ei value (irradiance) was multiplied by the
polygon reflectance Ri at the end of the simulation process.
d) Reflectance output adaptation:
Usually, hyperspectral imagery requires converting radiance data to reflectance data, using a reference surface in the scene (Vigneau et al. 2011) to take into account the spectral composition of lighting sources. In the present simulation scheme, this step has been avoided by defining white lighting sources, i.e. sources with a flat spectrum, instead of sources reproducing the natural outdoor lighting spectrum. By this way, radiance outputs can be assimilated to reflectance outputs.
14
In order to allow further analysis of the influence of leaf position inside the canopy, the height of every polygon was systematically documented in association with the corresponding simulated spectrum.
2.2 Data analysis
2.2.1 Reflectance, transmittance and leaf nitrogen content references
A total of 57 reflectance and transmittance spectra of wheat leaves (elite variety) have been acquired during the season 2014 in field microplots (Montpellier experimental station, INRA, South France), cultivated under various nitrogen amendment conditions.
Spectra were collected on full expanded leaves at various stages using a field spectrometer equipped with a leaf clip (FieldSpec®, Analytical Spectral Devices, Inc. (ASD), Boulder, Colorado, USA). Two measurements Rb and Rw were made successively for each leaf, using respectively a black and a white background on the ASD leaf clip.
According to the Kubelka-Monk theory (Kubelka and Munk 1931), which deals with apparent reflectance of materials lying over a background, Rb and Rw can be related to the reflectance R and transmittance T of the leaf by the following equations:
𝑅𝑏 = 𝑅 (1)
𝑅𝑤 = 𝑅 + 𝑇2⁄(1 − 𝑅) (2)
From equation (2), it comes:
15
In addition, a chemical reference of leaf nitrogen content (LNC) expressed as a percentage of dry matter mass was measured in laboratory for each collected leaf using a chemical analyzer (the detailed procedure is described in Ecarnot et al. (2013)).
In order to match the specifications of a standard VNIR hyperspectral camera, the ASD spectra (initially 350-2500 nm range with 1 nm step) were reduced and resampled to the 400-1100 nm range with 5 nm steps.
As a result, a data set of 57 triplets (Rj(), Tj(), LNCj) was available for this study, with 141
values from 400 to 1100 nm and a LNC range from 0.55 to 4.53 % of dry matter (DM).
2.2.2 Spectral simulations
Spectral simulations with Caribu require specifying the transmittance and reflectance spectra of every polygon provided by the ADEL-wheat model. For the sake of simplicity in further analysis, the simulated canopy has been considered as made of homogeneous leaves in terms of nitrogen content.
Thus, 57 canopy simulations (CSj) have been successively computed, each one using the
(Rj(), Tj()) couple for each canopy leaf. The Rj() spectra are further referred as ‘basic
spectra’.
For each CSj simulation, a hyperspectral image corresponding to a camera settled above the
canopy and pointing to the nadir has been synthesized. Each image contains more than one thousand different output spectra, repeated according to the periodization. An example of image is given in Figure 5.
16
Figure 5: Synthetic hyperspectral image in false colors
(670 nm, 600nm, 450 nm bands have been used as R, G, B channels)
Four simulations were made: two canopy architectures differing mainly in leaf angles (see Figure 2) were considered (Maxwell and Soissons) with options MSE and MSD in each case. Figure a, in the supplementary material, shows as an example the basic spectrum R0() and the
corresponding MSE simulated spectra in the hyperspectral image.
2.2.3 Principal Component Analysis
To analyze the spectral modifications induced by light propagation and multiple scattering in the canopy, a Principal Component Analysis (PCA) was applied on the MSD as well as MSE spectra. For this purpose, a single triplet (R0(), T0(), LNC0) has been selected. This selection
corresponds to a reference LNC0 value equal to 2.92 % DM which is representative of a durum
17
Four possible configurations have been considered, i.e. with and without multiple scattering (MSE and MSD) combined with two wheat architectures: Soissons (flexible leaves) and Maxwell (erected leaves).
2.2.4 PLS regression for LNC assessment
To assess leaf nitrogen content from spectral data a PLS-R model for LNC assessment has been tested using the following procedure:
- Before PLS-R computation, every spectrum Rj() was pre-processed using a log-center
operation, giving a spectrum RjLC(). It consists in computing for each wavelength the
logarithm of the amplitude value, and then subtracting the mean amplitude for the whole spectrum (centering). This allows converting multiplicative effects (see further) into additive effects, which are then eliminated by the centering.
- A PLS-R calibration was made based on the set of 57 (RjLC(), LNCj) couples issued from
the experimental dataset. This calibration provided a set of B coefficients [B(), b0] allowing the LNC estimation of any new spectrum according to the following equation:
LNC* = RLC()T. B() + b0 (4)
- The PLS-R model was then applied to the MSD and MSE spectra, after the same log-center operation, according to Equation (4). The resulting LNC* values were then compared to the reference value LNCj.
18
3 Results and discussion
3.1 Principal Component Analysis
3.1.1 Spectrum variability without and with multiple scattering
When applying PCA on MSD spectra, the whole inertia of the spectra is distributed along a unique principal component, both for Soissons and Maxwell varieties (see Figure b in the supplementary material).
On the other hand, when multiple reflections are enabled for both varieties, 99.99 % of the MSE-spectra inertia is distributed on a plane (noted Pms) defined by the two first axes of PCA (respectively noted PCms1, PCms2). These two axes explain respectively about 97% and 3% of the
total inertia for the Soissons variety, and 95.5% and 4.5% for the Maxwell variety. The general shape of the spectrum distribution is similar for both architectures (Figure 6). The factor map for Soissons variety shows fewer points, as a lower number of polygons can be seen from the nadir view. As explained in 2.1.3, only the visible polygons are kept for analysis. Since Soissons has a more flexible architecture, the lower leaves are more hidden by the upper leaves.
19
Figure 6: Projection of simulated spectra on the two first PCA axes with multiple scattering (up: Soissons variety. down: Maxwell variety)
3.1.2 Physical interpretation of multiple scattering
As seen above, for simulated spectra without multiple scattering, the first axis of PCA carries all the inertia (100%). Indeed the only factor which influences the observed radiance in this case is the amount of irradiance due to direct incident light, which depends on the leaf inclination:
-2 -1 0 1 2 3 4 5 -0.5 -0.4 -0.3 -0.2 -0.1 0 0.1 0.2 0.3 PCms1 (97.00%) PC m s2 ( 2 .9 9 % )
Individuals Factor Map (PCA)
-2 -1 0 1 2 3 4 5 -0.5 -0.4 -0.3 -0.2 -0.1 0 0.1 0.2 0.3 PCms1 (95.65%) PC m s2 ( 4 .3 4 % )
20
when considering a single leaf under directional lighting, the observed radiance is modulated by a geometrical factor = cos (𝜃) where 𝜃 is the angle between the light direction and the normal to the leaf surface (see Figure c in the supplementary material). This leads to an observed radiance L = .R.E (where E is the source radiance and R is the leaf reflectance) and thus to an apparent reflectance L / E = .R.
In our MSD simulation setup, the scene lighting is not directional (see section 2), but a light incidence dependency still exists, mainly due to the greater radiance of the zenithal source compared to others (see Figure 3). The modulation factor is not depending on the wavelength, so that the observed spectrum is only affected by a scalar multiplication. As a consequence, all the MSD spectra lie on a same straight-line in the spectral space, supported by the basic spectrum.
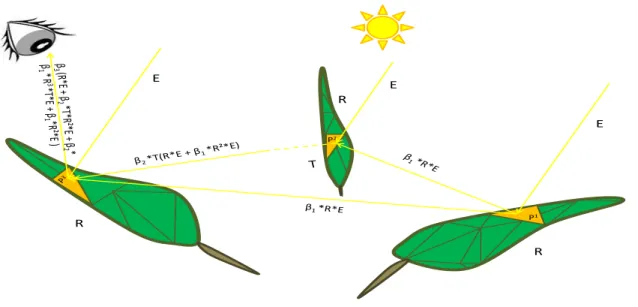
On the other hand, with multiple scattering, secondary light sources also contribute to the leaf illumination. Figure 7 shows an illustration scene, involving light reflection and transmission through neighboring leaves under directional sunlight. Even in this simplified case, the resulting apparent reflectance includes additive terms R², R².T and R3.T with various scalar factors, in addition to the principal term R (where R and T are the basic reflectance and transmittance spectra).
21 P1 P2 E R R R E E
Figure 7: Some cases of leaf illumination in its natural environment
E: lighting source radiance. R: leaf reflectance. L: observed radiance
1, 2, 3 are scalar factors related to leaf inclination
In order to facilitate the interpretation of the PCA results, a geometrical transformation has been applied to the representation of Figure 6 for the Soissons variety, in order to represent simultaneously the MSE and MSD spectra. First, it has been checked numerically that the unique inertia axis obtained without multiple scattering (MSD axis) was included in the plane Pms obtained with multiple scattering. Then a new coordinate system has been defined by rotating the Pms plane representation, so that the first axis now corresponds to this MSD axis. These two new axes are referred as Pms1* (MSD axis) and Pms2*. Moreover, the origin of this new coordinate system has been set equal to (0, 0), i.e. the null spectrum1.
1
22
All simulated spectra (both MSE and MSD) have been projected again in this new Pms plane representation. In the same graph we have also projected additional spectra information related to:
- The point-to-point difference of MSE and MSD spectra (for every visible polygon in the Soissons Adel-wheat model, the difference Sdiff() between MSE and MSD spectra has been computed).
- The square and cubic spectra S²() and S3() for each MSD spectrum2. - The basis spectrum R0() used for all simulations, noted S0.
The resulting representation is shown in Figure 8.
2
It has been checked numerically that S²() and S3() are close to the inertial plane Pms, i.e. that they are nearly equal to their plotted projection in this plane.
0 1 2 3 4 5 6 7 -0.6 -0.4 -0.2 0 0.2 Pms1* P m s2 *
Spectra with multiple scattering Spectra without multiple scattering (S) Multiple scattering effects (Sdiff)
Square of spectra without multiple scattering (S2) Cube of spectra without multiple scattering (S3) Basic spectrum (S0)
Legend:
23
Figure 8: Combined representation of simulated spectra and associated data in the MSE inertial plane (Soissons variety)
Many interesting observations can be made from this new representation.
First, it confirms that the MSD spectra correspond to the basis spectrum S0 with a scalar attenuation factor. Indeed, the basis spectrum is the maximum apparent reflectance that could be obtained with a perfectly horizontal leaf (normal to the main light source).
Second, the horizontal axis (MSD axis) still carries most of the inertia of the MSE spectra. As the distance of a given spectrum plot to the origin (0, 0) is proportional to its vector modulus, it means that this MSD axis roughly corresponds to the light exposure level of the polygons (exposure level increasing with MSD axis coordinate).
The point-to-point difference plot between MSE and MSD reflectance spectra, referred as Sdiff, can be roughly assimilated to a straight line containing the origin point (0, 0). This leads to the hypothesis that for any polygon i, the spectrum SMSEi obtained with multiple scattering can be
expressed as:
SMSEi ()= SMSDi ()+ ki. C() (5)
where SMSDi() is the spectrum obtained without multiple reflections, ki is a multiplicative factor
and C() is a constant spectrum (carrying the Sdiff straight line).
As discussed above, the multiple scattering contributions could physically correspond to additive terms including integer powers of the basis reflectance and transmittance values (R², R3, R²T,
24
etc.). In the present case, it seems that C() can be assimilated to a mixture of R² and R3 terms, with relatively constant proportions.
3.1.3 Influence of leaf exposure and height
An additional observation in Figure 8 is that, the less the light exposure level of a leaf polygon is (i.e. the more its plot is on the left of the graph), the closer it is to the Sdiff line. In other words, leaves with a low light exposure are more affected by multiple scattering effects than leaves with high exposure.
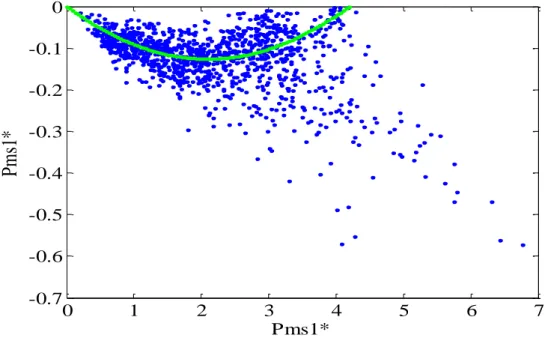
To illustrate this fact, in Figure 9, we have superimposed to the simulated spectra plots a curve C generated by the following function:
𝑝𝑚𝑠2∗⁄𝑝𝑚𝑠1∗ = 𝑘. (1 − 𝑝𝑚𝑠1∗ 𝑝𝑚𝑠1 𝑆0 ∗
⁄ ) for 0 < pms1* < pms1*S0 (6)
where (pms1*, pms2*) are the C current point coordinates according to the axes PC1 and PC2, pms1*S0 is the pms1* coordinate for the basic spectrum S0, and k is a tunable multiplicative
factor.
Equation (6) expresses in a simple way the fact that ratio pms2*/ pms1* (which characterizes the scattering effect) depends on pc1, and decreases to zero when pc1 reaches pms1*S0. A k value
equal to 0.12 has been empirically chosen. Though it cannot be claimed that this very simple equation reflects the real phenomena, we can observe that the curve C roughly corresponds to the general shape of the MSE simulated spectra distribution (however, it must be noticed on the right
25
side of the graph that a small amount of polygons with high exposure are also affect by significant multiple scattering effects, and thus are not so close to this curve).
Figure 9: Relationship between exposure and multiple scattering effects
Green curve equation: pms2* / pms1* = k. (1 – pms1* / pms1*max); k = 0.12
This relationship between exposure and multiple scattering effects can be explained by the correlation between exposure and height. Indeed, bottom leaves are more surrounded by other leaves than the upper ones, with two consequences: i) they receive a lower proportion of direct light from the sky, and a higher proportion of attenuated light from surrounding leaves, leading to a lower total amount of light ii) not only the amplitude, but also the spectral composition of this attenuated light is modified by reflection and transmission phenomena (Figure 7).
The relationships between the height of each polygon and its PCA coordinates, clearly confirms this dependency between leaf height in the canopy and plot location in the inertial plane (Figure 10). 0 1 2 3 4 5 6 7 -0.7 -0.6 -0.5 -0.4 -0.3 -0.2 -0.1 0 Pms1*
Pm
s1
*
26
Figure 10: Polygons’ height in the canopy according to the first two axes of PCA
(Soissons variety)
3.2 Multiple Scattering and leaf nitrogen assessment
3.2.1 Chemometric model
A PLS-R model has been built by cross-validation with a calibration set of 57 (R(), LNC) couples, after applying a log-center preprocessing operation on each spectrum R() (see section 2.2.4).
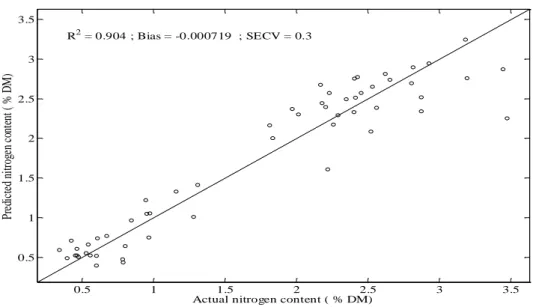
The number of latent variables for this model was equal to 5 with a correlation coefficient of calibration R² = 0.904 and a standard error of cross-validation SECV = 0.3 % DM (Figure 11).
0 1 2 3 4 5 6 7 -0.7 -0.6 -0.5 -0.4 -0.3 -0.2 -0.1 0 20 40 60 80 Pms1* Pms2* H e ig h t (c m )
27
The representation of B coefficient spectrum B(λ) (Figure 12) underlines the importance of 450, 550, 650 and 700 nm regions in PLS regression. The strong negative part close to the 700 nm region indicates that the difference of log-center amplitudes between this region and positive regions (450, 550, 650 nm) has a strong contribution to the LNC prediction.
Figure 11: Prediction plot of the PLS-R model for basic spectra
Figure 12: B coefficients of the PLS-R model
0.5 1 1.5 2 2.5 3 3.5 0.5 1 1.5 2 2.5 3 3.5
Actual nitrogen content ( % DM)
Pr ed ic te d ni tr og en c ont ent ( % D M ) R2 = 0.904 ; Bias = -0.000719 ; SECV = 0.3 400 500 600 700 800 900 1000 1100 -0.8 -0.6 -0.4 -0.2 0 0.2 0.4 0.6 Wavelength (nm) P L S B c o e ff ic ie n t
28
3.2.2 Simulated spectra without multiple scattering
The prediction results obtained with the MSD spectra for the Soissons variety, as a function of the Pms1* coordinate are represented on Figure 13. Similar results have been obtained with the Maxwell variety (data not shown).
Figure 13: Nitrogen prediction as a function of Pms1* coordinate for Soissons simulated spectra without multiple scattering (MSD option) (left) and corresponding LNC prediction
cartography (right)
It can be observed that nitrogen prediction values are roughly the same for all polygons, whatever the exposure, and nearly equal to the reference value. The small bias with the actual value (about 2%) can probably be explained by the rounding errors occurring in the Caribu computation chain. Indeed, as shown previously, the only factor which influences the observed
0 1 2 3 4 5 2 2.5 3 3.5 4 4.5 5 Pms1* P re d ic te d N it ro g e n ( % D M ) 100 200 300 400 500 600 200 400 600 800 1000 1 2 3 4 5 6
Predicted nitrogen content Actual nitrogen content
29
reflectance in the MSD case is a multiplicative factor, which is totally eliminated by the log-center preprocessing computation.
3.2.3 Simulated spectra with multiple scattering
The same test has then been applied on MSE spectra for both varieties (Figure 14). Now, a strong dependency of the prediction accuracy with respect to Pms1* coordinate value can be observed in both cases.
0 1 2 3 4 5 6 7 2 3 4 5 6 7 8 Pms1* Pr ed ic te d N itr og en (% D M ) 100 200 300 400 500 600 100 200 300 400 500 600 700 800 900 1000 1 1.5 2 2.5 3 3.5 4 4.5 5 5.5 6 Predicted nitrogen content
30
Figure 14: Nitrogen prediction as a function of Pms1* coordinate for spectra with multiple scattering (MSE option) (left) and corresponding nitrogen prediction content cartography (right).
Up: Soissons variety Down: Maxwell variety
For polygons with a high Pms1* coordinate value, the predicted nitrogen content converges to the actual value 2.92 %DM. On the other hand, for polygons with very low Pms1* value, a strong overestimation is induced, especially for the Maxwell variety (erected leaves). Low Pms1* values correspond to low light exposure (left of the graph in Figure 9), and thus to polygons located at the bottom of the canopy.
A tentative of explanation can be given for this overestimation: as mentioned above, the PLS-R model estimation for a given spectrum PLS-R (λ) relies on the dot product between its log-center spectra RLC(λ) and the coefficient vector B(λ) (Eq. 4). In this context, a spectrum Rn (λ) would
provide a log-centered spectrum n.RLC(λ) and thus a dot product n.[RLC()T. B()], leading to
0 1 2 3 4 5 2 3 4 5 6 7 8 9 Pms1* Pr ed ic te d N itr og en (% D M ) 100 200 300 400 500 600 100 200 300 400 500 600 700 800 900 1000 1 1.5 2 2.5 3 3.5 4 4.5 5 5.5 6 Predicted nitrogen content
31
LNC overestimation. As discussed above, multiple scattering induces additive terms in R², R3, etc. and thus such kinds of overestimations.
Some practical positive conclusions can be issued from these observations. Indeed, the results above show that a correct prediction can be obtain as far as only the polygons with high light exposure are considered. In the frame of outdoors hyperspectral imagery, such a selection can be easily achieved by checking the raw spectrum amplitude of each vegetation pixel in the image.
4 Conclusion
At canopy scale, plant architecture (mainly leaf orientation and spatial distribution) widely influences the penetration and scattering of light inside the canopy, and thus the spectral radiance that can be observed from outside. The general objective of this study was to analyze how multiple scattering effects due to plant canopy structure could affect the data collected by a hyperspectral camera. For this purpose, the light propagation model Caribu was applied on 3D models of durum wheat canopy, in order to simulate the observable spectra from a nadir view above the canopy. This simulation study allowed us providing a representation of the variability of observed spectra according to plant architecture, supported by physical interpretation. It also addressed the distribution of multiple scattering inside the canopy and its effect on leaf chemical content assessment. Our main conclusions are summarized below:
Spectral variability:
Multidimensional analysis demonstrates that spectra generated by light propagation in wheat canopy are mainly distributed in a 2D plan supported by two axes, the first one corresponding to the actual leaf reflectance spectrum, and the second to a combination of the square and cubic
32
powers of this reflectance spectrum, induced by multiple scattering effects. These observations are coherent with the physical interpretation of multiple scattering.
Distribution of multiple scattering inside the canopy:
Multiple scattering effects mainly concern the bottom leaves, which are more surrounded by neighboring leaves and less exposed to the direct light than upper leaves. As expected, it has been observed that light penetration inside canopy is deeper for erected leaf varieties, increasing multiple scattering. These results are consistent with previous ones reported by Meng et al. (2010). These authors underlined the importance of multiple scattering in lower layer of maize canopy leading to an increase by about 20 % of absorbed energy and, by consequent, photosynthesis rate.
Multiple scattering and leaf trait assessment:
This point was considered regarding a typical hyperspectral imagery application, i.e. the prediction of leaf nitrogen content by PLS regression. A larger contribution of multiple scattering to the measured spectra is related to a more important prediction bias. This results in strong overestimations of leaf nitrogen content of the bottom leaves. One the other hand, spectral data gathered on upper leaves generate LNC predictions close to the actual values.
To reach these conclusions, we have simplified dramatically the canopy characteristics, considering that all the organs had the same leaf nitrogen content. This deliberate choice was made possible thanks to our simulation approach. As mentioned in introduction, its motivation was to focus on multiple scattering effects and to analyze their impact on LNC prediction
33
independently of other external factors. Another simplification was to consider all leaves as Lambertian surfaces, thus avoiding specular reflection issues.
Specular reflection, which appears mainly in sunny conditions, can be removed in the context of PLS-based spectral processing (it appears as a constant offset in the observed reflectance spectra). But a more difficult issue is the case of heterogeneous LNC inside the canopy, because multiple scattering should cause a local averaging of the predicted values.
Therefore, it is clear that our study, due to these simplifications, cannot claim to report all the complexity of natural canopy scenes. It must be considered mainly as a mean to a better understanding of the phenomena involved, and as a guide for future developments:
First, in the context of phenotyping based on hyperspectral imagery, regression prediction remains usable with upper leaves, which can be selected thanks to their high brightness. However, eliminating lower leaves leads to discard an important part of information.
Second, the present study paves the way to carry out further research. More precisely, thanks to the two-dimensional distribution in the spectral space related to multiple scattering, chemometrics algorithms can be envisaged in order to recover the actual underlying spectral information.
Such algorithms will have to be evaluated in real field conditions. In case of success, they will allow field crop characterization at the leaf scale, opening the door to new phenotyping perspectives.
34
This study has been supported by Agropolis Foundation under the reference ID 1202-008 through the ‘Investissements d’avenir’ program (Labex Agro:ANR-10-LABX-0001-01), France Agrimer and l’Agence Nationale de la Recherche (ANR) through the Phenoble and Phenome programmes.
6 References
Araus, J.L., & Cairns, J.E. (2014). Field high-throughput phenotyping: the new crop breeding frontier.
Trends in Plant Science, 19, 52-61
Bacour, C., Jacquemoud, S., Tourbier, Y., Dechambre, M., & Frangi, J.-P. (2002). Design and analysis of numerical experiments to compare four canopy reflectance models. Remote Sensing of Environment, 79, 72-83
Baret, F., & Fourty, T. (1997). Estimation of leaf water content and specific leaf weight from reflectance and transmittance measurements. Agronomie, 17, 455-464
Barillot, R., Fournier, C., Huynh, P., Escobar-Gutiérrez, A.J., & Combes, D. (2013). How do variations of architectural parameters affect light partitioning within wheat-pea mixtures? A simulation study based on a virtual plant approach. In, 7th International Conference on Functional—Structural Plant Models, At
Saariselkä, Finland (pp. 246-248)
Blackburn, G.A. (2007). Hyperspectral remote sensing of plant pigments. Journal of Experimental
Botany, 58, 855-867
Chelle, M., & Andrieu, B. (1998). The nested radiosity model for the distribution of light within plant canopies. Ecological Modelling, 111, 75-91
Chelle, M., Evers, J.B., Combes, D., Varlet‐Grancher, C., Vos, J., & Andrieu, B. (2007). Simulation of the three‐dimensional distribution of the red: far‐red ratio within crop canopies. New Phytologist, 176, 223-234
Chelle, M., Hanan, J., & Autret, H. (2004). Lighting virtual crops: the CARIBU solution for open L-systems. In, 4th International Workshop on Functional-Structural Plant Models, Montpellier
Cici, S., Sindel, B., Adkins, S., & Hanan, J. (2005). Using L-systems to simulate chickpea cultivars and their shading abilities. In, MODSIM 2005 International congress on modelling and simulation, Melbourne (pp. 12-15)
Colombo, R., Meroni, M., Marchesi, A., Busetto, L., Rossini, M., Giardino, C., & Panigada, C. (2008). Estimation of leaf and canopy water content in poplar plantations by means of hyperspectral indices and inverse modeling. Remote Sensing of Environment, 112, 1820-1834
Danson, F., & Bowyer, P. (2004). Estimating live fuel moisture content from remotely sensed reflectance.
Remote Sensing of Environment, 92, 309-321
Dorigo, W., Zurita-Milla, R., de Wit, A.J., Brazile, J., Singh, R., & Schaepman, M.E. (2007). A review on reflective remote sensing and data assimilation techniques for enhanced agroecosystem modeling.
International journal of applied earth observation and geoinformation, 9, 165-193
Duthoit, S., Demarez, V., Gastellu-Etchegorry, J.-P., Martin, E., & Roujean, J.-L. (2008). Assessing the effects of the clumping phenomenon on BRDF of a maize crop based on 3D numerical scenes using DART model. Agricultural and Forest Meteorology, 148, 1341-1352
35 Ecarnot, M., Compan, F., & Roumet, P. (2013). Assessing leaf nitrogen content and leaf mass per unit area of wheat in the field throughout plant cycle with a portable spectrometer. Field Crops Research, 140, 44-50
Evers, J.B., Vos, J., Chelle, M., Andrieu, B., Fournier, C., & Struik, P.C. (2007). Simulating the effects of localized red: far‐red ratio on tillering in spring wheat (Triticum aestivum) using a three‐dimensional virtual plant model. New Phytologist, 176, 325-336
Féret, J.-B., & Asner, G.P. (2014). Mapping tropical forest canopy diversity using high‐fidelity imaging spectroscopy. Ecological Applications, 24, 1289-1296
Fiorani, F., & Schurr, U. (2013). Future scenarios for plant phenotyping. Annual review of plant biology,
64, 267-291
Fournier, C., Andrieu, B., Ljutovac, S., & Saint-Jean, S. (2003). ADEL-wheat: a 3D architectural model of wheat development. Plant Growth Modeling and Applications (eds B.-G. Hu & M. Jaeger), 54-66
Jacquemoud, S., & Baret, F. (1990). PROSPECT: A model of leaf optical properties spectra. Remote
Sensing of Environment, 34, 75-91
Jay, S., Bendoula, R., Hadoux, X., Féret, J.-B., & Gorretta, N. (2016). A physically-based model for retrieving foliar biochemistry and leaf orientation using close-range imaging spectroscopy. Remote
Sensing of Environment, 177, 220-236
Jay, S., Rabatel, G., & Gorretta, N. (2014). In-field crop row stereo-reconstruction for plant phenotyping. In, Second International Conference on Robotics and associated High-Technologies and Equipment for
Agriculture and forestry (RHEA-2014) (p. 10 p.)
Kubelka, P., & Munk, F. (1931). An article on optics of paint layers. Z. Tech. Phys, 12
Landier, L., Al Bitar, A., Gregoire, T., Lauret, N., Yin, T., Gastellu-Etchegorry, J.-P., Aubert, S., Mitraka, Z., Chrysoulakis, N., & Feigenwinter, C. (2015). Modeling parameters and remote sensing acquisition of urban canopies. In, ICUC9-9th International Conference on Urban Climate jointly with 12th Symposium
on the Urban
Mahlein, A.-K., Rumpf, T., Welke, P., Dehne, H.-W., Plümer, L., Steiner, U., & Oerke, E.-C. (2013). Development of spectral indices for detecting and identifying plant diseases. Remote Sensing of
Environment, 128, 21-30
Meng, J., Guo, X., Du, X., Wen, W., Lu, S., & Xiao, B. (2010). Evaluating the Effect of Multiple Scattering on Interception of Photosynthetically Active Radiation at Organ Scale Within Maize Canopy.
Sensor Letters, 8, 89-94
Nicotra, A., Hofmann, M., Siebke, K., & Ball, M. (2003). Spatial patterning of pigmentation in evergreen leaves in response to freezing stress. Plant, Cell & Environment, 26, 1893-1904
Ollinger, S. (2011). Sources of variability in canopy reflectance and the convergent properties of plants.
New Phytologist, 189, 375-394
Pradal, C., Dufour-Kowalski, S., Boudon, F., & Dones, N. (2007). The architecture of OpenAlea: a visual programming and component based software for plant modelling. Proc. 5th Int. Workshop on
functional-structural plant models, 49, 251
Sarlikioti, V., De Visser, P., & Marcelis, L. (2011). Exploring the spatial distribution of light interception and photosynthesis of canopies by means of a functional–structural plant model. Annals of Botany, 107, 875-883
Serbin, S.P., Dillaway, D.N., Kruger, E.L., & Townsend, P.A. (2012). Leaf optical properties reflect variation in photosynthetic metabolism and its sensitivity to temperature. Journal of Experimental Botany,
63, 489-502
Verhoef, W. (1984). Light scattering by leaf layers with application to canopy reflectance modeling: the SAIL model. Remote Sensing of Environment, 16, 125-141
Verhoef, W., & Bach, H. (2003). Simulation of hyperspectral and directional radiance images using coupled biophysical and atmospheric radiative transfer models. Remote Sensing of Environment, 87, 23-41 Vigneau, N., Ecarnot, M., Rabatel, G., & Roumet, P. (2011). Potential of field hyperspectral imaging as a non destructive method to assess leaf nitrogen content in Wheat. Field Crops Research, 122, 25-31
36 Widlowski, J.L., Taberner, M., Pinty, B., Bruniquel‐Pinel, V., Disney, M., Fernandes, R., Gastellu‐ Etchegorry, J.P., Gobron, N., Kuusk, A., & Lavergne, T. (2007). Third Radiation Transfer Model Intercomparison (RAMI) exercise: Documenting progress in canopy reflectance models. Journal of
Geophysical Research: Atmospheres, 112
Wiechers, D., Kahlen, K., & Stützel, H. (2011). Evaluation of a radiosity based light model for greenhouse cucumber canopies. Agricultural and Forest Meteorology, 151, 906-915
Wold, S., Sjöström, M., & Eriksson, L. (2001). PLS-regression: a basic tool of chemometrics.
Chemometrics and intelligent laboratory systems, 58, 109-130
Xue, L., & Yang, L. (2009). Deriving leaf chlorophyll content of green-leafy vegetables from hyperspectral reflectance. ISPRS Journal of Photogrammetry and Remote Sensing, 64, 97-106