To cite this version : Wang, Yu and Connétable, Damien and Tanguy,
Dôme Hydrogen influence on diffusion in nickel from first-principles
calculations. (2015) Physical Review B (PRB), vol. 91 (n° 9). pp. 1-9.
ISSN 1098-0121
To link to this article : doi:
10.1103/PhysRevB.91.094106
URL :
http://dx.doi.org/10.1103/PhysRevB.91.094106
O
pen
A
rchive
T
OULOUSE
A
rchive
O
uverte (
OATAO
)
OATAO is an open access repository that collects the work of Toulouse researchers and
makes it freely available over the web where possible.
This is an author-deposited version published in :
http://oatao.univ-toulouse.fr/
Eprints ID : 14014
Any correspondance concerning this service should be sent to the repository
administrator:
[email protected]
Hydrogen influence on diffusion in nickel from first-principles calculations
Yu Wang,1,2D. Conn´etable,2and D. Tanguy1,*
1Institut Lumi`ere Mati`ere, UMR5306 Universit´e Lyon 1-CNRS, Universit´e de Lyon 69622 Villeurbanne Cedex, France 2CIRIMAT, CNRS-INP-UPS UMR 5085, ´Ecole Nationale d’Ing´enieurs en Arts Chimiques et Technologiques (ENSIACET)
4 all´ee ´Emile Monso, BP 44362, F-31030 Toulouse Cedex 4, France
We propose a method to evaluate the diffusion coefficient of vacancy-hydrogen clusters (VHn) in metals. The
key is a good separation of time scales between H diffusion and the metal-vacancy exchange. The Ni-H system is investigated in details, using ab initio calculations, but the arguments can be transposed to other systems. It is shown that cluster diffusion can be treated as an uncorrelated random walk and that H is always in equilibrium before the vacancy-metal exchange. Then, the diffusion coefficient is a sum over jump paths of the equilibrium probability of being in a specific VHnconfiguration times the corresponding activation terms. The influence of H
on the energy barrier is well reproduced by effective pair interactions between the jumping Ni and the H atoms inside the vacancy. This model is motivated by an analysis of the electronic charge redistribution in key saddle configurations. The interaction is repulsive and decreases with distance. The model is used to find easy jump path, reduce the number of saddle searches, and provide an estimate of the error expected from this reduction. The application to the Ni-H system shows that vacancies are drastically slowed down by H. The effects of temperature and bulk H concentration are explored and the origin of the non-Arrhenius behavior is explained. At equilibrium, VHnclusters always induce a speedup of metal diffusion. The implications concerning H induced damage, in
particular in regards to Ni-Cr oxidation, are discussed. DOI:10.1103/PhysRevB.91.094106
PACS number(s): 61.72.−y, 71.15.Mb, 66.30.−h
I. INTRODUCTION
We address an important aspect of solid state diffusion: the mobility enhancement due to vacancy-interstitial solute inter-actions [1–5]. Fukai has shown that, at least at high temperature and high hydrogen pressure (H), gigantic concentrations of vacancies are produced [6]. These are called superabundant vacancies (SaVs). They can increase the diffusion coefficient by several orders of magnitude [7]. This mechanism also operates at lower temperatures, after electrodeposition [8,9], but in this case the system is far from equilibrium. In such conditions, it is difficult to interpret the impact of H on diffusivity. Vacancies, produced by intense plasticity [10,11] and stabilized by H, have been proposed as a possible source of H related degradation of metallic materials [12,13] at room temperature. Furthermore, simultaneous H and vacancy uptake can be obtained by oxidation in aqueous media. An important technological example is Ni-Cr alloys (alloy 600) in Pressurized Water Reactors (PWR) environment (aqueous oxidation at 600 K). The interplay between the microstructure and the oxidation processes have been extensively studied using state of art characterization techniques [14–19]. In particular, Cr profiles were obtained with a high spatial resolution which revealed a Cr depletion due to oxidation. A comparison with diffusion data at high temperature suggests an acceleration of transport by several orders of magnitude [20], likely caused by a large amount of out of equilibrium vacancies injected in the material [21] during oxidation. On the other hand, much effort has been devoted to determine the growth mechanism of the oxide and prove the hydrogen uptake [22–24]. Understanding the interplay between H and vacancies during diffusion is important for the modeling of
H degradation, for room temperature embrittlement, and for intermediate temperature oxidation. We report such a diffusion study in thermodynamic equilibrium, focusing on low H concentrations and temperatures in between 300 and 600 K, covering the range of relevance to applications.
The paper is organized as follows. The technical details concerning the ab initio calculations are first presented. Then the approximations that lead to the expressions for the effective diffusion coefficient and self-diffusion coefficient are detailed: typical time scales are calculated for each process, correlations are discussed, and the bulk concentration dependence is isolated. Motivated by the analysis of the electronic charge density, a model is proposed to determine the relevant activation barriers and reduce the number of saddle point searches to a tractable level with an acceptable impact on the precision of the result. Then, effective vacancy diffusion and self-diffusion coefficients are given as a function of temperature and H concentration. Finally, the main results are compared to irradiation-annealing and oxidation experimental results. It is shown that H induces opposite effects on vacancy and metal transport, depending on the kinetics of the H and vacancy uptake, that can span over many orders of magnitude.
II. METHODS A. DFT calculations
Energy calculations are carried out by first-principles methods based on density functional theory (DFT) [25,26]. The Vienna ab initio simulation package (VASP) [27–29] is used with the generalized gradient approximation (GGA) of the Perdew-Wang (PW 91) form [30,31] for electron exchange and correlation. A plane-wave basis set is employed within the framework of the Bl¨ochl projector-augmented wave (PAW) method [32] to describe the electron-ion interactions.
We find that a cutoff energy of 400 eV (29.4 Ry) and a dense Monkhorst-Pack mesh [33] (24×24×24) are necessary
for a good convergence. The equilibrium lattice structure is determined by minimizing the Hellmann-Feynman force on the atoms and the stress on the unit cell. The magnetic moments are taken into account in all calculations. Two sizes of supercells are tested: 32 and 108 atoms. The difference in total energy and jump barrier is found to be less than 0.03 eV in pure Ni. Therefore, the V Hn clusters are simulated using a supercell containing 32 atoms. Forces are minimized down to 0.01 eV/ ˚A. The nudged elastic band (NEB) method [34] is used for calculating energy barriers for diffusion. A spring force constant of 5 eV/ ˚A is used.
B. Diffusion model
Within the framework of the harmonic approximation of the transition state theory [35,36], the transition rate for a specific pathway (where i and j are formal indices for the initial and final state) is given by
Ŵij =kBT h e
−1Gm/ kBT, (1)
where kBis Boltzmann’s constant, h is Planck’s constant, and 1Gm is the free energy difference between the transition state and the initial state. The latter is composed of two contributions: an electronic energy term 1Em (the jump barrier) and a vibrational energy term 1Gvib [36,37]. In a periodic structure, Gvibis given by
Gvib = kBT X ν ln · 2 sinh µ hν 2kBT ¶¸ , (2)
where the ν are the vibrational frequencies of the system (in the saddle configuration, one frequency is imaginary: it is not considered and 1Gvib is the ratio of two sums [36] that do not contain the same number of terms). The summation on the vibration frequencies has been reduced at the q = Ŵ. Full phonon calculations are performed first in pure Ni, then on a few key saddle configurations in the presence of H.
III. DIFFUSIVITY OF VACANCY-HYDROGEN CLUSTERS
The expressions used below for calculating the vacancy diffusion coefficient and the self-diffusion coefficient rely on a good separation of time scales between the various diffusion events involved: the H jumps in between the bulk sites, the absorption by vacancies, the detrapping from vacancies, and the exchange of vacancies with their first neighbors. We can evaluate the typical waiting time for each one of these events. The time (t1) for the absorption of a H atom can be obtained from the reaction-rate theory ([38], p. 229). Considering that the vacancy is an absorbing sphere of radius√2
2 a0and that the bulk is homogeneous at atomic concentration cH, the integral of the flux at the surface, from zero to t1, equals the quantity of absorbed H during time t1. For a single hydrogen, it gives t1 ∼
a2
0
cHDH
√ 2
16π, where DH is the H diffusion coefficient in the bulk (obtained from D0= 4 × 10⁻⁶m2s−1 and Ea = 0.476 eV, respectively the prefactor and the activation energy, taken from [36]) and a0 is the Ni lattice parameter. Typical values of t1 for T = 600 K are 10−5and 10−8s for cH = 1 ppm and 1000
ppm (10−1 and 10−4 s for T = 300 K). For comparison, the average time for a vacancy hop (τ ∼ a2
0/D) is 0.6 × 10⁻⁴s at T = 600 K (taking D0= 2 × 10⁻⁶m2s−1and Ea= 1.07 eV for evaluating D, from our own calculations for V H0reported below) and 0.6 × 10⁵s at T = 300 K. The mean escape time of H from a vacancy is of the order of 10−8s at 600 K (10−3 s at 300 K) taking ν0= 1.7 × 10¹³s−1and Ea = 0.6 eV [39]. From this, we can conclude that beyond 1 ppm, at 600 K, the hypothesis of the equilibration of H before each vacancy jump is justified for this system (and also at 300 K). Furthermore, the energy barrier for H diffusion among the interstitial sites inside the vacancy are very low (smaller than 0.2 eV). The equilibration between all the variants of a V Hnis therefore reached before any exit event [39]. An important consequence of the separation of time scales is that we can view V Hn diffusion as a regular vacancy random walk, i.e., uncorrelated [40] with respect to H jumps. The correlation factor for self-diffusion is therefore the same as the one for the pure metal. In support of this statement, we give the list of the barriers for a backward jump after a V Hn-Ni exchange, for the (a) paths of the twelve configurations of TableI: 0.88, 0.69, 0.69, 0.57, 0.85, 0.65, 0.48, 0.69, 0.57, 0.94, 0.79, and 1.25 eV. They are all significantly higher than the barrier for a H jump in the bulk, except one. It corresponds to an event which has a minor influence on the diffusion coefficient. It seems that, in general, H has enough time to diffuse before any attempt to reverse the exchange happens. This is specific to the H interstitial solute for which bulk diffusion is fast with respect to vacancy diffusion. Using kinetic Monte Carlo to evaluate the correlations would require the use of mesoscale techniques to deal with the wide range of time scales, which is out of the scope of this paper.
Finally, neglecting correlations, the effective diffusion coefficient (Deff
vac) is simply proportional to the sum over the configurations j , of clusters containing nH , of the product of the equilibrium probability of the configuration with the sum over all jump paths i of the jump frequency Ŵi
j [41]: Deffvac=1 6 P n,jcV Hnj P iŴ i j P n,jcV Hnj µ 1 √ 2a0 ¶2 . (3)
The problem is to find which configurations and paths con-tribute most to this sum. First, we considered configurations with occupied sites O2 (i.e., sites of the second shell of octahedral sites Fig.1) only, which transform into occupied O1 sites during the metal-vacancy exchange, as potential candidates for H-accelerated vacancy diffusion. Indeed, the barriers were slightly diminished, but the contribution to Eq. (3) is negligible because the weight of such configuration is very small in comparison to configurations with occupied O1 sites. Therefore, only configurations with the highest weights were considered. The thermodynamic model in [42] gives the list of such clusters (Table I and Fig. 2), after validation against Monte Carlo simulations. The weight, which is cV Hj
n/
P
n,jcV Hnj (with cV Hnj = nV Hnjexp(−Ef + nµ
∗), µ∗
the chemical potential of H, and nV Hj
n the degeneracy [42])
depends on the H concentration. To reduce this complexity and ease the analysis later on, the terms that concern the same number of H are grouped and new probabilities are introduced. pj = cV Hj
n/
P
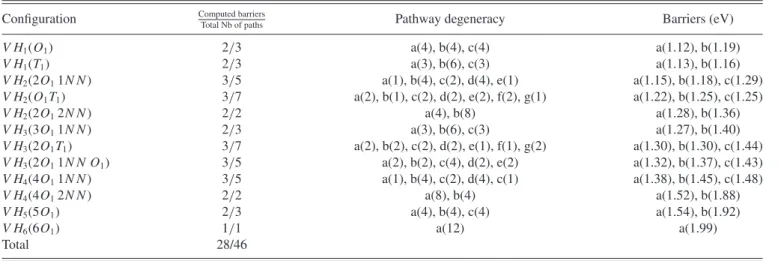
TABLE I. Degeneracy and barriers for the different pathways of each relevant cluster configuration. The letters in the third and fourth columns correspond to the indices of the jump pathways shown in Fig.2, and the alphabetical order corresponds to the ascending order of the energy barriers according to the interaction between Ni∗and the H atoms (see text).
Configuration Computed barriersTotal Nb of paths Pathway degeneracy Barriers (eV)
V H1(O1) 2/3 a(4), b(4), c(4) a(1.12), b(1.19)
V H1(T1) 2/3 a(3), b(6), c(3) a(1.13), b(1.16)
V H2(2O11N N ) 3/5 a(1), b(4), c(2), d(4), e(1) a(1.15), b(1.18), c(1.29)
V H2(O1T1) 3/7 a(2), b(1), c(2), d(2), e(2), f(2), g(1) a(1.22), b(1.25), c(1.25)
V H2(2O12N N ) 2/2 a(4), b(8) a(1.28), b(1.36)
V H3(3O11N N ) 2/3 a(3), b(6), c(3) a(1.27), b(1.40)
V H3(2O1T1) 3/7 a(2), b(2), c(2), d(2), e(1), f(1), g(2) a(1.30), b(1.30), c(1.44)
V H3(2O11N N O1) 3/5 a(2), b(2), c(4), d(2), e(2) a(1.32), b(1.37), c(1.43)
V H4(4O11N N ) 3/5 a(1), b(4), c(2), d(4), c(1) a(1.38), b(1.45), c(1.48)
V H4(4O12N N ) 2/2 a(8), b(4) a(1.52), b(1.88)
V H5(5O1) 2/3 a(4), b(4), c(4) a(1.54), b(1.92)
V H6(6O1) 1/1 a(12) a(1.99)
Total 28/46
the clusters containing nH ; it does not depend on µ∗ and therefore is independent of cH. Pn=P
jcV Hnj/
P
n,jcV Hnj is
the fraction of VHnclusters, among all clusters; it depends on cH. The average jump frequency of VHnis also introduced as
hŴni = X
j
pjŴj, (4)
where Ŵj, the jump frequency for cluster V Hnj, is given by Ŵj = 1 12 X i gikBT h exp(−1G i / kBT), (5) where giis the degeneracy of the pathway (i is the label of the path) andP
igi = 12. With these definitions, Deffvacis
Dvaceff = a02 6 X n=0 PnhŴni = 6 X n=0 PnDvacn , (6) where Dn
vac is the average diffusion coefficient of the V Hn clusters.
We now give Ŵjand explain how we truncate Eq. (5) to re-duce the number of saddle searches. The charge redistribution at the saddle point, as a function of n, is analyzed and a simple
O
1
O2
T1
FIG. 1. (Color online) Vacancy (light gray ball) in an fcc struc-ture is surrounded by six octahedral first neighbors (O1), eight
tetrahedral first neighbors (T1), and eight octahedral second neighbors
(O2).
model for the evolution of the energy barrier with n is proposed. Then Deff
vacand the effective self-diffusion coefficient Dselfeff are given and analyzed in terms of which cluster dominates in which (T,cH) range.
A. Vacancy migration and jump frequency: DFT results
In the pure metal, the 12 pathways for the Ni-vacancy exchange are identical. A barrier of 1.07 eV is found, in close agreement with experimental diffusion activation energies (1.04 [43], 1.05 [44], and 1.01 eV [45]). The vibrational free energy difference 1GN ivib is given by Eq. (2) with the computed phonon frequencies of pure Ni in the initial and saddle configuration. The attempt frequency defined as
ν =kBT
h exp(1Gvib/ kT) (7)
is found to be 17 THz in the temperature range of interest, which is close to the experimental value (50 THz [46]) and to other calculations (22 THz [47]).
Including H has a high computational cost, not only because of the number of saddle searches, but also because convergence in the vicinity of saddle is slow. Regarding the vibrational free energy, we have investigated two levels of approximation. As a first approach, the influence of H on 1Gvib is ignored and the model is developed with the ν of the pure metal until we quantify the contribution of each cluster configuration to Deff
vac.
Then, full phonon calculations are performed for a limited number of key saddle configurations, identified within the first approximation. The results of both approach are compared.
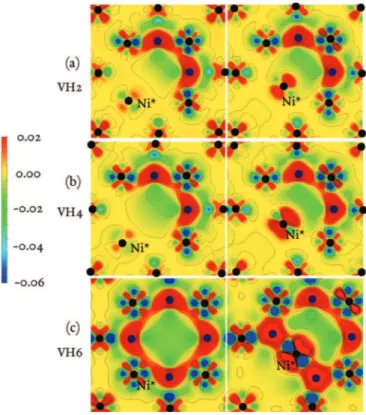
There are 46 jump pathways to consider in order to evaluate the jump frequencies of the 12 cluster configurations listed in TableI. The first barrier calculations showed that trapped H has a repulsive effect, i.e., the barrier increases with the H content. The analysis of the differential electronic charge distribution [δρ(N i + V Hn) = ρ(Ni + V Hn) − ρ(Ni + V ) − ρ(Hn)], at the saddle point, and the comparison between VH2, VH4, and especially VH6 show how electrons are redistributed in the presence of H (Fig. 3). At low H content, the redistribution is subtle with modifications around every atom in the system, including the Ni in saddle configuration (Ni∗) and the H atoms.
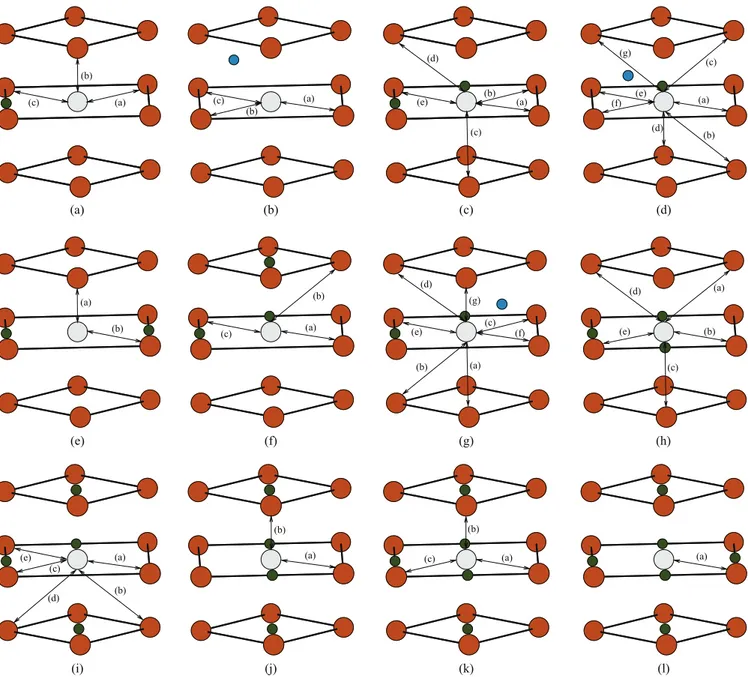
(a) (b) (c) (d) (e) (a) (b) (a) (b) (c) (a) (b) (a) (b) (c) (a) (c) (b) (a) (b) (c) (a) (b) (c) (d) (e) (g) (f) (a) (b) (c) (d) (e) (a) (a) (b) (c) (d) (e) (a) (b) (c) (d) (f) (e) (g) (e) (i) (a) (f) (j) (b) (g) (k) (c) (h) (l) (d)
FIG. 2. (Color online) Schematic illustration of low barrier vacancy jumps. The vacancy position is represented by light gray circles, while H in O1 and T1 positions (Fig.1) are represented by smaller circles. The different jump pathways are indicated by arrows for each V Hn
configuration.
The case of VH6is clearer: the presence of two H first neighbor of Ni∗ involves a large electronic redistribution around this atom. This is confirmed by the Bader charge on Ni∗(TableII) which slowly decreases with H content, and abruptly drops in the case of VH6. There seems to be a good correlation with
TABLE II. Bader charge on Ni∗ (in electrons), in the saddle
configuration of path (a) and the corresponding energy barrier 1Em
(in eV).
Cluster Bader charge 1Em
V H0 10.02 1.07
V H2 9.95 1.15
V H4 9.60 1.38
V H6 8.75 1.99
the barrier evolution (TableII). It is also found that the Bader charges on the two H atoms in first neighbor positions are not modified, while the ones on the other H are. This modification is however much lower than the one on Ni∗. Motivated by these observations, we model the variation of the energy barrier by a simple function of pair interactions between Ni∗ and the neighboring H:
1Em= 1Em0 + n1ǫ1+ 2n1−1ǫH −H1−1 + n2ǫ2+ n3ǫ3, (8) where 1E0
m is the energy barrier in pure Ni, ǫk is the pair interaction between Ni∗ and H in kth neighbor position (nk is the number of such H), and ǫH −H
1−1 is the extra increase of the barrier when two H are first neighbors of Ni∗(n1−1 is the number of H-H pair in first neighbor of Ni∗). With parameters 1E0
FIG. 3. (Color online) Differential electronic density maps in the (100) plane containing the vacancy, in the initial configuration (left) and in the saddle configuration (right) for (a) VH2, (b) VH4, and (c)
VH6. The configurations are those which give the lowest barriers in
TableI.
ǫ1−1H −H = 0.12 (in eV), all the values of the barriers in TableI, except one, are reproduced with an error less than 5%. The large value of ǫ1−1H −H was a motivation to look for possible multiple jumps where H first neighbors of Ni∗, would migrate to either a T1, Tbulk, or O2 site during the metal-vacancy exchange. These barriers were always higher than those where H remains on its original site. The general trend given by the model is that the closer the Ni∗ atom is to an H atom when jumping over the barrier, the higher the barrier. Therefore, we can find the lowest barriers by packing the H as far as possible from the jumping Ni.
Based on this model, we ordered the barriers by increasing value, for each configuration j , and used this to truncate the sum in Eq. (5), with a controlled precision. Indeed, the truncated sum is a lower bound for the actual jump frequency
(Ŵlower). An upper bound (Ŵupper) is obtained by replacing all
the missing terms by the last term calculated. The relative error is η =Ŵupper−Ŵlower
Ŵlower . Finally, only the barriers corresponding to
28 jump pathways were computed (Table I) and lead to η values always lower than 33%. This is a sufficient precision to discuss the experimental results, which report an increase of substitutional diffusion by several orders of magnitude.
Finally, the phonon frequencies were calculated in the initial and saddle configurations of the jump path with the lowest barrier for clusters VH0, VH1, VH2, VH3, VH4 and VH5 (see Table I). The corresponding attempt frequencies [Eq. (7)] vary slowly between 300 and 600 K. The average values are respectively 1.65 × 10¹³, 1.13 × 10¹³, 1.25 × 10¹³,
TABLE III. Activation energy Ea(eV) and prefactor D0(m2s−1)
corresponding to the V Hndiffusivities, obtained by fitting Dvacn to
the Arrhenius form. E∗
a and D∗0 include the phonon contribution
from VH1, VH2, VH3, VH4, and VH5, while the previous columns
correspond to the approximation of constant vibrational entropy evaluated in the pure metal.
Cluster Ea D0 Ea∗ D0∗ V H0 1.07 2.03 × 10⁻⁶ 1.07 2.03 × 10⁻⁶ V H1 1.13 1.09 × 10⁻⁶ 1.14 0.88 × 10⁻⁶ V H2 1.17 0.50 × 10⁻⁶ 1.20 0.91 × 10⁻⁶ V H3 1.29 0.55 × 10⁻⁶ 1.27 0.71 × 10⁻⁶ V H4 1.40 0.55 × 10⁻⁶ 1.40 2.65 × 10⁻⁶ V H5 1.54 0.68 × 10⁻⁶ 1.53 1.23 × 10⁻⁶ V H6 1.99 2.03 × 10⁻⁶
3.17 × 10¹³, 9.0 × 10¹³, and 4.35 × 10¹³ Hz. The effect is noticeable only on clusters with a high H content, which dom-inate diffusion at large H concentrations. These frequencies are taken into account in all figures below, however, we will see that the influence on the effective diffusion coefficients is minor and limited to high H concentrations.
B. Vacancy diffusion
We start by analyzing the average diffusion coefficient of clusters, as a function of the number of H. The prefactor and activation energy for Dn
vacare obtained by fitting a20hŴni (T ) to the Arrhenius form, in the range between 300 and 600 K. They are presented in TableIII. The activation energies are close to the clusters’ lowest jump barrier (TableI) and the prefactors are nearly constant.
The Arrhenius plots of the vacancy effective diffusion coefficients, for three different H concentrations, are presented in Fig. 4 (note that Dvaceff is on a log scale). A linear behavior is observed for pure Ni with an activation energy of 1.07 eV and a prefactor of 2.0 × 10⁻⁶m2s−1. The two curves corresponding to the presence of H, located below that of the pure metal, exhibit a non-Arrhenius behavior. To determine its origin, the clusters’ contributions to the diffusivity and the cluster distribution for the case of high H concentration, are respectively presented in Figs.4(a)and4(b). The diffusion curve with 1000 ppm H can be divided in two parts. Below 500 K, the V H2contribution is dominant, because of its small activation energy and despite a much larger fraction of V H5 and V H6 clusters [Fig. 4(b)], because they diffuse slowly. Above 500 K the main contribution comes from V H0. It has the lowest activation energy and its fraction starts to increase noticeably at this temperature. A switch from V H2dominated diffusion to V H0could be an explanation to the non-Arrhenius behavior.
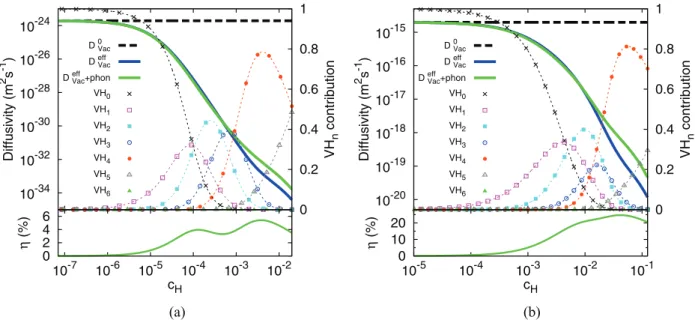
Finally, the variation of the vacancy diffusion coefficient with the bulk H concentration, for 300 and 600 K, is presented in Figs.5(a)and5(b), respectively. The corresponding cluster distributions can be found in [42] (Figs.5and6). An increasing H concentration decreases the vacancy diffusion coefficient. The effect is particularly drastic at room temperature, where a decrease by 10 orders of magnitude is expected (5 orders of magnitude at 600 K). However, the practical consequences
10-32 10-28 10-24 10-20 10-16 10-12 0 0.2 0.4 0.6 0.8 1 Diffusivity (m 2 s -1 ) VH n contribution D 0Vac D effVac (10 ppm) D effVac (103 ppm) VH0 VH1 VH2 VH3 VH4 VH5 VH6 0 10 1.5 2.0 2.5 3.0 3.5 η (%) 1000/T (K-1) CH = 10 ppm CH = 103 ppm 0 0.2 0.4 0.6 0.8 1 1.5 2 2.5 3 3.5 VH n fraction 1000/T (K-1) VH0 VH1 VH2 VH3 VH4 VH5 VH6 ) b ( ) a (
FIG. 4. (Color online) (a) Vacancy diffusion coefficients in pure Ni (D0
vac) and in hydrogenated Ni (Dvaceffat cH = 10 and cH= 1000 ppm).
The contribution of each cluster to the diffusivity at cH = 1000 ppm is also shown. The lower graph presents the relative errors in the vacancy
diffusion coefficient at cH= 10 and cH= 1000 ppm [see text for details on the truncation of Eq. (5)]. (b) For comparison, the distribution of
V Hnclusters as a function of temperature at cH = 1000 ppm is plotted from the thermodynamic model in [42]. are rather limited because the vacancies are already immobile
at 300 K on the time scale of fracture in service, even in the absence of H. On the contrary, at 600 K, the vacancies remain mobile. Note that the different treatments of the vibrational entropy are almost indistinguishable, except at high H content.
C. Self-diffusion
At low vacancy concentration, self-diffusion is dominated by monovacancies. Similar to the vacancy case, the Ni
self-diffusion coefficient (Deffself) is the sum of the contributions of each V Hncluster: Dselfeff = 6 X n=0 Dselfn = a2f 6 X n=0 cnhŴni , (9) where cnand Dn
selfare, respectively, the concentration and the diffusion coefficient of cluster V Hn, and f is the correlation factor. f is taken as the pure metal value of 0.781 [40] as discussed above. From Eq. (9), since all terms are positive, there is no doubt the presence of H increases Ni self-diffusion
10-34 10-32 10-30 10-28 10-26 10-24 0 0.2 0.4 0.6 0.8 1 Diffusivity (m 2 s -1 ) VH n contribution D 0Vac D effVac
D effVac+phon
VH0 VH1 VH2 VH3 VH4 VH5 VH6 0 2 4 6 10-7 10-6 10-5 10-4 10-3 10-2 η (%) cH 10-20 10-19 10-18 10-17 10-16 10-15 0 0.2 0.4 0.6 0.8 1 Diffusivity (m 2 s -1 ) VH n contribution D 0Vac D effVac
D effVac+phon
VH0 VH1 VH2 VH3 VH4 VH5 VH6 0 10 20 10-5 10-4 10-3 10-2 10-1 η (%) cH (b) (a)
FIG. 5. (Color online) (a) Vacancy diffusion coefficient as a function of cH, at 300 K, in pure Ni and in hydrogenated Ni. The contribution
of each cluster to the diffusivity is also shown (upper graph). The relative error, due to the truncation of Eq. (5), is given on the lower graph. (b) Same as (a) but for T = 600 K.
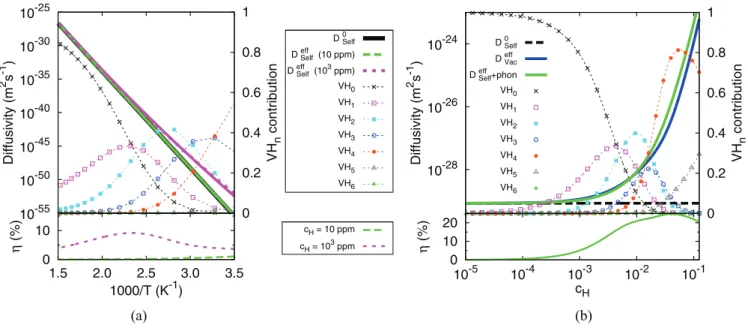
10-28 10-26 10-24 0 0.2 0.4 0.6 0.8 1 Diffusivity (m 2 s -1 ) VH n contribution D 0Self D effVac
D effSelf+phon
VH0 VH1 VH2 VH3 VH4 VH5 VH6 0 10 20 10-5 10-4 10-3 10-2 10-1 η (%) cH 10-55 10-50 10-45 10-40 10-35 10-30 10-25 0 0.2 0.4 0.6 0.8 1 Diffusivity (m 2 s -1 ) VH n contribution D 0Self D effSelf (10 ppm) D effSelf (103 ppm) VH0 VH1 VH2 VH3 VH4 VH5 VH6 0 10 1.5 2.0 2.5 3.0 3.5 η (%) 1000/T (K-1) cH = 10 ppm cH = 103 ppm (b) (a)
FIG. 6. (Color online) (a) Ni self-diffusion coefficients in pure Ni and in hydrogenated Ni (cH= 10 and cH= 1000 ppm). The contribution
of each cluster at cH= 1000 ppm is shown on the upper graph. The relative errors for cH= 10 and cH= 1000 ppm are presented in the lower
graph. (b) Self-diffusion coefficient at T = 600 K, as a function of cH.
if the vacancies are in equilibrium. If the vacancy supply is slow compared to H uptake, the reduction of vacancy-mediated diffusion is dramatic, as shown above.
The Arrhenius plots of the Ni self-diffusion coefficients, without and with H, are presented in Fig. 6(a). Fitting the self-diffusion coefficient to the Arrhenius form gives an activation energy of 2.85 eV and a prefactor of 7.9 × 10⁻⁶m2s−1, which are close to the experimental results given by Neumann [48] (activation energy of 2.87 eV and prefactor of 8.5 × 10⁻⁵m2s−1). A concentration of 10 ppm H does not significantly affect the diffusion coefficient: the curves are on top of each other on Fig.6(a), while a significant increase is observed at 1000 ppm. The clusters’ contributions are the same as the one already discussed for vacancy diffusion at the 1000 ppm case: V H0 dominates at high temperature, while, at low temperature, the diffusion curve follows the Arrhenius plot of Dself2 (V H2). The increase in the vacancy concentration, due to the reduction in the vacancy formation energy, overcompensates the increase of the jump barrier.
The increase in self-diffusivity is of seven orders of magnitude at 300 K (not shown) at 1% H, but the diffusion coefficient is still in the range of 10−50m2s−1. On the contrary, at T = 600 K [Fig. 6(b)], up to five orders of magnitude increases are obtained, which brings diffusivity in a range that could be relevant to oxidation experiments, as will be discussed further below. This is obtained, however, for very high H concentrations of several percents. This result is robust: by decreasing the vacancy formation energy by 0.2 eV, the diffusivities are enhanced by two orders of magnitude, but the H concentration where the shoot up starts is only decreased by a factor 3, at 600 K.
IV. DISCUSSION AND CONCLUSION
We now discuss the main findings with regard to experimen-tal observations, first concerning H effects at room temperature
and, second, concerning enhanced metal diffusion at interme-diate temperature. At room temperature, in Ni, vacancies do not diffuse on the time scale of laboratory experiments in the absence of shortcuts. Our estimate of the diffusion coefficient is consistent with high temperature activation energies [48] and implantation-annealing experiments [49]. H is found to
reinforce this, by further trapping the vacancy. This effect has been observed in irradiated Nb [50] and Al [51] in the presence of H, but not in Ni because the detrapping of H from the vacancies occurs at temperatures lower than those necessary for the vacancies to become mobile [49,52]. The barriers for metal-vacancy exchange are always higher when H is present inside the vacancy. This reduced mobility should be considered when interpreting H embrittlement by vacancy-hydrogen clusters agglomeration at low temperature [11,53,54].
On the contrary, above 600 K, vacancy-hydrogen clusters are always mobile, although much slower than vacancies alone. In the Introduction, we mentioned that an enhanced Cr diffusion could be observed during oxidation in PWR environment. We can wonder if this can be attributed to SaVs or, more generally, if H effects on diffusion are worth being considered in these conditions. The activation barrier for Cr diffusion in Ni [55] is similar to that for Ni self-diffusion. This opens the possibility of extending our results provided a few additional calculations are made. A single Cr atom was introduced in the simulation box. The H-Cr interaction is repulsive by about 0.07 eV in the bulk. The same trend is observed inside a vacancy with a Cr atom in first neighbor position. The H segregation energies are −0.15, −0.14, and −0.23 eV with increasing H-Cr distance and H on O1sites. For comparison, the segregation energy is −0.22 eV in the absence of Cr. The activation energy for the Cr-vacancy exchange is very similar to the Ni case (the values are given below in parenthesis). The barriers are 1.04 eV (1.07 eV), 1.12 eV (1.12 eV), and 1.33 eV (1.38 eV) for, respectively,
atom-vacancy exchange without H, path (a) of V H1(O1), and path (a) of V H4(4O11NN). Finally, the influence of a single Cr on the vacancy formation energy is negligible. These additional results imply that the extension of our results to Cr in Ni is straightforward. Cr diffusion measurements in pure Ni are in good agreement with DFT calculations, and are of the order of 10−28m2s−1at 600 K, with a spreading of a factor 5 (see Table III in [55]). Therefore, an observable modification of the Cr profile, corresponding to a typical oxidation time of 500 h, would require an increase of the diffusion coefficient by at least four orders of magnitude. From Fig.6(b), equilibrium vacancy-hydrogen clusters can yield this increase but only for cH higher than 5%. Such a large H uptake has never been reported and therefore the vacancy concentration increase is to be found in the complex, out of equilibrium, processes related to the oxide film growth. Nevertheless, a H uptake of 2000 ppm was reported [53] and it will have a non-negligible impact on out of equilibrium vacancy diffusion by slowing them by a factor 10 [Fig.5(b)].
In conclusion, we developed a model for the diffusion of VHn clusters in Ni. The method relies on a remarkable separation of time scales between H and vacancy diffusion. This separation is likely to be valid for other metal-H systems, to which the method could be applied. The ingredients are the following: the cH and T range are such that H bulk diffusion and trapping are fast and the barriers for H detrapping are low in comparison with VHn-metal exchange. Furthermore, the energy barrier for the reverse exchange should be higher than the barrier for H bulk diffusion to enable a fast redistribution
of H. Under these conditions, H is considered always in equilibrium and the VHn clusters perform an uncorrelated random walk. The effective diffusion coefficient is a sum over the jump paths (i.e., over the VHnconfigurations times the 12 possible exchanges with the first neighbors) of the equilibrium probability of being in the VHn configuration, times an activation term. We showed that the effective interaction between the jumping Ni and the H inside the vacancy is repulsive. As a consequence, the activation barrier increases with the H content. This induces a drastic slowing down of vacancy diffusion. On the contrary, at equilibrium (i.e., after a time long enough to obtain the vacancy enrichment subsequent to a fast H uptake), metal transport is always enhanced. In the Ni and Ni-Cr cases, a noticeable speed up can only be expected at high H concentrations (beyond 2000 ppm at 600 K). The strongest effect is undoubtedly the trapping of out of equilibrium vacancies that should be considered when modeling metal transport during oxidation.
ACKNOWLEDGMENTS
It is a pleasure to thank Maylise Nastar (CEA/SRMP) for discussions about correlations during diffusion and Danny Perez (LANL) for reading and correcting the manuscript. This work was granted access to the HPC resources of CALMIP (CICT Toulouse, France) under the allocations 2014-p0912 and 2014-p0749. The authors acknowledge the support of the French Agence Nationale de la Recherche (ANR), under grant
EcHyDNA(Blanc 10-19424).
[1] C. L. Fu, M. Krˇcmar, G. S. Painter, and X.-Q. Chen,Phys. Rev. Lett. 99,225502(2007).
[2] J. Xu, C. T. Liu, M. K. Miller, and H. Chen,Phys. Rev. B 79,
020204(R)(2009).
[3] T. Kresse, Y. Li, T. Boll, C. Borchers, P. Choi, T. Al-Kassab, D. Raabe, and R. Kirchheim,Scr. Mater. 69,424(2013). [4] T. Kresse, C. Borchers, and R. Kirchheim,Scr. Mater. 69,690
(2013).
[5] T. Iida, Y. Yamazaki, T. Kobayashi, Y. Iijima, and Y. Fukai,
Acta Mater. 53,3083(2005).
[6] Y. Fukai, The Metal-Hydrogen System: Basic Bulk
Proper-ties, 2nd ed. (Springer-Verlag, Berlin and Heidelberg GmbH
& Co. K, 2003).
[7] E. Hayashi, Y. Kurokawa, and Y. Fukai, Phys. Rev. Lett. 80,
5588(1998).
[8] N. Fukumuro, M. Yokota, S. Yae, H. Matsuda, and Y. Fukai,
J. Alloys Compd. 580,S55(2013).
[9] Y. Fukai, M. Mizutani, S. Yokota, M. Kanazawa, Y. Miura, and T. Watanabe,J. Alloys Compd. 356–357,270(2003).
[10] S. Lynch,Metall. Mater. Trans. A 44,1209(2013). [11] M. Nagumo,Mater. Sci. Technol. 20,940(2004).
[12] Y. Tateyama and T. Ohno, Phys. Rev. B 67, 174105
(2003).
[13] H. Momida, Y. Asari, Y. Nakamura, Y. Tateyama, and T. Ohno,
Phys. Rev. B 88,144107(2013).
[14] J. Panter, B. Viguier, J.-M. Clou´e, M. Foucault, P. Combrade, and E. Andrieu,J. Nucl. Mater. 348,213(2006).
[15] D. K. Schreiber, M. J. Olszta, D. W. Saxey, K. Kruska, K. L. Moore, S. Lozano-Perez, and S. M. Bruemmer,
Microsc. Microanal. 19,676(2013).
[16] S. Lozano-Perez and J. Titchmarsh,Mater. High Temp. 20,573
(2003).
[17] H. Dugdale, D. E. J. Armstrong, E. Tarleton, S. G. Roberts, and S. Lozano-Perez,Acta Mater. 61,4707(2013).
[18] M. Sennour, P. Laghoutaris, C. Guerre, and R. Molins,J. Nucl. Mater. 393,254(2009).
[19] S. Lozano-Perez, J. Dohr, M. Meisnar, and K. Kruska,
Metall. Mater. Trans. E 1A,194(2014).
[20] P. Scott, in Mechanisms of Materials Degradation and Non-Destructive Evaluation in Light Water Reactors, edited by S. Ishino, B. L. Eyre, and J. I. Kimura (INSS, Osaka, 2002), pp. 107–116.
[21] E. P. Simonen, L. E. Thomas, and S. M. Bruemmer, Proc. of Corrosion 2000 (2000) 226.
[22] F. Jambon, L. Marchetti, F. Jomard, and J. Chˆene,J. Nucl. Mater.
414,386(2011).
[23] F. Jambon, L. Marchetti, F. Jomard, and J. Chˆene,Solid State Ion. 231,69(2013).
[24] M. Dumerval, S. Perrin, L. Marchetti, M. Tabarant, F. Jomard, and Y. Wouters,Corros. Sci. 85,251(2014).
[25] P. Hohenberg and W. Kohn,Phys. Rev. 136,B864(1964). [26] W. Kohn and L. Sham,Phys. Rev. 140,A1133(1965). [27] G. Kresse and J. Hafner,Phys. Rev. B 47,558(1993). [28] G. Kresse and J. Hafner,Phys. Rev. B 49,14251(1994).
[29] G. Kresse and J. Furthm¨uller,Phys. Rev. B 54,11169(1996). [30] Y. Wang and J. P. Perdew,Phys. Rev. B 44,13298(1991). [31] J. P. Perdew, J. A. Chevary, S. H. Vosko, K. A. Jackson, M. R.
Pederson, D. J. Singh, and C. Fiolhais,Phys. Rev. B 46,6671
(1992).
[32] G. Kresse and D. Joubert,Phys. Rev. B 59,1758(1999). [33] H. Monkhorst and J. Pack,Phys. Rev. B 13,5188(1976). [34] H. J´onsson, G. Mills, and K. Jacobsen, Classical and Quantum
Dynamics in Condensed Phase Simulations(World Scientific, Singapore, 1998).
[35] H. Eyring,J. Chem. Phys. 3,107(1935).
[36] E. Wimmer, W. Wolf, J. Sticht, P. Saxe, C. B. Geller, R. Najafabadi, and G. A. Young,Phys. Rev. B 77,134305(2008). [37] A. van de Walle and G. Ceder,Rev. Mod. Phys. 74,11(2002). [38] S. Redner, A Guide to First-Passage Processes (Cambridge
University Press, Cambridge, UK, 2001).
[39] Y. Wang, D. Conn´etable, and D. Tanguy (unpublished). [40] A. R. Allnat and A. B. Lidiard,Rep. Prog. Phys. 50,373(1987). [41] R. Kirchheim,Solid State Phys. 59,203(2004).
[42] D. Tanguy, Y. Wang, and D. Conn´etable,Acta Mater. 78,135
(2014).
[43] Atomic Defects in Metals, edited by H. Ullmaier, Landolt-B¨ornstein, New Series, Group III, Vol. 25: Crystal and Solid State Physics (Springer, Berlin, 1991), p. 211.
[44] J. Wolff, M. Franz, J.-E. Kluin, and D. Schmid,Acta Mater. 45,
4759(1997).
[45] L. C. Smedskjaer, M. J. Fluss, D. G. Legnini, M. K. Chason, and R. W. Siege, in Positron Annihilation, edited by P. G. Coleman, S. C. Sharma, and L. M. Diana (North-Holland, Amsterdam, 1982).
[46] A. Seeger and H. Mehrer, in Vacancies and Interstitials in Metals, edited by A. Seeger, D. Shumacher, W. Schilling, and J. Diehl, Topics in Applied Physics (North-Holland, Amsterdam, 1970), p. 1.
[47] S. B. Debiaggi, P. M. Decorte, and A. M. Monti,Phys. Status Solidi B 195,37(1996).
[48] G. Neumann and V. T¨olle, Philos. Mag. A 54, 619
(1986).
[49] H. Rajainm¨aki, S. Linderoth, H. E. Hansen, and R. M. Nieminen,
J. Phys. F 18,1109(1988).
[50] P. Hautoj¨arvi, H. Huomo, P. Saariaho, A. Vehanen, and J. Yli-Kauppila,J. Phys. F 13,1415(1983).
[51] S. Linderoth, H. Rajainm¨aki, and R. M. Nieminen,Phys. Rev. B 35,5524(1987).
[52] F. Besenbacher, J. Bøttiger, and S. Myers,J. Appl. Phys. 53,
3536(1982).
[53] R. Rios, T. Magnin, D. Noel, and O. de Bouvier,Metall. Mater. Trans. A 26,925(1995).
[54] K. Takai, H. Shoda, H. Suzuki, and M. Nagumo,Acta Mater.
56,5158(2008).
[55] J. D. Tucker, R. Najafabadi, T. R. Allen, and D. Morgan,J. Nucl. Mater. 405,216(2010).