© Haiming Liu, 2020
Trace element compositions of native gold
Thèse
Haiming Liu
Doctorat interuniversitaire en sciences de la Terre
Philosophiæ doctor (Ph. D.)
Trace element compositions of native gold
Thèse
Haiming Liu
Sous la direction de :
iii
Résumé
L'or natif est considéré comme le minéral indicateur le plus important pour les gisements contenant de l'Au. Cette thèse de doctorat vise à caractériser les compositions en éléments majeurs, mineurs et traces dans l'or provenant de divers systèmes de minéralisation aurifère. Des échantillons représentatifs ont été recueillis dans divers types de gisements aurifères, y compris des gisements d’or d'orogénique, sulfures massifs volcanogènes (SMV), porphyre Cu-Au, épithermaux à Au-Ag et des gisements d'or liés aux intrusions à caractère réducteur (RIRG). Ces gisements ou districts ont été sélectionnés en fonction de leur diversité des roches hôtes, du grade métamorphique, de l'âge de minéralisation, du cadre tectonique et de l'association minérale. Les grains d'or ont été étudiés au microscope électronique à balayage (MEB) pour les associations minérales et les assemblages d'inclusions, à la microsonde électronique (EMPA) pour les éléments majeurs et mineurs et au spectromètre de masse à plasma à couplage inductif par ablation laser (LA-ICP-MS) pour les éléments traces.
La combinaison des analyses SEM, EPMA et LA-ICP-MS permet de caractériser le zonage chimique dans les grains d'électrum hétérogènes des dépôts de Ming et Boliden de SMV métamorphisés. Les observations texturales, couplées à des données de composition in situ, mettent en évidence que le zonage de l'électrum résulte d'une interaction complexe entre la diffusion à l'état solide facilitée par les fluides (SSD) dans le grain, et les réactions de dissolution et de reprécipitation (CDR) couplées à l'interface du grain, en réponse à l'évolution de la composition du fluide et des paramètres extrinsèques, tels que la température, le pH et l'état redox. Les différents rééquilibres locaux, causés par les SSD de deux gisements, sont attribués à différents ligands de transport et aux effets des paramètres physicochimiques des fluides, ce qui entraîne des schémas différents de composition de l'électrum. Les événements métamorphiques de longue durée qui ont affecté les deux gisements, fournissent probablement la température levée pour permettre aux fluides de remobiliser les métaux en trace dans l'électrum, ce qui entraîne le zonage chimique complexe dans l'électrum dans les gisements de SMV contenant de l'or.
L'analyse discriminante par les moindres carrés partiels (PLS-DA) a permis d'identifier les caractéristiques de composition des grains d'or provenant de dépôts orogéniques en fonction de l'association minérale, de la texture de l'or et des roches encaissantes dominantes. Les variations de composition chimique de l'or avec différents assemblages minéraux associés sont liées à la répartition des éléments en trace entre les minéraux co-cristallisants et l'or durant la précipitation. Les inclusions d'or dans les minéraux de la gangue sont différenciées de l'or ultérieur dans les fractures en fonction des teneurs en Ag, Fe, Pb et Bi, ce qui indique des différences dans la composition du fluide hydrothermal des différents stades paragénétiques. Les gisements d’or orogénique hébergés dans différentes roches encaissantes régionales peuvent être discriminé par Ag, Cu, Pd, Sb et Hg, probablement en raison de la réaction des fluides hydrothermaux avec les roches hôtes.
iv
Les résultats de PLS-DA suggèrent que les teneurs en Pd, Ag, Sb, Pb, Cu, Hg, Te dans les grains d'or ont un fort potentiel de discrimination de l'or des différents types de gisements. La comparaison des données de composition aurifère de différents types de gisements par les modèles de classification Random Forests peut être utilisée comme outil de modélisation prédictive pour fournir une indication précise des types de gisements d'or. Les éléments traces contenus dans l'or natif pourraient présenter une signature géochimique particulière et aider à établir des critères discriminants pour reconnaitre les différentes sources d'or faisant référence à divers types de gisements aurifères. Ceci offre l'opportunités d'appliquer ces méthodes aux minéraux indicateurs dans les sédiments en exploration minérale.
v
Abstract
Native gold is considered to be the most significant indicator mineral for Au-bearing deposits. This PhD thesis aims to characterize major, minor and trace element compositions in gold from various gold mineralization systems. Representative samples were collected from various Au-bearing deposit types, including orogenic, volcanogenic massive sulfide (VMS), porphyry Cu-Au, epithermal Au-Ag, and reduced intrusion-related gold (RIRG) deposits. These deposits were selected according to their diversity in host rocks, metamorphic grade, age of mineralization, tectonic setting and mineral association. The gold grains were investigated by scanning electron microscope (SEM) for mineral associations and inclusion assemblages, electron probe microanalyzer (EMPA) for major and minor elements composition, and laser ablation-inductively coupled plasma-mass spectrometry (LA-ICP-MS) for the trace element compositions.
Combination of SEM, EPMA and LA-ICP-MS analyses enables characterization of chemical zoning in heterogeneous electrum grains from metamorphosed Ming and Boliden VMS deposits. The textural observations, coupled with in-situ compositional data, highlight the zoning in electrum arises from a complex interaction between fluid facilitated solid-state diffusion (SSD) within the grain, and coupled dissolution and reprecipitation (CDR) reactions at the grain interface, in response to changing fluid composition and extrinsic parameters, such as temperature, pH, and redox state. The different local re-equilibrium caused by SSD from two deposits are attributed to different transport ligands and effects of physicochemical parameters of fluids, resulting in different compositional zoning patterns within electrum. The long-lived metamorphic events that affected both the deposits, probably provide the elevated temperature and deformation to allow pervasive fluids to remobilize trace metals in electrum, which result in the complex chemical zoning in electrum in Au-bearing VMS deposits.
Partial least squares-discriminant analysis (PLS-DA) has identified compositional characteristics of gold grains from orogenic deposits based on mineral association, gold texture and dominant country rocks. Chemical variations in gold with different associated mineral assemblages are related to the partitioning of trace elements between co-crystalizing minerals and gold during precipitation. Gold inclusions in gangue minerals are discriminated from later gold in fractures based on contents of Ag, Fe, Pb, and Bi, which indicates differences in the hydrothermal fluid composition from different paragenetic stages. Gold hosted in different regional country rocks can be discriminated by Ag, Cu, Pd, Sb, and Hg, likely because of interaction of hydrothermal fluids with host rocks.
PLS-DA results suggest that Pd, Ag, Sb, Pb, Cu, Hg, Te contents in gold grains have high potential to discriminate gold from different deposit types. Comparison of gold compositional data from different deposit types using Random Forests classification models offers a predictive modeling tool for an accurate indication of
vi
gold deposit types. Trace elements contained in native gold could present a particular geochemical signature and help establish discriminant criteria to recognize the different sources of gold referring to various gold-bearing deposit types. This offers an opportunity to apply these methods to indicator minerals in sediments in the field of mineral exploration.
vii
Table of content
Résumé ... iii
Abstract ... v
Table of content ... vii
List of figures ... x
List of tables ... xvii
List of appendices ... xviii
List of abbreviations ... xix
Acknowledgments ... xxi
Foreword ... xxiii
Introduction ... 1
Chapter 1 Dissolution-reprecipitation vs. solid-state diffusion in electrum: examples from metamorphosed Au-bearing, volcanogenic massive sulfide (VMS) deposits ... 10
1.1 Résumé ... 11
1.2 Abstract ... 12
1.3 Introduction ... 13
1.4 Geology of the selected deposits and sample description ... 15
1.5 Analytical methods ... 17
1.6 Electrum textures ... 18
1.7 Chemical composition of electrum ... 21
1.8 Discussion ... 26
1.8.1 Formation of zoned electrum at Ming ... 26
1.8.2 Formation of zoned electrum at Boliden ... 28
1.8.3 Relationship between zoning in electrum and metamorphism ... 31
1.9 Conclusions ... 32
1.10 References ... 33
Chapter 2 Trace element composition of native gold from orogenic gold deposits ... 42
2.1 Résumé ... 43
2.2 Abstract ... 44
2.3 Introduction ... 45
2.4 Samples and analytical methods ... 46
2.4.1 Sample collection ... 46
viii
2.4.3 Data pre-processing ... 53
2.4.4 Partial least squares discriminant analysis ... 54
2.5 Results ... 55
2.5.1 Gold texture ... 55
2.5.2 Geochemistry of native gold ... 56
2.5.3 Multivariate statistics of gold trace element composition ... 59
2.6 Discussion ... 64
2.6.1 Inclusions in native gold ... 64
2.6.2 Solid solutions in native gold ... 65
2.6.3 Controls of mineral association on gold composition ... 67
2.6.4 Controls by hydrothermal fluid composition ... 68
2.6.5 Native gold composition in relation to host rocks ... 69
2.7 Conclusions ... 70
2.8 References ... 72
Chapter 3 Native gold chemical compositions in gold-bearing ore deposits ... 86
3.1 Résumé ... 87
3.2 Abstract ... 88
3.3 Introduction ... 89
3.4 Samples and analysis methods ... 90
3.4.1 Sample preparation ... 90 3.4.2 Petrography ... 98 3.4.3 EPMA analysis ... 98 3.4.4 LA-ICP-MS analysis ... 98 3.5 Statistical methods ... 100 3.5.1 Data pre-processing ... 100
3.5.2 Partial least squares discriminate analysis ... 100
3.5.3 Random Forests ... 101
3.6 Results ... 101
3.6.1 Gold petrography ... 101
3.6.2 Gold heterogeneity ... 104
3.6.3 Chemical composition of gold ... 106
3.6.4 PLS-DA of gold compositions based on EPMA and LA-ICP-MS data ... 110
ix
3.7.1 Au and Ag contents in gold ... 114
3.7.2 Copper contents in gold ... 115
3.7.3 Zoned electrum ... 115
3.7.4 Relationship between trace element compositions of gold and deposit types ... 116
3.7.5 Gold deposit type predictions ... 118
3.8 Conclusion ... 120 3.9 References ... 121 General conclusion ... 132 Recommendations ... 135 References ... 136 Appendices ... 139
x
List of figures
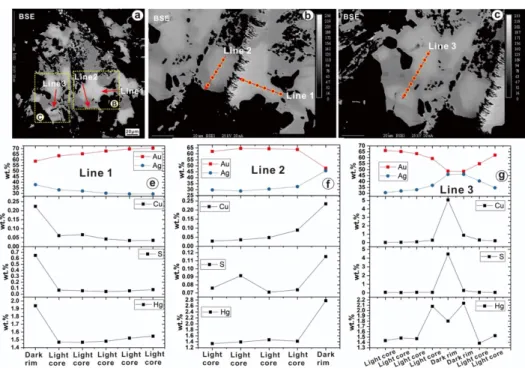
Figure 1- 1 Simplified geological map of the Ming VMS deposit within the Pacquet Complex, modified after Castonguay et al. (2009), the orebodies are projected on the surface by Brueckner et al. (2016). ... 16 Figure 1- 2 Simplified geological map of the major Skellefte VMS deposit region showing the location of the Boliden VMS deposit, modified after Wagner et al. (2007). ... 17 Figure 1- 3 Representative ore samples from Ming (a-c) and Boliden (d-f) showing mineral associations and electrum textures. (a) Anhedral electrum occurs along the boundaries of bornite and is associated with chalcocite; sample M1807. (b) Anhedral electrum intergrows with bornite, chalcocite and cataclastic massive pyrite; sample M1807. (c) Elongated electrum with light white Ag-rich rims is along the boundary of bornite and in contact with chalcocite; sample M1807. (d) Anhedral electrum occurs along the boundaries of arsenopyrite in quartz matrix; sample BLD210. (e) Anhedral electrum under reflected light showing a dark-yellow Au-rich core and light-yellow Ag-rich rim, in contact with aurostibite; sample BLD210. (f) Anhedral electrum intergrows with recrystallized arsenopyrite and in contact with aurostibite; sample BLD210. (g) Electrum intergrows with chalcopyrite and is associated with minor arsenopyrite, pyrite, and trace stibnite; sample BLD-1. (h) Anhedral electrum occurs as veinlets filling in the fractures of quartz vein material with foliated pyrite; sample BLD-1. (i) Anhedral electrum intergrows with fractured pyrite and chalcopyrite; sample BLD-1. Abbreviations: Apy = arsenopyrite, Aur = aurostibite, Bn = bornite, Cc = chalcocite, Ccp = chalcopyrite, El = electrum, Py = pyrite. ... 19 Figure 1- 4 Backscattered electron images showing internal microstructures in zoned electrum from the Ming and Boliden deposits. Electrum in (a) and (d) correspond to the samples in Figures 1-3 a and b, whereas electrum in (g) corresponds to the sample in Figure 1-3g. (b) Example of the incongruent layers and porous texture at the interface between the Au-rich transition and Ag-rich rim. The light grey layers are Au-rich, whereas the dark grey layers are Ag-rich. The yellow arrows indicate the reaction front with a sharp contact. (c) Variations in thickness of reprecipitated multiple Ag-rich layers. (e) The yellow arrows indicate the gradual contact between the Au-rich electrum core (light grey) and Ag-rich electrum rim (dark grey). (f) The sharp and jagged contacts show the consequence of CDR reactions at the interface. (h) Example of the gradual contact between a Au-rich core (light grey) and Ag-rich rim (dark grey). (i) The yellow arrows show the gradual contact between the core and rim. ... 20 Figure 1- 5 Backscattered electron images and chemical X-ray maps of zoned electrum from the Ming and Boliden deposits. Electrum grains from the Ming deposit are characterized by Au-poor core, Au-rich transition, and Ag-rich rim chemical zoning textures which correspond to the BSE images. There are no significant Cu variations in electrum from (d) and (h). Electrum in (i) is characterized by a Au-rich core and Au-depleted rim. There are no significant Fe variations in electrum from (l) and (p). (m) The latter Ag-rich
xi
veins are filling in the tiny fractures in electrum and fine-grained native gold grains occur along the boundary of electrum. ... 21 Figure 1- 6 The chemical variation profiles showing compositional measurement by EPMA on zoned electrum from the Ming deposit. (a) shows the arranged profiles across the zoned electrum. (b) and (c) show the Au and Ag area intensity of X-ray by EPMA (counted by cps) along the measured line 1 and line 3 across the dark grey core, light grey transition and dark grey rim. (d-f) show Au, Ag, Cu, S, and Hg contents by EPMA point analyses across the zoned electrum. ... 24 Figure 1- 7 The chemical variation profiles showing the major element (Au and Ag) and minor element (Cu, S, Hg) contents measured by EPMA on a zoned electrum from the Boliden deposit. (e-f) show Au, Ag, Cu, S, and Hg contents determined by EPMA point analyses along measured lines across the light grey core and dark grey rim. ... 25 Figure 1- 8 Multielement box and whisker plots for LA-ICP-MS trace element data showing the compositional differences between the light grey and dark grey zones in electrum. (a) The arranged analysis line transects the dark grey core to the light grey zone on the zoned electrum in Figure 1-6a. The laser ablation spot size for electrum is 24 µm. (c) The arranged analysis line transects the light grey core to the dark grey rim on the zoned electrum in Figure 1-7a. The laser ablation spot size for electrum is 10 µm. (b) and (d) Box and whisker plots showing the chemical compositions of LA-ICP-MS data of electrum. Boxes outline the 25th to
75th percentiles, and whiskers extend to the 5% to 95% values. Short lines within the box represent the
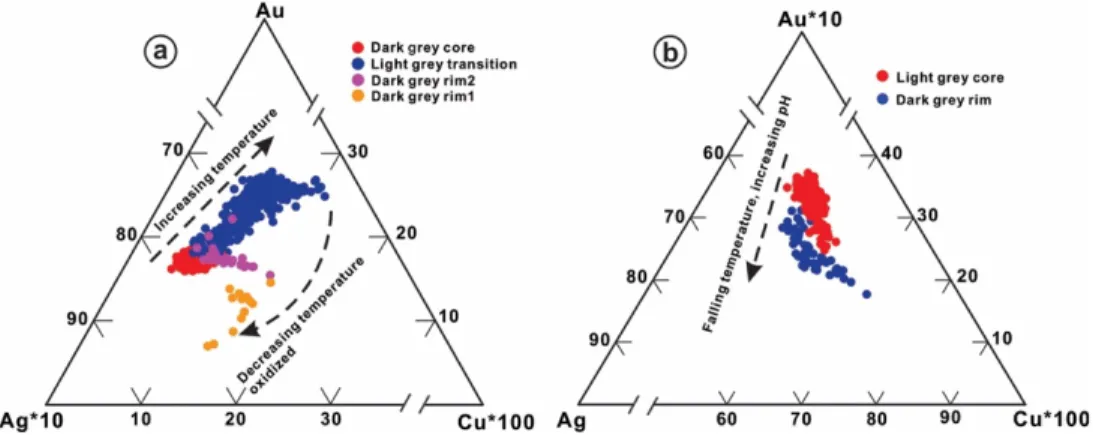
median value, whereas circles filled by white represent the average value. Red spots outside the whiskers indicate the outliers beyond 5% to 95% of the dataset. ... 26 Figure 1- 9 Ternary plot showing Au-Ag-Cu compositional variations between the dark grey and the light grey zones in compositionally zoned electrum. The compositional data of electrum come from area intensity of X-ray by EPMA (counted by cps). (a) Plot of Au-Ag-Cu variations in zoned electrum from the Ming deposit. The defined dark, light, and rim zones correspond to the same area in Figure 1-6a. (b) Plot of Au-Ag-Cu variations in the zoned electrum from the Boliden deposit. The defined dark and light zones correspond to the same area in Figure 1-7a. ... 27 Figure 1- 10 Schematic diagram of fluid facilitated solid-state diffusion (SSD) and coupled
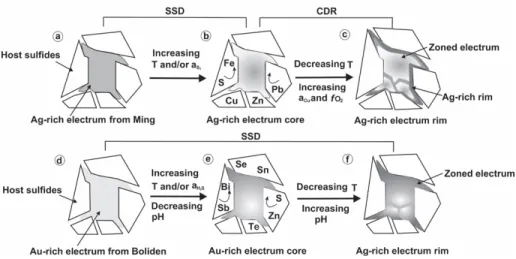
dissolution-reprecipitation (CDR) reactions resulting in compositional zoning in electrum from the Ming and Boliden deposits. (a-c) illustrate the zoned electrum formation from the Ming deposit. (a) The parent Ag-rich electrum precipitated with homogeneous compositional textures from reduced fluids. (b) With increasing temperature and/or !"#, the Ag-rich electrum core was dissolved to form a diffusive contact through a Au-rich fluid that likely leached S-Fe-Cu-Zn-Pb during prograde metamorphism. (c) The Ag-Au-rich electrum rim was reprecipitated on the exterior of electrum from an Ag-Cu-rich fluid with increasing !$%and fO2 during
xii
towards the margin of electrum. (d-f) illustrate the zoned electrum formation from the Boliden deposit. (d) The parent Au-rich electrum precipitated with homogeneous compositional textures from reduced fluids. (e) With increasing !&#'and/or temperature, and decreasing pH, the Au-rich electrum core was dissolved to
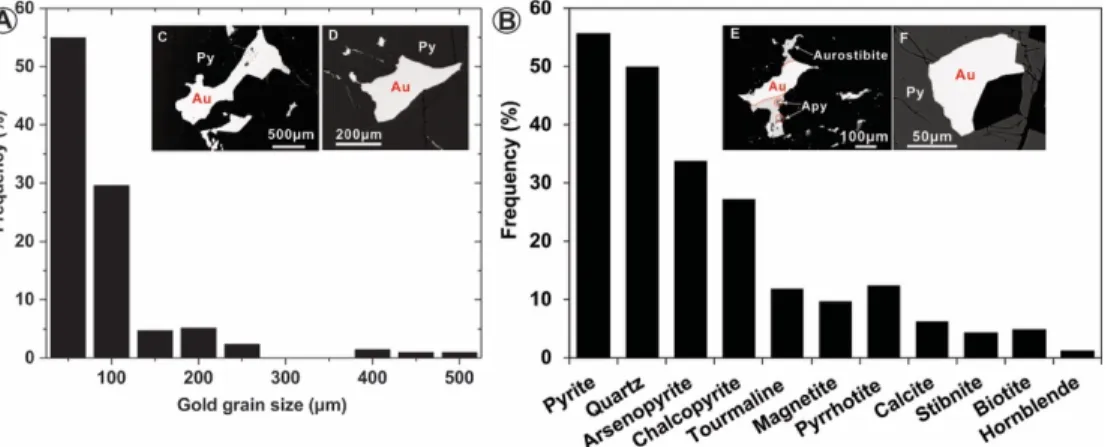
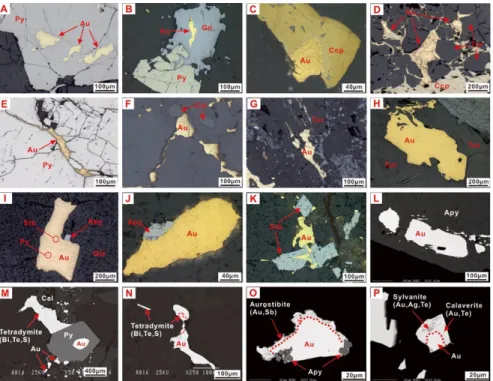
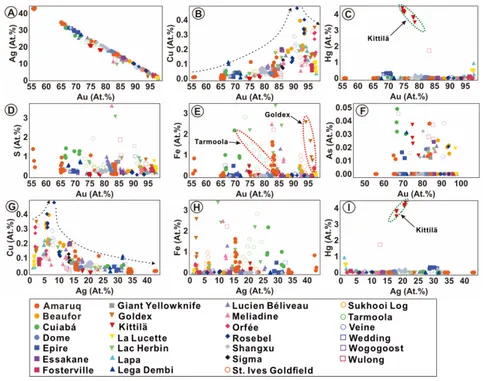
form a gradual contact through fluids which likely leached Se-Bi-Sb-Te-Sn-S-Zn during the prograde metamorphism. (f) The SSD of Ag results in coarsening of electrum and forms a Ag-rich rim with decreasing temperature and increasing pH during the retrograde metamorphism. ... 29 Figure 1- 11 Binary plot showing compositional variations between the core and rim in zoned electrum from two VMS deposits. The compositional data of electrum come from the LA-ICP-MS analysis. (a) Plot of Au versus S + Fe + Cu + Zn + Pb, showing the increasing contents of S-Fe-Cu-Zn-Pb during the dissolution of Ag resulting in a Au-rich transition zone, in electrum from the Ming deposit. (b) Plot of Au versus Se + Bi + Sb + Te + Sn + S + Zn, showing the increased contents of Se-Bi-Sb-Te-Sn-S-Zn during the diffusion of Ag from Au-rich core. ... 31 Figure 2- 1 Distribution of the selected twenty-seven orogenic gold deposits in this study. ... 47 Figure 2- 2 Histograms of gold grain sizes and mineral associations. (A) Histogram of grain sizes of 287 gold samples. (B) Histogram of mineral association of 287 gold samples. ... 55 Figure 2- 3 Selected native gold grains with typical textures from various orogenic gold deposits. (A) Anhedral gold inclusions in pyrite from Lucien Béliveau. (B) Gold elongated inclusions in galena intergrown with euhedral pyrite from Empire. Minor gold is found in fractures in pyrite. (C) Rounded gold inclusion in chalcopyrite from Lega Dembi deposit. (D) Coarse gold in fractures in tourmaline and along the boundary of chalcopyrite from Beaufor deposit. (E) Elongated gold veinlets in fractures in pyrite from Goldex. (F) Anhedral gold veins in association with calcite from Giant. (G) Anhedral gold grains in tourmaline from Sigma. (H) Coarse anhedral gold grain is hosed in tourmaline from Essakane. (I) Coarse gold in contact with arsenopyrite in a quartz vein. Small stibnite and pyrite inclusions in gold from Fosterville. (J) Isolated gold is contact with arsenopyrite from Lapa. (K) Anhedral gold intergrown with euhedral stibnite in quartz veins from La Lucette. (L) Back-scattered electron image of subrounded gold inclusions in arsenopyrite from Kittilä. (M) Rounded gold inclusion in euhedral pyrite in contact with telluride in a calcite vein from Beaufor. (N) Elongated gold in a vein in association with tellurides from Beaufor. (O) Back-scattered electron image of gold with a rim of aurostibite in association with arsenopyrite from Lapa. (P) Anhedral gold coated by Ag-rich telluride film from Lucien Béliveau. Abbreviations: Au-gold; Py-pyrite; Apy-arsenopyrite; Ccp-chalcopyrite; Cal-calcite; Stb-stibnite; Qtz-quartz; Tur-tourmaline; Gn-galena. ... 56 Figure 2- 4 Bivariate EPMA plots showing major and minor element atomic percentages (at.%) and trends in native gold. (A) Au versus Ag, (B) Au versus Cu, (C) Au versus Hg, (D) Au versus S, (E) Au versus Fe, (F) Au versus As, (G) Ag versus Cu, (H) Ag versus Fe, (I) Ag versus Hg. The red dashed circles indicate negative correlations between Au and Fe from Tarmoola and Goldex deposits. The green dashed circles
xiii
indicate correlations between Au and Hg, Ag and Hg, from Kittilä deposit. ... 57 Figure 2- 5 Multi-element box (25th - 75th percentile) and whisker (5th - 95th percentile) plots for LA-ICP-MS trace
element concentration of 190 native gold analyses from twenty-seven orogenic gold deposits. The red circles indicate the outlier valued beyond the range of 5th - 95th percentile. Short line within the box
represents the median value, whereas the white circle on the whisker indicates the mean value. All the trace element concentrations determined by LA-ICP-MS are filtered by the limit of detection (LOD) for each analysis. ... 58 Figure 2- 6 Comparison of the element concentration in gold grains determined by EPMA and LA-ICP-MS. The whisker plots indicate the range between minimum and maximum values. Short line within the box represents the median value, whereas the white circle on the whisker indicates the mean value. ... 59 Figure 2- 7 The PLS-DA plots of LA-ICP-MS compositional data for native gold from different mineral associations in studied orogenic gold deposits. (A) The first and second loading plot (qw*1-qw*2) indicate correlations among elemental variables and mineral association. (B) The first and second score plot (t1-t2) shows the distribution of gold analyses classified by mineral associations from various orogenic gold deposits in the latent variable space defined by loadings (qw*1-qw*2). (C) Score contributions of Apy-Py-Mag-Stib assemblages. (D) Score contributions of Py-Apy-Po-Gn-Ccp assemblage. (E) Score contributions of Tur-Qtz-Cal assemblage. (F) The variable importance on the projection (VIP) values reflect the significance of compositional variables for classification of samples in the score plot (t1-t2). Py-pyrite; Apy-arsenopyrite; Mag-magnetite; Ccp-chalcopyrite; Stib-stibnite; Gn-galena; Po-pyrrhotite; Tur-tourmaline; Qtz-quartz; Cal-calcite. ... 60 Figure 2- 8 PLS-DA plot of LA-ICP-MS compositional data for native gold from different textures of native gold from studied orogenic gold deposits. (A) The first and third loading plot (qw*1-qw*3) indicate correlations among elemental variables and gold textures. (B) The first and third score plot (t1-t3) shows the distribution of gold analyses classified by textures from various orogenic gold deposits in the latent variable space defined by loadings (qw*1-qw*3). (C) The score contribution plots of gold veinlets in fractures. (D) The score contribution plots of gold inclusions. ... 61 Figure 2- 9 PLS-DA plot of LA-ICP-MS compositional data for native gold classified by dominant host rocks of studied orogenic gold deposits. (A) The first and second loading plot (qw*1-qw*2) indicate correlations among elemental variables and dominant host rocks. (B) The first and second score plot (t1-t2) shows the distribution of gold analyses classified by dominant host rocks from various orogenic gold deposits in the latent variable space defined by loadings (qw*1-qw*2). (C) Score contribution plot of gold hosted in ultramafic-mafic rocks. (D) Score contribution plot of gold hosted in sedimentary rocks. (E) Score contribution plot of gold hosted in intermediate igneous rocks. (F) Score contribution of gold hosted in felsic igneous rocks. (C) The VIP values reflect the significance of compositional variables corresponding to the
xiv
classifications of samples in score plot (t1-t2). ... 63 Figure 2- 10 Representative time-resolved depth profiles for gold grains (samples from Rosebel, Suriname) analyzed in this study indicating the occurrences of inclusions. The spiky Ag indicates the heterogeneous concentration of Ag in the gold. The elevated Fe, Cu, Bi, and Te contents suggest the presence of Fe-Cu-Bi-Te phase micro inclusions under the surface of gold grain, whereas elevated As and Fe indicate that arsenopyrite is likely present in the structure of native gold. ... 65 Figure 2- 11 Bivariate plots showing the correlations between Au and trace elements in native gold. The data comes from Appendix- XIII and the classifications correspond to PLS-DA in relation to mineral associations. (A) Au versus Sb, (B) Au versus Pd, (C) Au versus Hg, (D) Au versus Pb. ... 66 Figure 2- 12 Schematic summary diagram of native gold in different textures with various trace element compositions. Zoned composition of sulfide minerals refers to Cook et al. (2013), Gao et al. (2015), Large et al. (2009), Large et al. (2007), and Thomas et al. (2011). ... 69 Figure 2- 13 Application of gold compositions as indicators to fingerprint the host rock types. (A) The first and second score plot (t1-t2) shows the distribution of gold analyses classified by dominant host rocks from studied orogenic gold deposits in the latent variable space defined by loadings (qw*1-qw*2). (B) Projection of the compositional data of gold grains from Hollinger, Mclntyre, and Aunor orogenic gold deposits (Canada, Velasquez, 2014). ... 70 Figure 3- 1 World map showing the distribution of Au-bearing deposits collected in this study. Numbers in the figure are as follows: orogenic deposits, 1 = Orfée, 2 = Wedding, 3 = Veine, 4 = Wogogoosh, 5 = Cuiabá, 6 = Lucien Béliveau, 7 = Sigma, 8 = Beaufor, 9 = Lapa, 10 = Lac Herbin, 11 = Goldex, 12 = Dome, 13 = Tarmoola, 14 = Éléonore, 15 = St. Ives Goldfield, 16 = Giant Yellowknife, 17 = Amaruq, 18 = Rosebel, 19 = Essakane, 20 = Kittilä, 21 = Meliadine, 22 = Lega Dembi, 23 = Fosterville, 24 = Sukhoi Log, 25 = La Lucette, 26 = Jinchangyu, 27 = Empire, 28 = Linglong, 29 = Shangxu, 30 = Wulong; VMS deposits, 31 = Quemont, 32 = LaRonde, 33 = Boliden, 34 = Ming; epithermal deposits, 35 = Fruta Del Norte, 36 = Gaosongshan, 37 = La India, 38 = Cripple Creek, 39 = Golden Arrow, 40 = Little Florence, 41 = Rozália, 42 = Ken Snyder, 43 = Bell, 44 = Original Bullfrog, 45 = Palisades; porphyry deposits, 46 = Bilihe, 47 = Jinchang, 48 = Bor, 49 = Altar; RIRG deposits, 50 = Mokrsko, 51 = Dublin Gulch. ... 91 Figure 3- 2 Pie charts showing the numbers of deposits, gold grains, EPMA, and LA-ICP-MS analysis for each deposit type. ... 92 Figure 3- 3 Histograms of gold grain sizes from collected various Au-bearing deposit types. ... 102 Figure 3- 4 A selection of figures showing native gold grains from various gold deposit types. (A) Coarse anhedral gold inclusion in pyrite from the Goldex orogenic deposit. (B) Rounded gold is intergrown with pyrrhotite and arsenopyrite from the Cuiabá orogenic deposit. (C) Gold occurs as veinlets filling in the fractures between tourmaline and is in contact with chalcopyrite from the Beaufor orogenic deposit. (D) Elongated
xv
gold veinlets in fractures in pyrite from the Quemont VMS deposit. (E) Coarse gold inclusion is intergrown with chalcopyrite and arsenopyrite from the LaRonde VMS deposit. (F) Anhedral gold is intergrown with chalcopyrite, bornite, and is associated with cataclastic pyrite from the Ming VMS deposit. (G) Anhedral gold inclusions in galena with association of sphalerite and chalcopyrite from the Rozália epithermal deposit. (H) Anhedral gold is intergrown with sphalerite and chalcopyrite from the Palisades epithermal deposit. (I) Discrete gold contains bismuthinite inclusions from the Little Florence epithermal deposit. (J) Elongated gold veinlets are along the boundaries of chalcopyrite and in contact with pyrite from the Jinchang porphyry deposit. (K) Coarse gold inclusion in contact with chalcocite hosted by pyrite from the Bor porphyry deposit. (L) Anhedral gold in contact with chalcopyrite in quartz veins from the Bilihe porphyry deposit. (M) Discrete gold is intergrown with arsenopyrite and galena from the Dublin Gulch RIRG deposit. (N) Gold inclusion in arsenopyrite from Dublin Gulch. (O) Anhedral gold is in contact with molybdenite and association with pyrite from the Mokrsko RIRG deposit. Abbreviations: Au-gold; Apy-arsenopyrite; Bmt-bismuthinite; Bn-bornite; Cc-chalcocite; Ccp-chalcopyrite; Gn-galena; Mol-molybdenite; Po-pyrrhotite; Py-pyrite; Sph- sphalerite. ... 103 Figure 3- 5 Backscattered electron images and chemical X-ray maps of zoned electrums from epithermal deposits. Electrum grains in (A) and (D) come from Original Bullfrog and Golden Arrow, respectively. Both electrum grains are characterized by chemically zoning textures of an Au-poor core in sharp contact with an Au-rich rim or veinlet filling in the fissure. Electrum grain in (G) comes from Ken Snyder. The electrum, hosted by naumannite, is characterized by an Au-rich core and an Ag-rich rim, showing an oscillatory zoning texture (I). ... 105 Figure 3- 6 Element contents maps by LA-ICP-MS for electrum from the LaRonde VMS deposit showing heterogeneous trace element distribution in electrum. The element maps reveal concentric enrichment of Sb and Hg in the electrum, whereas Bi is relatively enriched in the core. Note that the relatively high content of Cu in the rim may be contaminated by the host chalcopyrite. ... 105 Figure 3- 7 Comparison of range and overall average of gold fineness from this study and literature data. The fineness data for Archean greenstone-hosted, porphyry, VMS, and epithermal Au-Ag deposits is from Morrison et al. (1991). ... 106 Figure 3- 8 The Au-Ag-Cu relationship of gold grains from different Au-bearing deposit types. Compositional field proposed by Townley et al. (2003) shown on the ternary diagram. The empty symbols are gold composition data from literatures for comparison, including epithermal (Bonev et al., 2002), porphyry (Rubin and Kyle, 1997; Palacios et al., 2001; Koděra et al., 2018), and VMS deposits (Yesares et al., 2015). ... 107 Figure 3- 9 Bivariate EPMA plots showing the correlation between major and minor element atomic percentages (at%) in native gold from different deposit types. (A) Au versus Ag, (B) Au versus Cu, (C) Au versus Hg, (D) Au versus S. ... 108
xvi
Figure 3- 10 Multi-element box (25th - 75th percentile) and whisker (5th - 95th percentile) plots for LA-ICP-MS trace
element concentration of 459 native gold analyses from 51 gold deposits. The red circles indicate outlier values beyond the range of 5th - 95th percentile. Short line within the box represents the median value,
whereas the white circle on the whisker indicates the mean value. All the trace element concentrations determined by LA-ICP-MS are above the LOD. ... 109 Figure 3- 11 Comparison of Cu, Fe, and S contents in gold grains determined by EPMA and LA-ICP-MS. The whisker plots indicate the range between 5th -95th percentile of the dataset, whereas the red circles indicate
the outliers beyond 5th -95th percentile. Short line within the box represents the median value, whereas the
white circle on the whisker indicates the mean value. ... 110 Figure 3- 12 The PLS-DA plots of EPMA compositional data for native gold from different Au-bearing deposit types. (A) The first and second loadings biplot (qw*1-qw*2) indicates correlations among elemental variables and deposit types. (B) The first and second scores biplot (t1-t2) shows the distribution of gold analyses classified by deposit types in the latent variable space defined by loadings (qw*1-qw*2). (C) Score contributions of gold from orogenic deposits. (D) Score contributions of gold from epithermal deposits. (E) Score contributions of gold from porphyry deposits. (F) Score contributions of gold from VMS deposits. (G) Score contributions of gold from VMS deposits. (H) The variable importance on the projection (VIP) values reflect the significance of compositional variables for classification of samples in the score plot (t1-t2). . 111 Figure 3- 13 The PLS-DA plots of LA-ICP-MS compositional data for native gold from different Au-bearing deposit types. (A) The first and second loadings biplot (qw*1-qw*2) indicates correlations among elemental variables and deposit types. (B) The first and second scores biplot (t1-t2) shows the distribution of gold analyses classified by deposit types in the latent variable space defined by loadings (qw*1-qw*2). (C) Score contributions of gold from orogenic deposits. (D) Score contributions of gold from low sulfidation (LS) epithermal deposits. (E) Score contributions of gold from high sulfidation (HS) epithermal deposits. (F) Score contributions of gold from VMS deposits. (G) Score contributions of gold from porphyry deposits. (H) The variable importance on the projection (VIP) values reflect the significance of compositional variables for classification of samples in the score plot (t1-t2). ... 113 Figure 3- 14 Results of the blind test gold data by Random Forests classifier. (A) Gini decrease for trace elements based on the 95% of 459 gold analyses from this study. (B) Prediction results using 64 gold analyses from orogenic deposits (Velasquez, 2014).. ... 118
xvii
List of tables
Table 1- 1 EPMA results of electrum grains from the Ming and Boliden deposits ... 22 Table 2- 1 Sample descriptions and geologic background of twenty-seven studied orogenic gold deposits from the Archean to the Cretaceous. ... 48 Table 3- 1 Sample descriptions and geologic background of selected fifty-one Au-bearing deposits in the world.
... 93 Table 3- 2 Confusion matrix showing for Random Forests classification of test data ... 119
xviii
List of appendices
Appendix- I Detection limits for trace element analyses in electrum from VMS deposits for EPMA and LA-ICP-MS. ... 139 Appendix- II Precision and accuracy for EPMA analysis (wt%). The precision value is given by relative standard deviation of the three analyses of gold standard (NA-Au-31) by EPMA. ... 142 Appendix- III Comparison of routine analyses (n=43) of trace elements in reference materials (NA-Au-31, NIST610 and MASS-1) by LA-ICP-MS and certificate values (ppm). The precision is given by relative standard deviation (%). ... 144 Appendix- IV Trace element contents of zoned electrum from the Ming deposit by EPMA. All the units are in wt.%
... 149 Appendix- V Trace element contents of zoned electrum from the Boliden deposit by EPMA. All the units are in wt.%. ... 157 Appendix- VI Trace element compositions along the arranged line in zoning electrum from the Ming deposit (Canada) determined by LA-ICP-MS. All the trace elements are measured by ppm. ... 169 Appendix- VII Trace element compositions along the arranged line in zoning electrum from the Boliden deposit (Sweden) determined by LA-ICP-MS. All the trace elements are measured by ppm. ... 174 Appendix- VIII Petrography characteristics of gold grains from various deposit types ... 183 Appendix- IX Detection limits for 190 trace element analyses in gold from 27 orogenic deposits for LA-ICP-MS.
... 270 Appendix- X Average detection limit for 673 element analyses in gold from 51 Au-bearing deposit types by EPMA. ... 272 Appendix- XI Major and trace element contents in gold from various deposit types determined by EPMA (wt%). All the values are filtered by each detection limit. ... 274 Appendix- XII Detection limits for 459 trace element analyses in gold from 51 Au-bearing deposits by
LA-ICP-MS. ... 326 Appendix- XIII Trace element concentrations in gold determined by LA-ICP-MS from GSC and UNB. All the data are filtered by limit of detection (LOD) for each analysis. The '0' value indicates the concentration is blow the LOD. The unit is ppm. ... 328
xix
List of abbreviations
BSE: Backscattered electron
CDR: Coupled dissolution and reprecipitation EDS: Energy disperse spectroscopy
EPMA: Electron probe microanalyzer
LA-ICP-MS: Laser ablation-inductively coupled plasma-mass spectrometry PCA: Principal component analysis
PLS-DA: Partial least squares discriminant analysis RIRG: Reduced intrusion-related gold
SEM: Scanning electron microprobe
SR-µ-XRF: Synchrotron radiation-induced micro X-ray fluorescence analysis SSD: Solid state diffusion
VMS: Volcanogenic massive sulfide
xx
…… dedicated to my loved ones who
supported me all the time: my wife,
my mother and my father
A gift for my little baby, Charles Liu
xxi
Acknowledgments
My sincere gratitude is expressed to my dear supervisor, Dr. Georges Beaudoin, for his professional guidance and continuous support throughout my doctorate study. His vast knowledge and incisive insight have been inspiring. His support, valuable comments, and patience on correction of my research articles have always lighted the way throughout my PhD research. I could not finish my PhD study without his financial support after my scholarship was ended. The life during the pandemic of COVID-19 was tough, however, his continuous encouragements helped me to pass through the difficulties.
I sincerely appreciate Sheida Makvandi (U. LAVAL), Simon E. Jackson (research scientist from the GSC, Ottawa), and Xiaowen Huang (U. LAVAL and CAS, China) for their contributions to this research, and also for their suggestions and scientific support.
I would like to acknowledge my committee members who graciously agreed to serve on my committee. Thank you all and the best of wishes in your future work and stay safe.
I wish to acknowledge the kind, cordial, and helpful staffs of Département de géologie et de génie géologique of Université Laval, especially Dr. Marc Choquette for his technical supports for SEM and EPMA, Edmond Rousseau for his technical support for sample polishing, and the secretarial staff for dealing with documents for me. I would also like to thank Dr. Zhaoping Yang (GSC) and Mr. Brandon Boucher (UNB) for their support with LA-ICP-MS.
I would sincerely thank my colleagues (Emilie Bédard and Victor De Bronac de Vazelhes, research professionals at NSERC-Agnico Eagle Industrial Research Chair in Mineral Exploration) for their technical support for coding in R and Matlab and sample preparation, and friends (Enzo Caraballo, Roman Hanes, François-Xavier Masson, Ana Miranda, Marjorie Sciuba, Antoine Godet, Xia Hu, Xiang Fang, Chao Yang, Jean-Philippe Fleury, Donald Grzela, Nelly Manéglia) for their moral support, and for creating such an excellent atmosphere in our office/research group.
Finally, but most importantly, I would like to extend my deepest gratitude to my wife, Meng Li, my parents (Zhihui Zhang and Shuangnian Liu) for allowing me to realize my academic potential in Canada. Endless support and love they have provided me over the past five years were the greatest gift anyone has never given to me. This dissertation would not have been accomplished without the accompany of my little loved baby, Charles Liu, who brings me happiness, imagination, and inspiration. Also, I need to thank my best friend, my neighbor, Dr. Guoqi Wen and his family for moral support to overcome the most difficult confinement periods during the pandemic of COVID-19. Thank you all.
xxiii
Foreword
Native gold is a very significant mineral in many Au-bearing deposit types. The widespread distribution as well as the potential of gold to fingerprint the source of placer gold deposits has caused an increasing interest in investigating trace element compositions of gold from different Au-bearing deposit types. Despite numerous studies demonstrating the application of detrital gold chemistry in provenance studies and mineral exploration, native gold composition from various deposit types is not well documented. In addition, in the majority of gold composition studies, the formation of internal heterogeneity of element distribution in gold from metamorphosed deposits has been neglected. Thus, my PhD thesis has the aim of (1) characterizing textural and chemical characteristics of chemical zoned electrum grains from metamorphosed VMS deposits, (2) characterizing the chemical compositions of native gold from orogenic deposits and investigating the controls of trace element distributions in native gold grains, and (3) establishing discriminant criteria to use chemical signatures of gold in exploration for tracing gold sources in overburden sediments for mineral exploration.
The doctoral thesis submitted to the Department of Geology and Geological engineering of Université Laval, has been carried out under supervision of Professor Georges Beaudoin. This research project was funded by a partnership between Natural Science and Engineering Research Council of Canada (NSERC), Agnico Eagle Mines Limited, Ministère de l’Énergie et des Ressources Naturelles du Québec and China Scholarship Council (CSC). The thesis includes three research articles in which I have been the principal researcher and the first author. Two articles have been submitted to academic journals and are under review, the third article is in preparation at the time of the thesis submission.
My contribution to this PhD project has been: (1) to prepare the research proposal, (2) to collect samples, prepare the thin sections or blocks, analyze gold grains by SEM, EPMA, LA-ICP-MS, and to analyze geochemical data, (3) to build discriminant models by multivariate statistical methods, (4) to write up research articles.
This research resulted in the following scientific publications and communications: Scientific publications
The first paper entitled “Dissolution-reprecipitation vs. solid-state diffusion in electrum: examples from metamorphosed Au-bearing, volcanogenic massive sulfide (VMS) deposits”, is co-authored by Georges Beaudoin (research supervisor from U. LAVAL). The article is in press on the journal American Mineralogist. https://doi.org/10.2138/am-2021-7674.
The second paper entitled “Trace element composition of native gold from orogenic gold deposits”, is co-authored by Georges Beaudoin (research supervisor from U. LAVAL), Sheida Makvandi (U. LAVAL), Simon E.
xxiv
Jackson (research scientist from the GSC, Ottawa), and Xiaowen Huang (U. LAVAL). The article is submitted to the journal Ore Geology Reviews.
The third manuscript entitled “Native gold chemical compositions as indicators to discriminate gold from different deposit types”, is co-authored by Georges Beaudoin (research supervisor from U. LAVAL). The article is submitted to the journal Ore Geology Reviews at the time of final submission of the thesis.
Scientific communications
Liu, H., Beaudoin, G., Makvandi, S. and Jackson, S., 2019. Geochemical signature of native gold from various Au-bearing deposits - implications for mineral exploration. Oral presentation at the 15th Biennial Meeting of the
Society for Geology Applied to Mineral Deposits (SGA), Glasgow, Scotland, UK, Aug. 27-30, 2019.
Liu, H., Beaudoin, G., Makvandi, S., Bédard, É., 2019. PLS-DA of chemical compositions of native gold from various Au-bearing deposits – implications for mineral exploration. Oral presentation at the GAC-MAC-IAH Conference, Québec City, Canada. May 12-15, 2019.
Liu, H., Beaudoin, G., Makvandi, S., Côté-Mantha, O., Bédard, É., 2018. PLS-DA of trace element compositions of native gold from various Au-bearing deposits – implications for mineral exploration. Oral and poster presentation at Québec Mine conference, Québec City, Canada. Nov. 19-22, 2018.
Liu, H., Beaudoin, G., Côté-Mantha, O., Jackson, S., 2018. Trace element compositions of native gold from orogenic gold deposits. Oral presentation at Resources for Future Generations (GAC-MAC), Vancouver, Canada. Jun. 16-21, 2018.
Liu, H., Beaudoin, G., Makvandi, S., Sciuba, M., Huang, X., Côté-Mantha, O., 2017. Trace element characterization of native gold from orogenic gold deposits. Poster presentation at Québec Mine conference, Québec City, Canada. Nov. 20-23, 2017.
Liu, H., Beaudoin, G., Grzela, D., Huot, F., 2017. Microchemical characterization of native gold from orogenic gold deposits. Poster presentation at Prospectors and Developers Association of Canada (PDAC), Toronto, Canada. Mar. 5-8, 2017.
1
Introduction
Research background
Gold occurs as a commodity in a wide variety of deposit types since the Archean. A significant portion of the world’s natural gold endowment comes from hydrothermal deposits (Frimmel, 2008). Significant progress has been made in the classification, definition, and understanding the characteristics of the main gold-bearing deposit types (Robert et al., 1997). Their secular distribution and relative economic significance in terms of gold endowment reflect, not only a wide range of transport media and trapping mechanisms, but also major changes in the principal gold precipitation processes and the re-working of crustal gold throughout Earth history (Frimmel, 2014; Garofalo and Ridley, 2014). However, the factors that control the distribution of gold at deposit scale to continental levels in the Earth’s crust as well as the ultimate source of the gold in various deposit types, remain topics of debate (Frimmel, 2008; Groves et al., 2016). This Ph.D. study will focus on the aspects of the compositional characteristics of gold from various gold-bearing deposit types, including orogenic, porphyry, epithermal, volcanogenic massive sulfide (VMS), and reduced intrusion-related gold (RIRG) deposits.
Gold as an Indicator mineral
Indicator mineral methods, powerful exploration tools for the discovery of new mineral resources, have been expanded, and are developed significantly over the past three decades. These methods have been used worldwide to explore a wide range of deposit types, such as diamond-bearing kimberlites, lode gold, magmatic Ni-Cu-PGE, VMS, porphyry Cu, rare earth, iron oxide-copper-gold (IOCG), and intrusion-hosted Sn and W (Mackay et al., 2016; Averill, 2017; McClenaghan and Layton-Matthews, 2017; Cooke et al., 2020). An ideal indicator mineral for exploration should meet following criteria: (1) widespread distribution in rocks related to or within a deposit; (2) resistance to physical and chemical surficial weathering; (3) chemical composition sensitive to the precipitation conditions; (4) visual distinctiveness to be recovered from host rocks (McClenaghan, 2005). Native gold occurs in a great variety of deposit types (e.g., orogenic, epithermal, porphyry, VMS) and its chemical composition is controlled by factors including transport media, fluid chemistry, and precipitation conditions (Chapman et al., 2009). Attributed to its malleable property and resistance of weathering and transport in surficial environments, native gold grains are the best indicator minerals for detecting the presence of gold mineralization in overburden sediments (Chapman et al., 2000; McClenaghan, 2005; McClenaghan and Cabri, 2011; Chapman et al., 2016; Moles and Chapman, 2019).
Previous studies have applied morphological and chemical characterization of gold grains as indicators to inform a potential source of detrital gold as a regional assessment (Chapman et al., 2016). The shape of placer gold grains has been investigated to characterize gold for at least a century (Boyle, 1979). The link between
2
morphological modifications of placer gold and transportation distance has been established in alluvial sediments based on a large population of gold grains (Grant et al., 1991; Knight et al., 1999; Youngson and Craw, 1999; Townley et al., 2003). Combining both morphological and chemical analysis of Fresnedoso placer gold grains was used to constrain the genetic and sedimentary evolution of gold grains to fingerprint the potential source at the Fresnedoso creek placer gold deposit (Western Central Iberia, Spain; Dos Santos Alves et al., 2020)
Combining morphology and alloy composition allowed the identification of various alloy types for placer gold derived from deposits that were precipitated by highly oxidized chloride hydrothermal systems based on the relative proportions of Au, Ag, Pd, and Hg (Chapman et al., 2009). Analyses of gold chemistry, combined with inclusion assemblages in gold grains, generates a microchemical signature that allows determining the detrital gold source. Gold from porphyry deposits, characterized by a Bi-Pb-Te-S inclusion suite mineralogy, typically exhibits a slightly higher Cu content compared to gold from epithermal deposits, which shows a wide range of Au/Ag ratios (Morrison et al., 1991; Chapman et al., 2017). Based on the contents of Au, Ag, and Cu, ternary diagrams were constructed to distinguish gold from porphyry Cu, porphyry Cu-Au, and epithermal deposits (Townley et al., 2003). However, due to the limited numbers of elements measured (Au, Ag, Cu, Hg, Fe), these diagrams are not able to differentiate gold from epithermal and orogenic gold deposits (Moles et al., 2013). Crystallogragphy of gold
As a metal, gold has a melting point of 1063.0℃, specific gravity of 19.32, highly malleable and ductile, and has a high electrical and thermal conductivity exceeded only among the elements by silver and copper (Boyle, 1979). Gold possesses the electronic structure [Xe] 5d106s1 and has a single s-electron outside a completed d-shell
(Pokrovski et al., 2014). As a mineral, gold is an isometric (face-centred cubic) phase with a close-packed atomic structure. Gold crystals are commonly octahedral, rarely showing the faces of the dodecahedron, cube, and trapezohedron {113}. Gold is often in arborescent crystal groups with crystals elongated in the direction of a 3-fold symmetry axis or flattened parallel to an octahedron face. Native gold crystals always formed irregularly, passing into filiform, reticulated, and dendritic shapes (Klein et al., 1993). Native gold is commonly found as small (micrometer- to millimeter-sized), finely disseminated, mostly polycrystalline particles and grains and more rarely as single crystals (Hough et al., 2008, 2009). Also, gold may occur as polycrystalline dendrites, wires, plates, sheets and nuggets. Most of these are exquisite forms and are a result of twinning controlled by the {111} 60° twin law. In addition, gold may occur as a component in sulphide minerals (e.g., pyrite, arsenian pyrite, marcasite, chalcopyrite, sphalerite or arsenopyrite), sulfosalts (e.g., tetrahedrite-group minerals), tellurides (calaverite, petzite) and selenides, and be associated with silicates (e.g., quartz, chalcedony, sericite),
3
carbonates (e.g., calcite, dolomite, ankerite), sulfates (e.g., barite, gypsum), and carbonaceous minerals (Spry et al., 2004).
Geochemistry of gold
Native gold is an alloy of Au and Ag, with minor Cu, S and Hg, in proportions that vary with the conditions of formation (Desborough, 1970; Boyle, 1979). Gold compositions have been measured by electron probe microanalyzer (EPMA) for Ag, Cu, and Hg in several deposit types (Chapman et al., 2010; Chapman et al., 2011; Omang et al., 2015; Chapman et al., 2017; Mehrabi et al., 2019). The Au-Ag system forms a totally miscible alloy, according to the Hume-Rothery rules, due to gold and silver similar atomic radius, crystal structure, and valence (Guisbiers et al., 2015). The term electrum is used to refer to Au-Ag alloys between 20 wt% and 80 wt% Au, whereas native gold is used for alloys with more than 80 wt% Au (Boyle, 1979). Previous studies have explained Au and Ag solubility during transport and precipitation from fluids based on experimental data (Huston et al., 1992; Gammons and Williams-Jones, 1995; Pal’yanova and Kolonin, 2007).
Detailed microchemical studies using EDS/EPMA were carried out on numerous gold grains recovered from both placer and lode deposits. Studies of gold grain compositions from different mineralization systems have been undertaken by several workers with the development of EPMA since the 1960s (Stumpfl and Clark, 1965; Boyle, 1979; Leake et al., 1998; Chapman et al., 2000; Augé T. et al., 2015; Melchiorre et al., 2018; Svetlitskaya et al., 2018). Antweiler and Campbell (1977) analyzed Ag, Bi, Pb, and Cu contents in gold from Colorado and demonstrated that the variation in gold composition was a consequence of the temperature of formation, for example, low Ag and high Cu contents with abundant Bi and Pb were associated with a high temperature of ore formation, whereas high Ag and low Cu were related to a low temperature. Morrison et al. (1991) provided comprehensive chemical data illustrating the differences in gold fineness ranges between major gold deposit subtypes (e.g., epithermal, porphyry, and volcanogenic deposits). Huston et al. (1992) investigated Au, Ag, Cu, and Hg in Au-Ag alloys (electrum) from VMS deposits in eastern Australia and concluded that variation in electrum fineness is associated with transport agents (chloride and/or sulfide complexes) and Au/Ag ratios in the hydrothermal fluids. Thermodynamic calculations from Au and Ag transport complex solubility further theoretically indicate that the chemical composition of Au-Ag alloys is a complex function of temperature, sulfur, and/or chloride complexes concentration, oxygen fugacity, pH, and total Au/Ag ratios in solutions (Gammons and Williams-Jones, 1995).
Laser ablation inductively coupled plasma mass spectroscopy (LA-ICP-MS) has allowed the rapid analysis of a large number of trace elements. With the spatially resolved sampling capabilities of LA-ICP-MS, small amounts of samples are used to examine the microscale variations in trace element concentration. There have been few previous studies using LA-ICP-MS to investigate trace element concentrations in native gold. Ehser et al. (2011)
4
suggested that the variations in Co, Ni, Cu, Pd, Ag, Sn, and Sb abundances reflect distinctive geochemical tracers to recognize the source of one fragment of gold artifact from 66 Cornish gold deposits. A comparison study of LA-ICP-MS, EPMA, and SR-µ-XRF performed on gold samples, suggested that Ag, Cu, Pb, Fe, As, Hg, Ni, Co, Pd, Pt, and Bi are effective discriminators to fingerprint the gold from various localities in South Africa (Gauert et al., 2015). Omang et al. (2015) used LA-ICP-MS to determine Pt, Pd, Se, and Cr contents in Au-Ag alloys, indicating an ultramafic primary source rock, whereas elevated Sb and Hg contents suggest a quartz vein sulfide system in Cameroon. However, However, previous studies mainly focused on chemical compositions of placer gold grains in regional localities, whereas there are not sufficient data to compare the geochemical signatures of native gold derived from various Au-bearing deposit types and to construct a discriminant model to fingerprint the source of the gold, because of the limited range of deposit types studied and heterogeneous list of trace element reported, which prevents comparison between studies.
Chemical zoning in electrum
Chemically zoned mineral grains record a time series of reaction conditions experienced by minerals (Spear and Selverstone, 1983). Coupled dissolution-reprecipitation (CDR) is the most common mineral reaction mechanism in nature (Putnis, 2009; Ruiz-Agudo et al., 2014; Spruzeniece et al., 2017; Konrad-Schmolke et al., 2018; Huang and Beaudoin, 2019; Li et al., 2019). CDR reactions result in the readjustment of pre-existing grain boundaries under hydrothermal conditions, which has been widely recognized in various geological settings (Tenailleau et al., 2006; Putnis, 2009; Zhao et al., 2009; Zhao et al., 2013; Liu et al., 2017). In hydrothermal systems, complex mineral chemical zoning can be interpreted to reflect chemical changes in fluid compositions or re-equilibrium related to a number of physicochemical conditions (Borg et al., 2014).
Pseudomorphic replacement reactions, characterized by the preservation of the shape and volume of the replaced minerals, are common in nature during hydrothermal alteration, metamorphism, diagenesis, and chemical weathering (Putnis, 2002). However, pseudomorphic replacement in zoned minerals is alternatively attributed to solid-state diffusion reactions (SSD) under hydrothermal conditions, which preserve external morphology and aspects of the crystal structure (Eda et al., 2005; Eda et al., 2006; Putnis, 2009; Xia et al., 2009). SSD reactions controlling the growth of precious metal alloys have been previously reported both in nature (e.g., Au-Ag alloy, Czamanske et al., 1973; Au-Ag-Sb alloy, Zachariáš et al., 2017) and synthetic material studies (e.g., Au-Ag alloy, Hodak et al., 2000; Au-Sn alloy, Baheti et al., 2018; Au-Cu alloy, Xiong et al., 2014). Zoned electrum has been reported in epithermal deposits in the United States, Spain, and Japan (Desborough et al., 1971; Rosúa et al., 2002; Yokoyama et al., 2011). Ag-zoned electrum grains have been investigated in volcanogenic massive sulfide (VMS) deposits in Eastern Australia (Huston et al., 1992) and the Baochun skarn gold deposit (China, Lu et al., 2000). Healy and Petruk (1990) reported zoning of Au-Ag-Hg alloys is a
5
consequence of crystallization of increasingly Ag-rich fluids during retrograde metamorphism at the Trout Lake VMS deposit, Flin Flon (Canada).
Au-bearing volcanogenic massive sulfide (VMS) deposits are key exploration targets because their gold contents contribute significantly to the ore value (Dubé et al., 2007; Mercier-Langevin et al., 2011). It has been shown that gold can be remobilized from the massive sulfide bodies into veins peripheral to, or within, the VMS deposits during deformation and metamorphism (Huston et al., 1992; Tourigny et al., 1993; Sinclair et al., 2000; Larocque et al., 1995). Deformation and metamorphism have been proposed to cause coarsening of gold and upgrading of some VMS deposits (Huston et al., 1992; Årebäck et al., 2005; Wagner et al., 2007; Vikentev, 2016; Mercier-Langevin et al., 2011). However, the effect of metamorphism on electrum compositional zoning in these metamorphosed VMS deposits still remains unclear.
Geochemical mobility of Au and Ag
The dissolution and precipitation reactions of Au and Ag are controlled by their geochemical mobilities in hydrothermal fluids with different conditions (Pal’yanova and Kolonin, 2007). The composition of electrum is a complex function of the temperature, a*#, a+#, Cl. concentration, pH, and Au/Ag ratio of the fluids (Gammons
and Williams-Jones, 1995). Among the range of ligands have been proposed to transport Au and Ag in hydrothermal fluids, the bisulfide and chloride complexes are the most important (Seward, 1973; Stefánsson and Seward, 2003; Stefánsson and Seward, 2004). At high temperature, acidic, and oxidizing hydrothermal systems, AuCl1. will predominate, whereas Au(HS)6 tends to dominate at acidic to intermediate pH, and
Au(HS)1. at higher pH (>4.5) and temperatures up to 350℃ (Morrison et al., 1991; Huston et al., 1992;
Williams-Jones et al., 2009). Under oxidizing and low pH conditions, AgCl1. is the dominant silver species at all
temperatures, whereas Ag(HS)1. predominates in alkali solutions up to 320℃ (Gammons and Barnes, 1989;
Healy and Petruk, 1990; Huston et al., 1992). Under metamorphic conditions, Ag(HS)1. would predominate
over AgCl1. in neutral solutions (Healy and Petruk, 1990). According to the simple equilibria in the
Au-Ag-S-Cl-H2O system up to 400℃ (Gammons and Williams-Jones, 1995), an increase in the Au content in electrum
indicates an increase in temperature and/or a*#.
Gold precipitation mechanism
Several factors, including temperature, pressure, salinity, acidity, ƒO2, ƒS2, pH, Eh, ƒCO2, role of arsenic and
other metalloids, control the ability of ore fluids to transport and deposit gold (Pokrovski et al., 2014). According to Garofalo and Ridley (2014), during the evolution of hydrothermal systems in the crust, magmatic, hydrothermal, or metamorphic Au-bearing fluids undergo several major processes causing gold and minor
6
metals redistribution and precipitation, such as cooling, decompression, phase separation (or boiling), interaction with rocks, and mixing with external waters.
There are three mechanisms characterizing the gold precipitation in different fluids environments: (1) the removal of H2S and consequent decomplexation of gold. This can occur by reaction with Fe-rich wall rocks to form pyrite
(a major mechanism in metamorphogenic gold-quartz veins (Goldfarb et al., 2001). The low-pressure boiling can cause H2S escape into the gas phase which can form epithermal gold deposits (Heinrich, 2007). (2) the reduction
of a mildly oxidized gold-rich (e.g., magmatic) fluid by reaction with organic carbon (or mixing with methane) can explain gold precipitation, commonly in association with other redox-sensitive elements such as Sb or As. This mechanism is typical for sediment-hosted gold deposits, from amphibolite-facies metasedimentary rocks in the thermal aureoles of granitoid intrusions to epithermal deposits of the Carlin deposits (Wall et al., 2004; Cline et al., 2005; Muntean et al., 2011). (3) the complete oxidation of a sulfide-rich black smoker fluid by mixing with oxygenated seawater can explain the deposition of gold in VMS deposits (Franklin et al., 2005)
Research objectives
This study was undertaken with the purpose of developing indicator mineral methodologies for gold-bearing deposits using gold chemical composition. The specific objectives are:
(1) To determine the major, minor, and trace elements contents in gold grains from various Au-bearing deposit types, and to investigate the siting of trace elements in gold crystal structure.
(2) To investigate the trace elements distribution in single electrum grain and to understand the mechanisms controlling compositional zoning in electrum grains from metamorphosed VMS deposits. (3) To examine the potential control of mineral association, texture, and dominant country rocks on the
variations of gold composition in orogenic gold deposits.
(4) To characterize gold in various Au-bearing deposit types in order to establish classification models that would discriminate between gold from different deposit types, and to evaluate the potential use of gold compositions as indicators to fingerprint auriferous systems.
Methodology
The optical and scanning electron microscope (SEM) were used to document gold texture, grain size, mineral association, inclusions, and internal heterogeneities. The composition of gold grains was determined by using accurate and sensitive analytical instruments such as the EPMA and LA-ICP-MS. Censored geochemical data
7
contain values below detection limit (BDL). Robust multiplicative lognormal replacement method, zCompositions, implemented in the R environment was used to impute censored data (Palarea-Albaladejo and Martín-Fernández, 2015). Censored geochemical data were imputed via Expectation Maximization (EM, Palarea-Albaladejo et al., 2007), which converts compositional data into the Aitchison space using the additive log-ratio (alr). Bivariate plots are used to investigate relationships between elements. Another important issue that must be taken into account is eliminating the effect of the closure of chemical compositions. Closed geochemical data can lead to a spurious correlation when studying the relationship within a dataset (Aitchison, 1986). The centered log-ratio (clr) transformation is used for multivariate statistical methods (Makvandi et al., 2016). Partial least squares discriminant analysis (PLS-DA), a supervised muti-statistical method was used to detect the discriminator elements and to make discriminant models to distinguish different sources of gold in different deposit types. Random Forests, a supervised classifier, is used to test gold chemical composition as discriminators for prediction of deposit types.
Thesis outline
The Ph.D. dissertation presents the research outcomes as a collection of three manuscripts, and includes a general introduction, three chapters, and a general discussion as followings:
The general introduction introduces the scientific problems, the objectives, analysis methods, and thesis outlines.
Chapter 1 presents in situ textural and chemical composition results of electrum from the Boliden and Ming VMS deposits, to investigate compositional zoning characteristics in electrum grains and to constrain the mechanisms responsible for chemical zoning in electrum. The textural observations, coupled with in-situ LA-ICP-MS data, provide new insights into how fluid facilitated solid-state diffusion (SSD) and coupled dissolution and reprecipitation (CDR) reactions can form compositional zoning in electrum, and to investigate trace element variations at a greenschist to amphibolite grade metamorphic condition.
Chapter 2 investigates gold grains from orogenic gold deposits, to characterize the chemical composition of native gold in orogenic systems and to discuss the controls of the trace element distributions in native gold grains. In situ analytical techniques was used to investigate the major and trace element composition of gold from representative orogenic gold deposits located in various geological settings, with ages ranging from the Archean to the Cretaceous. Statistical interrogation of the gold composition dataset is used to examine the potential control of mineral association, texture, and dominant country rocks on the variations of gold composition in orogenic gold deposits.
8
Chapter 3 investigates gold trace element compositions to establish which elements are present within gold, and to discriminate gold from the different types of mineral deposits based on chemical signatures. Chemical compositions of gold grains collected from orogenic Au veins, Au-bearing volcanogenic massive sulfide (VMS) deposits, porphyry Cu-Au deposits, epithermal Au-Ag deposits, and reduced intrusion-related gold (RIRG) deposits were analyzed. Major and trace composition of native gold were in-situ measured by EPMA and LA-ICP-MS. The geochemical data were investigated by partial least squares-discriminant analysis (PLS-DA) to identify geochemical signatures of gold to construct a discriminant model. Random Forests was used to accurately predict gold deposit types by comparing gold compositional data from this study and literature data. The general conclusion and recommendation for future work summarizes the major achievements of the research projects and propose the recommendations for future work.
Appendices I to XIII contain additional material that is not or only partially included in the manuscripts. Appendices I, II, III, IX, X, and XII present analytical conditions for gold analyses by EPMA and LA-ICP-MS. Appendix VIII presents petrography characteristics of gold grains from various deposit types. Appendices IV, V, VI, VII, XI, and XIII present major and trace element contents for gold grains by EPMA and LA-ICP-MS.
1
References
Aitchison, J. (1986) The statistical analysis ofcompositional data. Monographs on Statistics and Applied Probability. Chapman and Hall Ltd. (Reprinted 2003 with additional material by The Blackburn Press): London (UK) (416 pp.).
Antweiler, J., Campbell, W. (1977) Application of gold compositional analyses to mineral exploration in the United States, Developments in Economic Geology. Elsevier, pp. 17-29.
Årebäck, H., Barrett, T.J., Abrahamsson, S., Fagerström, P. (2005) The Palaeoproterozoic Kristineberg VMS deposit, Skellefte district, northern Sweden, part I: geology. Mineralium Deposita 40: 351-367.
Augé T., B.L., Bourbon P., Guerrot C., Viprey L. (2015) Faisabilité technique d’une traçabilité physico-chimique de l’or de Guyane. Rapport WWF-BRGM/RP-64880-FR: 145p, 102 fig., 148 tabl., 143 ann., 141 CD-ROM. Averill, S.A. (2017) The past is the key to the future: understanding and successfully applying the lessons learned from 40 years of indicator mineral exploration. Geological Survey of Canada, Open File 8345: 90.
Baheti, V.A., Kashyap, S., Kumar, P., Chattopadhyay, K., Paul, A. (2018) Solid–state diffusion–controlled growth of the phases in the Au–Sn system. Philosophical Magazine 98: 20-36.
Borg, S., Liu, W., Pearce, M., Cleverley, J., MacRae, C. (2014) Complex mineral zoning patterns caused by ultra-local equilibrium at reaction interfaces. Geology 42: 415-418.
Boyle, R.W. (1979) The geochmistry of gold and its deposits. Geol. Surv. Can. Bull. 280.
Chapman, R., Cook, M., Grimshaw, M., Myles, S. (2016) Placer-lode gold relationships in the Nansen placer district, Yukon. Yukon Exploration and Geology: 63-78.
Chapman, R., Leake, R., Bond, D., Stedra, V., Fairgrieve, B. (2009) Chemical and mineralogical signatures of gold formed in oxidizing chloride hydrothermal systems and their significance within populations of placer gold grains collected during reconnaissance. Economic Geology 104: 563-585.
Chapman, R., Leake, R., Moles, N., Earls, G., Cooper, C., Harrington, K., Berzins, R. (2000) The application of microchemical analysis of alluvial gold grains to the understanding of complex local and regional gold mineralization: A case study in the Irish and Scottish Caledonides. Economic Geology 95: 1753-1773.