HAL Id: hal-02383108
https://hal.archives-ouvertes.fr/hal-02383108
Submitted on 27 Nov 2019HAL is a multi-disciplinary open access
archive for the deposit and dissemination of sci-entific research documents, whether they are pub-lished or not. The documents may come from teaching and research institutions in France or abroad, or from public or private research centers.
L’archive ouverte pluridisciplinaire HAL, est destinée au dépôt et à la diffusion de documents scientifiques de niveau recherche, publiés ou non, émanant des établissements d’enseignement et de recherche français ou étrangers, des laboratoires publics ou privés.
Maximal isometric force exertion predicted by the force
feasible set formalism: application to handbraking
Nasser Rezzoug, Xuguang Wang, Vincent Hernandez, Philippe Gorce
To cite this version:
Nasser Rezzoug, Xuguang Wang, Vincent Hernandez, Philippe Gorce. Maximal isometric force exer-tion predicted by the force feasible set formalism: applicaexer-tion to handbraking. Ergonomics, Taylor & Francis, 2019, 62 (12), pp.1551-1562. �10.1080/00140139.2019.1660418�. �hal-02383108�
Maximal isometric force exertion predicted by the force feasible set
formalism: application to handbraking
Nasser Rezzoug
a*, Xuguang Wang
b, Vincent Hernandez
c, and Philippe
Gorce
aaAUCTUS team, INRIA Bordeaux,University of Toulon, Toulon, France; bUniv Lyon,
Université Claude Bernard Lyon, IFSTTAR, Lyon, France; cDepartment of Electrical &
Computer Engineering, University of Waterloo, Waterloo, Canada Nasser Rezzoug
University of Toulon, CS 60584 - 83041 Toulon Cedex 9, France +33494142845
Post-print : REZZOUG, Nasser, WANG, Xuguang, HERNANDEZ, Vincent, GORCE, Philippe, 2019, Maximal isometric force exertion predicted by the force feasible set formalism: application to handbraking, Ergonomics, 62, 12, Taylor & Francis Ltd, -1562, DOI: 10.1080/00140139.2019.1660418
Maximal isometric force exertion predicted by the force feasible set
formalism: application to handbraking
The aim of this study was to test the capacity of the force feasible set formalism to predict maximal force exertion during isometric handbraking. Maximal force exertion and upper-limb posture were measured with a force sensor embedded in a handbrake and an optoelectronic system, respectively. Eleven subjects participated in the experiment which consisted of exerting the maximal force in isometric conditions considering five hand brake positions relative to the seat H-point. Then, maximal force was predicted by the force feasible set obtained from an upper-limb musculoskeletal model. The root-mean-square (RMS) of the angle between measured and predicted forces was 8.4° while the RMS error (RMSE) for amplitude prediction was 95.4 N. However, predicted, and measured force amplitudes were highly correlated (r=0.88, p<0.05, slope=0.97, intercept=73.3N) attesting the capacity of the model to predict force exertion according to the subject’s posture. The implications in the framework of ergonomics are then discussed.
Keywords: upper-limb, force feasible set, musculoskeletal modelling
Practitioner summary: Maximal force exertion is of paramount importance in digital human modelling. We used the force feasible set formalism to predict maximal force exertion during handbraking from posture and anthropometric data. The predicted and measured force orientation showed a RMS of 8.4° while amplitude presented a RMSE of 95.4N with a strong correlation (r = 0.88, p < 0.05, slope 0.97, intercept 77.3 N).
Introduction
Force exertion capacity in relation to the required force level is an important factor to consider when evaluating a workplace using an ergonomics assessment method such as RULA (McAtamney and Corlett 1993) or OCRA (Colombini and Occhipinti 2006, Occhipinti 1998). For example, foot and hand maximum force is needed for evaluating a hand or foot control which requires high demand of force. Furthermore, even for the controls requiring low force demand, maximum static strength can be used as an objective indicator for defining criteria for discomfort evaluation. For instance, the relationship between force perception and the pedal force normalized by the maximum foot strength was used for specifying the force limits of automotive pedals (Wang and Bullock 2004).
Digital human models (DHMs) are increasingly used in the early phase of product design for ensuring a better consideration of human factors (Chaffin 2005). Most of existing DHMs are based on geometric and kinematic human models capable of properly representing body dimension and posture (see a review by Bubb and Fritzsche (2009)). However, predicting posture dependent whole-body strength is complex due to the involvement of multiple joints, two-joint musculature and high redundancy of the musculoskeletal system (Frey Law et al. 2009). Existing prediction tools are mainly based on experimental data. The results showed that the repartition of forces is anisotropic i.e. the maximum force exertion depends on the force direction. Also, these studies showed that the shape of the FFS depended on the posture. According to age, gender, and anthropometry, the maximal static strength was measured for various tasks such as manual handling (Chaffin 1987, Parida and Ray 2015, Park et al. 2005, Wagner et al. 2010), pulling and pushing (Castro et al. 2012, Daams 1994, 1993, Haslegrave et
al. 1997a, b, Lin et al. 2013, Yu et al. 2018), handbraking (Chateauroux and Wang 2012, Wang et al. 2010), gear lever or clutch pedal manipulation (Fraysse et al. 2007, Wang et al. 2000). An alternative to the whole-body strength investigation is to study joint strength. 3DSSPP (3D Static Strength Prediction Program), developed by the centre for ergonomics at University of Michigan, compares the joint load required for a task with its maximum strength obtained from experimental data (Chaffin et al. 1999).
Though data-based prediction methods provide practical solutions to some specific problems, such approaches require data collection which may be time consuming and difficult. Prediction is valid only with the range of experimental conditions (La Delfa and Potvin 2017). Musculoskeletal modelling through the force feasible set (FFS) formalism may be an interesting candidate to fill this gap. The FFS is a convex shape that allows the maximum force exerted in any direction to be visualized (Carmichael and Dikai 2013, Chander and Cavatorta 2018, Valero-Cuevas 2009). The FFS characteristics depend on maximum joint torques thanks to muscles moment-arm and maximal isometric forces (through the force/length relationship) and on body posture that sets the force transmission capabilities at the hand or the feet. The FFS captures the difference in maximal force exertion according to force direction shown in previous experimental studies (Chander and Cavatorta 2018, Fothergill et al. 1993, Hernandez et al. 2015, Jan Nijhof and Gabriel 2006, Oshima et al. 2000, Sasaki et al. 2011, Wilkinson et al. 1995). By resorting to a musculoskeletal model of the upper limb, a fast algorithm for constructing the FFS has been validated (Hernandez et al. 2018, Hernandez et al. 2015, Hernandez et al. 2017).
In this framework, the aim of this paper was to apply the FFS for predicting the amplitude and direction of maximal hand force exertion when pulling a handbrake. Though handbraking is becoming less important because more and more vehicles are
either equipped with an electric braking or assistant system, handbraking systems are still available for low cost vehicles. The data used in the present study were collected for three major car manufacturers in a European project DHErgo for specifying the design of the hand braking system (Chateauroux and Wang 2012, Wang et al. 2010). The design of a control such as a handbrake necessitates to take into account the functional capacities of the target population of users who should be able to operate, use or manipulate a control that is designed for them. The force exertion capacities vary widely among individuals. Therefore, this knowledge is needed such that users with less force capacity are able to use it safely and comfortably whereas the stronger users can interact with the product without damaging it. In order to propose a modelling tool able to predict the force capacities, the gathered database of handbraking forces is interesting for testing the FFS formalism, since forces were measured for both female and male subjects, for different handbrake positions and for different instructed subjective force levels (from low to maximum) (Chateauroux and Wang 2012). This allows us to confirm whether the model is able to predict force exertion for various postures and instructed force levels. Therefore, the objective of this study was to verify that the proposed model could be used to characterise strength capacity during different motor tasks in different domains, as the FFS has been already validated to study force application during wheelchair propulsion (Hernandez et al. 2018). We hypothesized that the FFS could predict the direction and amplitude of the maximal isometric force applied on the handbrake in the various tested configurations. The present study was also intended to demonstrate the capacity of the FFS to capture the differences in the maximal force exertion in various postures, which was not tested in previous work (Hernandez et al. 2015).
Materials and methods Data collection
This experimental study was a part of the European Project DHErgo (Digital humans for ergonomic design of products - FP7-TRANSPORT - 2008-2011).
Participants
Eleven volunteer subjects, divided into two groups according to gender (5 young females and 6 young males), took part in the experiment. Information on the participants is listed in Table 1. Only the 50th percentile of each gender group in terms
of stature was considered to keep a more homogeneous sample. All participants were regular drivers with 2-year minimum driving experience and were in good physical condition without joint trauma, orthopaedic or neurological diseases and not practicing sport competitions. The experimental protocol was approved by the ethical committee of the French Institute of Science and Technology for Transport, Development and Networks. Informed consent was given before participating in the experiment.
Please insert Table 1 here
Experimental set-up and test configurations
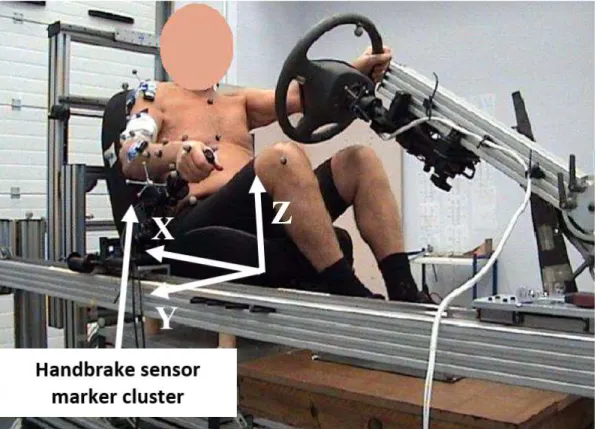
An adjustable car mock-up representing the driving environment was used (Figure 1). Seat height (H30 by SAE J826) was fixed at 0.3 m between the seat reference H-point and floor. The seat H-point was measured with the SAE H-point machine (SAE J826). The reference seat H-point was defined as for a seating position, at 60% of the seat horizontal and vertical adjustments, which matches the mean position of the 50th men percentile H-point overall end-users’ configurations based on the recommendations by the three car manufacturers involved in the DHErgo project. A real handbrake handle was used with a travel length of 0.157 m defined as the distance between the initial and
end positions of the handle extremity. A VICON optoelectronic system with 10 MX40 cameras (Vicon Motion Systems, Oxford, UK) was used to capture the motions with a sampling rate of 100 Hz. Six-axis force sensor (Denton Q3FN) with a capacity of Fx: 5000 N, Fy: 5000N, Fz: 6000 N, Mx: 150Nm, My: 150Nm, and Mz 80Nm was used to measure the force applied on the handbrake at 1 kHz. The force sensor was attached rigidly to the handbrake handle base with a custom-made apparatus. The force sensor reference frame was represented by a set of markers rigidly fixed to the handbrake handle (Figure 1). From these markers and those representing the global frame, a rotation matrix was constructed from the global frame to the frame of the sensor. From this rotation matrix, forces expressed in the sensor frame were projected in the global frame.
Please insert Figure 1 here
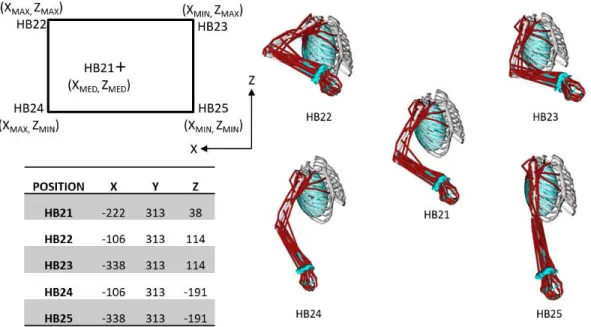
Five handbrake end positions in a same XY plane were defined in a vehicle coordinate system centred at the reference H-point (Figure 2). They were selected to cover a large range of possible handbrake positions at the end of travel, based on the data provided by the three car manufacturers participating in the DHErgo Project. Two seat positions were defined by gender. For the males, the seat was positioned at the reference H-point, while it was positioned 0.053 m more forward for the females. This value was fixed based on the regression equation provided by the car manufacturers involved in the project, considering the difference in stature between the male and female participants when adjusting the seat fore-aft position. The average difference in stature was 130 mm between two groups. If we referred to the regression equations of the fore-aft position of the hip centre (Reed et al. 2002), we had difference of about 60 mm, quite close to the value we fixed.
The steering wheel was adjustable so that participants could adopt their preferred driving position.
Please insert Figure 2 here
For each handbrake position, participants were instructed to adopt a standard driving posture with the hands on the steering wheel approximately in the 10 and 2 o’clock position and the foot on the floor, and then to pull the handbrake with the right hand to its end stop as they would do it in a car. The final position of the handbrake was considered as the initial condition for the maximal force exertion. The data acquisition started with the right hand on the handbrake while the left hand was placed on the steering wheel. Participants were asked to pull the handbrake as strongly as possible and maintain the effort for 5 seconds. A rest period of at least 40 seconds was allowed between trials. The rest time could be longer if requested by participants. No external stimulation in the form of verbal encouragement was provided. The maximal isometric force was defined as the average over an interval of 3 seconds starting after the first peak of force. The beginning of the interval was selected manually by visual inspection of the force time profiles. The trial was repeated two times for each handle position. The trial order of testing the five handle positions was randomized.
After the maximum force exertion session, the static hand forces corresponding to two other instructed subjective force levels (LOW and HIGH) were also recorded for the medium handle position (HB21). In this case, the handbrake was put at its end-stop by the experimenter. Next, the subjects were asked to perform two repetitions of each sub-maximal force exertions, in random order. No visual feedback was provided during the trial.
Motion capture data
Six markers clusters were attached on each arm, upper-arm, acromion, one on the trunk and the last on the back of the pelvis. They were placed to proceed to the palpation of 16 anatomic landmarks with a dedicated gauntlet equipped with four markers (Salvia et al. 2009). The fingertip position expressed in the gauntlet frame was calibrated with a dedicated plate on which specific locations had to be pointed. Knowing the fingertip position in the gauntlet frame, the position of anatomical landmarks could be assessed in the laboratory coordinate system. The anatomical points were: C7, T3 and T8 spinous processes, incisura jugularis, processus xiphoideus, acromioclavicular joint, sternoclavicular joint, scapula angulus inferior and acromialis, trigonum scapulae and the right upper-limb lateral and medial epicondyles, radial and ulnar styloids, and medial aspect of the 2nd and 5th metacarpal bones. These markers were used to perform
the geometric scaling of the generic musculoskeletal model and the inverse kinematics.
Maximum strength prediction
Musculoskeletal model
The right upper-limb model from Saul et al. (2015) (p=50 muscles, ndof=7 degrees of
freedom) was used. Musculoskeletal data were imported from OpenSim v3.1 (Delp et al. 2007) with the Matlab API (The MathWorks Inc., Natick, Massachusetts, USA). For more details please refer to Hernandez et al. (2015).
Musculoskeletal model geometric scaling and inverse kinematics
OpenSim v3.1 inverse kinematics tool was used to determine joint angles from the skin mounted markers. The geometry of the generic musculoskeletal model was scaled according to the markers location. The kinematics chain of the upper-limb consisted of
the arm, forearm and hand connected together by three joints (glenohumeral, elbow and wrist joints). Three degrees of freedom (dofs) were considered at the shoulder (plane of elevation, elevation angle, and internal-external rotation), 2 dofs at the elbow (flexion-extension and pronation-supination) and 2 dofs at the wrist (flexion-(flexion-extension and ulnar-radial deviation).
Muscle maximal isometric forces scaling
The scaling of the muscles maximal isometric force was done according to Correa and Pandy (2011): (1) scaled M , Mgeneric, lgeneric MTU , scaled
lMTU , and Fgeneric
max represent the mass of the reference model, the
subject mass, the reference model muscle-tendon length, the subject muscle-tendon length and the reference model force, respectively. Since the lengths of the bones used in the models were consistent with a 50th percentile male (Holzbaur et al. 2005), Mgeneric
was assumed to be equal to 78kg (Gordon et al. 1989). In order to take into account the gender difference, a coefficient of 0.50 was applied for the maximal isometric forces of female subjects corresponding to the ratio of maximal recorded forces between male and female subjects obtained in this study and according to Daams (1994).
FFS computation
The method proposed in (Hernandez et al. 2015) was used to define the right upper-limb FFS at the hand. A cocontraction factor of 0.95 and 0.1 was applied for maximally and minimally activated muscles, respectively (Hernandez et al. 2017). Given JT+, the
the muscles moment arm matrix N (Sherman et al. 2013), the active fa (depending on
muscle activation a) and passive fp forces generated by the muscles and the gravity
torque g, the produced end-effector force vector FSIM was obtained as follows:
T+ T( )
a p g
SIMF
J
N f a f
τ
(2)When the elbow flexion is low (e.g. for position HB25), JT approaches a singular
configuration. In this case, the FFS is very elongated and the maximal predicted force grows to infinity. To circumvent this difficulty, a damped least square version of the pseudo inverse of JT is used in such case. To choose when to apply the correction, the
following measure of JT conditioning is computed:
(3) When ω is below a predefined threshold ωT, the pseudoinverse of JT is corrected with a
damping factor λ as follows:
(4) I is the identity matrix. The value of λ is obtained as follows (Nakamura and Hanafusa 1986):
(5) The values of ωT = 0.01 and λ0 = 0.004 were set by computing the value of ω with the
FSIM was chosen as the maximal force given by the FFS for which the angle between
the predicted force direction and FEXP, the measured maximal isometric force, was less
or equal to 45°. Thus, the search region for FSIM was a 90° cone with FEXP as axis. The
obtained maximal angle between these two forces was always less than 45°.
Statistical analyses
The dependent variables were:
● FSIM: The amplitude of the maximal predicted isometric force by the FFS,
● FEXP: The amplitude of the measured force,
● Δ: the difference between FSIM and FEXP
● ANGLE1: The angle (in °) between the maximal predicted isometric force direction by the FFS and the measured force direction.
● ANGLE2: the angle (in °) between the measured force direction and the vector from the force point of application on the hand to the glenohumeral joint centre.
ANGLE2 was assessed because previous works have suggested that the maximal force exertion direction may be aligned with the axis from the hand to the glenohumeral joint center (Chander and Cavatorta 2018, Jan Nijhof and Gabriel 2006).
The independent variables were:
● The handbrake position (POSITION: HB21, HB22, HB23, HB24, and HB25), ● The instruction on force intensity (INTENSITY: MAX, HIGH, and LOW).
A one-way repeated measures analysis of variance (ANOVA) with Bonferonni post-hoc tests was conducted to assess the influence of the handbrake position on ANGLE1, ANGLE2, FEXP, FSIM, and Δ. To test the effect of INTENSITY on ANGLE1, a one-way
repeated measures ANOVA verified the effect of INTENSITY on FEXP. The partial η²
statistics provided the effect size. The sphericity was checked (Mauchly test) as well as data normality (Shapiro-Wilk test). In case of sphericity violation, the Greenhouse-Geisser or Huynh-Feldt correction was applied. In case of strong sphericity violation, a multivariate ANOVA for repeated measures was conducted (Wilks test). The Pearson correlation coefficient assessed the relationship between FEXP and FSIM in the maximum
conditions. The significance level was set at 0.05. All statistical analyses were conducted with Statistica (Statsoft, Tulsa, OK, USA).
Results
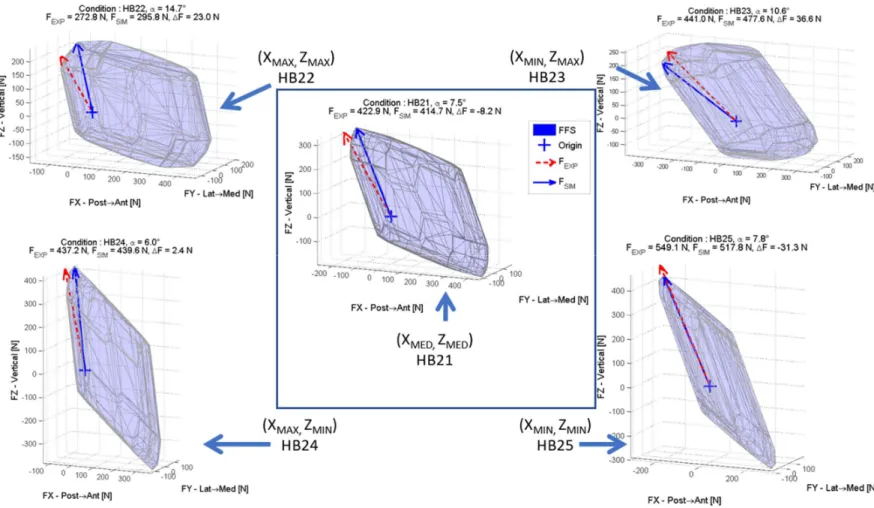
For one subject, Figure 3 displays an example of FFS for the different handbrake positions.
Please insert Figure 3 here
Maximal force direction (ANGLE1, ANGLE2)
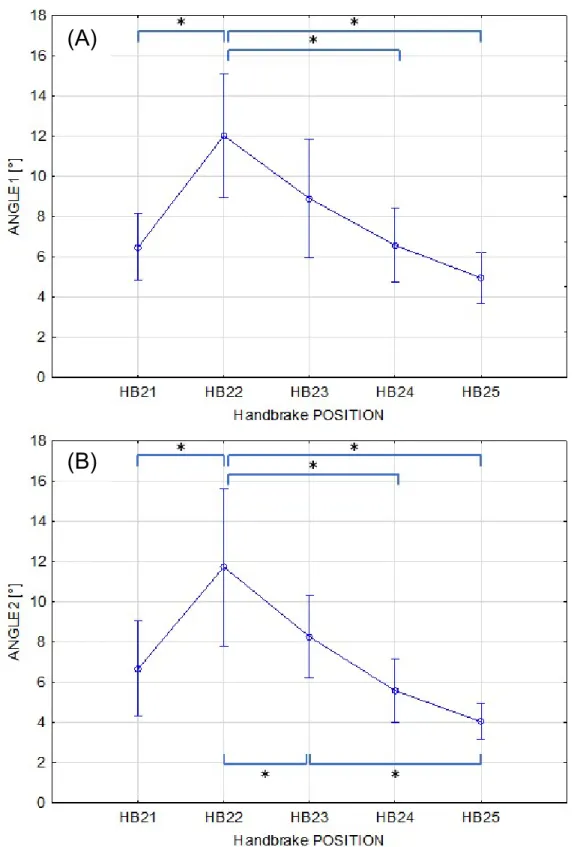
The predicted maximal force direction by handbrake position was compared with the measured one (ANGLE1) as well as the shoulder-hand direction (ANGLE2). Their differences are presented in Figures 3 and 4. On average, the differences were 7.8°(±3.2°) and 7.2°(±1.3°) for ANGLE1 and ANGLE2, respectively. A main effect of POSITION was found for both ANGLE1 (F(4,40)=7.765, p=0.001, η²=0.437) and ANGLE2 (Wilks=0.135, F(4,7)=11.186, p=0.0037). Post-hoc tests revealed that ANGLE1 for HB22 was greater than that for HB21, HB24 and HB25 (p<0.05) and ANGLE2 was greater for HB22 compared to all the other configurations (p<0.03). Also, ANGLE2 was greater for HB23 compared to HB25 (p<0.001). The root-mean-square (RMS) of the ANGLE1 was 8.4° (7.9° for female and 9.5° for male subjects).
Please insert Figure 4 here Please insert Figure 5 here
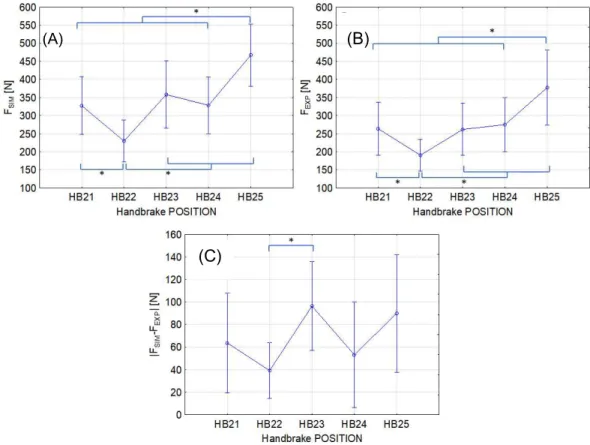
Maximal force amplitude (FEXP, FSIM and Δ)
The simulated (FSIM) and experimental (FEXP) maximal force amplitudes and their
difference (Δ) for 5 handbrake positions are presented in Figure 5. A significant effect of POSITION was found for FSIM (F(4,40)=61.591, p<0.001, η²=0.86) and FEXP
(Wilks=0.122, F(4,7)=12.57, p<0.003). For both FEXP and FSIM, the maximum force was
observed for HB25 and the lowest for HB22. On average, FSIM was greater than FEXP.
Their difference was also affected by POSITION (Wilks=0.097, F(4,7)=16.26, p<0.002). Δ at HB22 was lower than at HB23 (p<0.05). Δ ranged from -17 to 115 N with an average of 39 N (±37) for HB22. It varied from 17 to 206 N with an average of 96N (±59) for HB23. Overall, the RMS error (RMSE) of the predicted amplitude was 95.4 N (99.5 N for male and 89.5 N for female subjects).
Please insert Figure 6 here
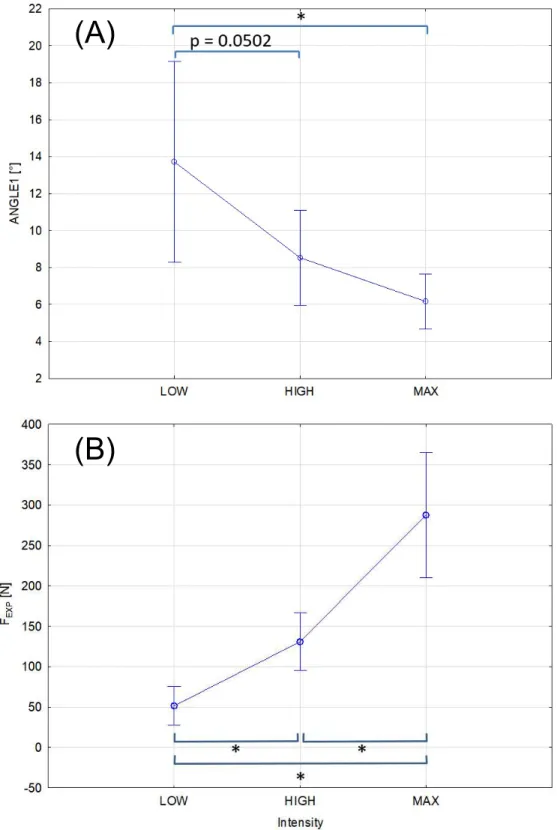
Predicted handbraking force direction according to force intensity
The repeated measures ANOVA showed a significant effect of INTENSITY on ANGLE1 (Wilks=0.38, F(2,9)=7.42, p<0.015). ANGLE1 increased when lowering force exertion intensity. Highest difference was observed for LOW (Figure 6-A). A second ANOVA revealed that the given instructions effectively conducted to distinct force levels (Wilks= 0.12, F(2,9)=33.22, p<0.001) (Figure 6-B).
Please insert Figure 7 here
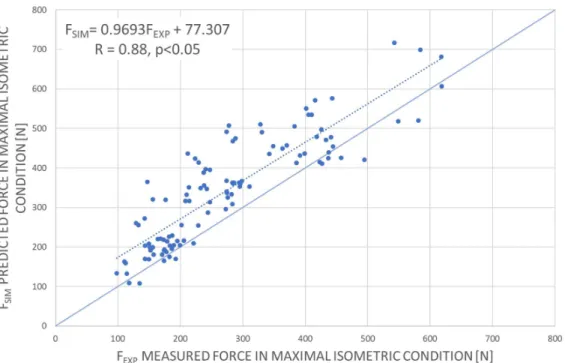
The Pearson correlation coefficient between FSIM and FEXP was 0.88 (p<0.05). Figure 5
clearly shows that FSIM and FEXP are well correlated. However, the linear regression
FSIM=0.9693FSIM+77.07 shows that the predicted forces overestimated the measured
ones (Figure 7).
Discussion
The aim of this study was to investigate the maximal force exertion during handbraking through the force feasible set formalism. We hypothesized that the FFS was able to predict both maximum force amplitude and direction. This goal is partly fulfilled since directions are predicted correctly but errors of amplitude are not negligible while showing a strong correlation (r = 0.88, p<0.05, slope = 0.97, intercept = 77.3 N). However, the model features represent several important characteristics of posture dependent force exertion during handbraking either in maximal or submaximal isometric conditions.
The first one is that the FFS predicts well the maximal force direction which is not necessarily perpendicular to the handbrake handle. For the different handle positions, the model was able to predict the maximum pulling force direction with a mean angle between simulated and measured force smaller than 12°. This direction seemed to be well aligned with the axis from the point of force application on the hand to the glenohumeral joint centre. This observation is in agreement with Jan Nijhof and Gabriel (2006) who measured the force distribution in the horizontal plane. The proposed results extend this observation to the 3D case in agreement with the recent observations from Chander and Cavatorta (2018). When the upper and forearms are almost aligned, a pulling force in the shoulder-hand direction minimizes the joint torques at shoulder and elbow. This should be true especially in case of maximum force exertion.
When considering different force intensities instructions (from low to maximal) the angle between predicted maximal force and measured force remained low. The ANGLE1 for the MAXIMAL and HIGH intensity conditions were significantly lower than that for the LOW intensity. Therefore, for the chosen settings, the force direction predicted by the FFS may remain valid when greater force amplitudes are required. For some subjects, the force direction slightly varied between the different intensities. Subjects may use the most efficient posture to produce the braking force in isometric condition and may still use this posture for lower intensities.
The second captured feature is that the force transmission capabilities vary with upper-limb posture. This is due to the modification of muscle lever-arms and the upper-upper-limb kinematic Jacobian matrix. Therefore, the shape of the FFS changes according to the posture. HB25 corresponding to the forward and low handle position leads to an upper-limb posture with a small elbow flexion. In this case the FFS is the most elongated due to the vicinity to a kinematic singularity for which a singular value of the Jacobian matrix tends toward zero. On the contrary, for the handle positions with greater elbow flexion (HB22 and HB23), the FFS becomes more isotropic or “rounder” with less predominant force direction. In this case the Jacobian matrix singular values are of the same order. As a consequence, the posture is conditioning the shape of the FFS to a great extent as already shown for measures conducted in the horizontal plane (Jan Nijhof and Gabriel 2006, Sasaki et al. 2011) or in 3D (Chander and Cavatorta 2018, Hernandez et al. 2015).
Also, the predictions of the FFS are consistent with previous studies which showed that the force-producing capabilities were found to be the highest for the low and forward handbrake position and the lowest for the high and backward configuration (Chateauroux and Wang 2012). Although the overestimation of FEXP was not negligible,
the significant correlation between the predicted and measured maximal force amplitudes suggests that the model is able to represent such differences in force exertion according to handbrake position. Overestimation is still a downside of force prediction with musculoskeletal models (Carmichael and Dikai 2013, Chander and Cavatorta 2018, Hernandez et al. 2015, Sasaki et al. 2011) and upgrades have to be proposed for an improved personalization and modulation of muscle activation according to the posture and the direction of the applied force.
Finally, the model prediction according to intensity condition gives interesting insight into force exertion patterns. In the LOW intensity condition, it is hypothesized that subjects may have a larger choice of forces direction since the intensity constraint is less stringent. It could also be hypothesized that subjects may have a larger choice of muscle activation patterns to provide the same force direction which may increase the error of prediction for such conditions. Also, the fact that ANGLE1 decreased with larger intensities favours the hypothesis that when the level of force increases the biomechanical constraints take the lead on the task related ones. In this case, the force tends to be aligned with the major axis of the FFS in the correct half space (pulling the handbrake) (Valero-Cuevas et al. 2003).
The fact that the maximal force direction predicted by the FFS is close to the line joining the point of force application and the glenohumeral joint center is interesting since this last parameter can be easily assessed. Combined with the force amplitude obtained by data driven methods such as that proposed in (Wang et al. 2010) both amplitude and direction can be assessed. However, the FFS allows to explain such direction, give more general information on the whole force capabilities and can be used for a wide range of applications including ergonomic indices for wheelchair propulsion (Hernandez et al. 2018), for modulating the assistance of rehabilitation robots
(Carmichael and Dikai 2013) or for improving the design of musculoskeletal models (Ingram et al. 2016) to name a few.
As pointed out in La Delfa and Potvin (2017), previous works on manual strength capacity considered joint moments capacities at the shoulder, elbow and wrist to compensate for segment weight and force exerted at the hand and then compared these joint capacities to existing database. The main drawback of such formalisms is that they do not consider the coupling between joints and the fact that the posture of one joint affects the strength capacity at another joint. Also, in order to avoid the accumulation of errors due to the several joint considered, some direct measures were done at the hand (La Delfa et al. 2014, La Delfa and Potvin 2017) which were used to construct regression equations or to train neural networks relying on experimental data.
We believe that the proposed model could be incorporated as an add-on to musculoskeletal modelling software such as Opensim to assess the strength maximal capacities for any posture of the upper-limb as proposed in this study and for the whole body in the future. For a given posture and a specified force direction the model is able to assess the maximal force in that direction therefore providing a guideline for force exertion. The main advantage of the formalism is that it provides information about all force directions through the graphical representation. Secondly, if different design solutions imply variations in posture, the model is able to inform which one will be more efficient in term of isometric force application. Indeed, a given level of required force in the direction of maximal force capacities can be generated with lower joint torques than less favourable directions. Also, as mentioned in the introduction, the maximum force level is necessary to propose discomfort criteria when applied force needs to be normalized by the maximal force (Wang and Bullock 2004). We also believe that the graphical representation is useful to visually identify the direction of
weak force capacity. Lowering the constraints to which the operators are subjected to, such ergonomic parameters could contribute to the optimisation of performance in term of quality and timing while reducing the injury risk and discomfort (Alabdulkarim et al. 2017).
Also, another interesting feature of the FFS is that it allows exploring the influence of a particular muscle weakness on the force exertion capacity which is not possible with a data-based model. Indeed, this can be done easily by lowering the maximal isometric force of muscles of interest in the model. The corresponding altered FFS will allow to explore the impact of such weakness on the maximal force exertion and the possible adaptations of the task or working environment.
The personalisation of the musculoskeletal models (geometry and neuromuscular parameters), on which the FFS is based upon, remains the major difficulty to their widespread dissemination in digital human modelling software (Dickerson et al. 2007, Paul and Lee 2011). Thus, the question arises whether models with simplified or “equivalent” muscles could be considered. Without considering the detailed musculature but rather the action of functional mono and biarticular muscles, they may constitute an interesting trade-off between model validity and complexity and the number of internal parameters to tune (Oshima et al. 2000).
The model of the FFS has identified limitations. Indeed, a stability constraint should be added to control the direction of joint force at the glenohumeral joint (Ingram et al. 2016). More muscles should be considered especially those of the thorax. The force scaling of the female subjects is difficult since the data of the reference model in OpenSim correspond to a male subject. Therefore, the development of musculoskeletal models dedicated specifically to female subjects is advocated. The sample size was
limited with only 11 participants in the experiment. This number should be increased especially by considering the variability in the ratio between upper limb length and stature. In the same line of view, the scaling method used is particularly simple and more sophisticated but sill usable methods including additional parameters may improve the predictions (Oomen et al. 2015).
The knowledge of the force capacities in different directions is important to design controls that need important level of forces. The proposed model allows us to define this capacity from a musculoskeletal model that can test a range of postures and a range of subjects. In this way, it is an interesting complement to data-based models that need a large amount of experimental data. Also, the results showed that the force exerted during submaximal levels still tended to be aligned with the major FFS axis in order to minimize joint torques.
Despite the identified limitations, the model can predict the direction and amplitude of applied forces based on posture data obtained from motion capture systems and general anthropomorphic data. Also, the predicted and measured maximum forces, are strongly correlated suggesting that the FFS model captures the fact that forces amplitude depend on the upper-limb posture. We believe that an improved model personalization especially for female subjects and more physiologic modulation of muscle activity may improve significantly the proposed results.
Acknowledgments
The research leading to these results has received funding from the European Community’s Seventh Framework Program (FP7/2007-2013) under grant agreement n°218525. This work was also financially supported by a grant (6533-2013) from the Ministry of National Education (France). The authors would like to thank François Guillon for the suggested corrections.
References
Alabdulkarim S., Nussbaum M.A., Rashedi E., Kim S., Agnew M., Gardner R., 2017. Impact of task design on task performance and injury risk: case study of a simulated drilling task. Ergonomics, 60 (6), 851-66.
Bubb H., Fritzsche F., 2009.A scientific perspective of digital human models: past, present and future. In: V.G. Duffy, eds. Handbook of Digital Human Modeling: research for applied ergonomics and human factors. Boca Raton, FL: CRC press Taylor and Francis Group, 3-30.
Carmichael M.G., Dikai L., 2013. Estimating Physical Assistance Need Using a
Musculoskeletal Model. IEEE Transactions on Biomedical Engineering, 60 (7), 1912-9.
Castro C., De la Vega E., Baez G., Carrasco F., 2012. Maximum force levels in different positions of shoulder and elbow. Work, 41 Suppl 1, 5488-90.
Chaffin D., Faraway J., Zhang X. (1999) Simulating Reach Motions. Paper presented at the SAE Human Modeling for Design and Engineering Conference, SAE Technical Paper 1999-01-1916 1999.
Chaffin D.B., 2005. Improving digital human modelling for proactive ergonomics in design. Ergonomics, 48 (5), 478-91.
Chaffin D.B., 1987. Manual materials handling and the biomechanical basis for prevention of low-back pain in industry--an overview. American Industrial Hygiene Association journal, 48 (12), 989-96.
Chander D.S., Cavatorta M.P., 2018. Multi-directional one-handed strength assessments using AnyBody Modeling Systems. Applied Ergonomics, 67 (Supplement C), 225-36.
Chateauroux E., Wang X., 2012. Comparison between static maximal force and handbrake pulling force. Work, 41 Suppl 1, 1305-10.
Colombini D., Occhipinti E., 2006. Preventing upper limb work-related musculoskeletal disorders (UL-WMSDS): new approaches in job (re)design and current trends in standardization. Applied ergonomics, 37 (4), 441-50.
Correa T.A., Pandy M.G., 2011. A mass–length scaling law for modeling muscle strength in the lower limb. Journal of Biomechanics, 44 (16), 2782-9.
Daams B.J. (1994) Human force exertion in user-product interaction: Backgrounds for design. In Industrial Design Engineering, pp. 343. TU Delft.
Daams B.J., 1993. Static force exertion in postures with different degrees of freedom. Ergonomics, 36 (4), 397-406.
Delp S.L., Anderson F.C., Arnold A.S., Loan P., Habib A., John C.T., Guendelman E., Thelen D.G., 2007. OpenSim: open-source software to create and analyze dynamic simulations of movement. IEEE Transactions on Biomedical Engineering, 54.
Dickerson C.R., Chaffin D.B., Hughes R.E., 2007. A mathematical musculoskeletal shoulder model for proactive ergonomic analysis. Computer Methods in Biomechanics and Biomedical Engineering, 10 (6), 389-400.
Fothergill D.M., Pinder A.D.J., Grieve D.W., 1993. Protocol for the omnidirectional assessment of manual strength. Clinical Biomechanics, 8 (3), 127-34.
Fraysse F., Wang X., Chèze L. (2007) Estimation of the Muscle Efforts of the Lower Limb during a Clutch Pedal Operation. SAE International.
Frey Law L., Xia T., Laake A., 2009.Modeling human physical capability: joint strength and range of motion. In: V.G. Duffy, eds. Handbook ofDigital Human Modeling. Boca Raton, FL: CRC Press, 1-12.
Gordon C.C., Churchill T., Clauser C.E., Bradtmiller B., McConville J.T. (1989) Anthropometric Survey of U.S. Army Personnel: Methods and Summary Statistics. D.a.E.C. United States Army Natick Research ed, Natick, MA. Haslegrave C.M., Tracy M.F., Corlett E.N., 1997a. Force exertion in awkward working
postures--strength capability while twisting or working overhead. Ergonomics, 40 (12), 1335-62.
Haslegrave C.M., Tracy M.F., Corlett E.N., 1997b. Strength capability while kneeling. Ergonomics, 40 (12), 1363-79.
Hernandez V., Gorce P., Rezzoug N., 2018. Evaluation and validation of
musculoskeletal force feasible set indices: Application to manual wheelchair propulsion. Journal of Biomechanics, 68, 70-7.
Hernandez V., Rezzoug N., Gorce P., 2015. Toward isometric force capabilities evaluation by using a musculoskeletal model: Comparison with direct force measurement. Journal of Biomechanics, 48 (12), 3178-84.
Hernandez V., Venture G., Rezzoug N., Gorce P., 2017. Improving the upper-limb force feasible set evaluation by muscles maximal isometric force identification and cocontraction factors. Journal of Biomechanics, 57, 131-5.
Holzbaur K.R.S., Murray W.M., Delp S.L., 2005. A model of the upper extremity for simulating musculoskeletal surgery and analyzing neuromuscular control. Annals of Biomedical Engineering, 33 (6), 829–40.
Ingram D., Engelhardt C., Farron A., Terrier A., Müllhaupt P., 2016. Improving anterior deltoid activity in a musculoskeletal shoulder model – an analysis of the torque-feasible space at the sternoclavicular joint. Computer Methods in Biomechanics and Biomedical Engineering, 19 (4), 450-63.
Jan Nijhof E., Gabriel D.A., 2006. Maximum isometric arm forces in the horizontal plane. Journal of Biomechanics, 39 (4), 708-16.
La Delfa N.J., Freeman C.C., Petruzzi C., Potvin J.R., 2014. Equations to predict female manual arm strength based on hand location relative to the shoulder.
Ergonomics, 57 (2), 254-61.
La Delfa N.J., Potvin J.R., 2017. The ‘Arm Force Field’ method to predict manual arm strength based on only hand location and force direction. Applied Ergonomics, 59, Part A, 410-21.
Lin J.-H., McGorry R.W., Maynard W., 2013. One-handed standing pull strength in different postures: Normative data. Applied Ergonomics, 44 (4), 603-8. McAtamney L., Corlett E.N., 1993. RULA: a survey method for the investigation of
work-related upper limb disorders. Applied Ergonomics, 24 (2), 91-9. Nakamura Y., Hanafusa H., 1986. Inverse Kinematic Solutions With Singularity
Robustness for Robot Manipulator Control. Journal of Dynamic Systems, Measurement, and Control, 108 (3), 163-71.
Occhipinti E., 1998. OCRA: a concise index for the assessment of exposure to repetitive movements of the upper limbs Ergonomics, 41 (9), 1290-311.
Oomen P., Annegarn J., Rasmussen J., Rausch J., Siebertz K., Verdijk L., Drost M., Meijer K., 2015. Development and validation of a rule–based strength scaling method for musculoskeletal modelling. International Journal of Human Factors Modelling and Simulation, 5 (1), 19-32.
Oshima T., Fujikawa T., Kameyama O., Kumamoto M. (2000) Robotic analyses of output force distribution developed by human limbs. Paper presented at the Proceedings. 9th IEEE International Workshop on Robot and Human Interactive Communication, RO-MAN 2000.
Parida R., Ray P.K., 2015. Biomechanical Modelling of Manual Material Handling Tasks: A Comprehensive Review. Procedia Manufacturing, 3, 4598-605. Park W., Martin B.J., Choe S., Chaffin D.B., Reed M.P., 2005. Representing and
identifying alternative movement techniques for goal-directed manual tasks. Journal of Biomechanics, 38 (3), 519-27.
Paul G., Lee W.C. (2011) Interfacing Jack And Anybody: Towards Anthropometric Musculoskeletal Digital Human Modeling. Paper presented at the 1st International Symposium on Digital Human Modelling, Université Claude Bernard, Lyon., 2011.
Reed M.P., Manary M.A., Flannagan C.A.C., Schneider L.W., 2002. A Statistical Method for Predicting Automobile Driving Posture. Human Factors, 44 (4), 557-68.
Salvia P., Jan S.V.S., Crouan A., Vanderkerken L., Moiseev F., Sholukha V., Mahieu C., Snoeck O., Rooze M., 2009. Precision of shoulder anatomical landmark calibration by two approaches: A CAST-like protocol and a new anatomical palpator method. Gait & Posture, 29 (4), 587-91.
Sasaki M., Iwami T., Miyawaki K., Sato I., Obinata G., Dutta A., 2011.Higher
Dimensional Spatial Expression of Upper Limb Manipulation Ability Based on Human Joint Torque Characteristics. In: A. Lazinica and H. Kawai, eds. Manipulators New Achievements. INTECH Open Access Publisher.
Saul K.R., Hu X., Goehler C.M., Vidt M.E., Daly M., Velisar A., Murray W.M., 2015. Benchmarking of dynamic simulation predictions in two software platforms using an upper limb musculoskeletal model Computer Methods in Biomechanics and Biomedical Engineering, 18 (13), 1445-58.
Sherman M.A., Seth A., Delp S.L., 2013. What is a moment arm? calculating muscle effectiveness in biomechanical models using generalized coordinates.
Proceedings of the ... ASME Design Engineering Technical Conferences. ASME Design Engineering Technical Conferences, 2013, V07BT10A052.
Valero-Cuevas F.J., 2009.A Mathematical Approach to the Mechanical Capabilities of Limbs and Fingers. In: eds. Progress in Motor Control. 619-33.
Valero-Cuevas F.J., Johanson M.E., Towles J.D., 2003. Towards a realistic
biomechanical model of the thumb: the choice of kinematic description may be more critical than the solution method or the variability/uncertainty of
musculoskeletal parameters. Journal of Biomechanics, 36 (7), 1019-30. Wagner D.W., Reed M.P., Chaffin D.B., 2010. The development of a model to predict
the effects of worker and task factors on foot placements in manual material handling tasks. Ergonomics, 53 (11), 1368-84.
Wang X., Barelle C., Pannetier R., Numa J., Chapuis T. (2010) A data-based approach for predicting variation range of hand and foot maximum force on a control: Application to hand brake. Paper presented at the 3rd International Conference on Applied Human Factors and Ergonomics, Miami, USA, 2010.
Wang X., Bullock M., 2004.Pedal operation. In: N.J. Delleman, C. Haslegrave and D.B. Chaffin, eds. Working Postures & Movements - Tools for Evaluation and
Engineering. Boca Raton, Florida: CRC Press, 191-210.
Wang X., Verriest J.P., Lebreton-Gadegbeku B., Tessier Y., Trasbot J., 2000. Experimental investigation and biomechanical analysis of lower limb movements for clutch pedal operation. Ergonomics, 43 (9), 1405-29.
Wilkinson A.T., Pinder A.D.J., Grieve D.W., 1995. Relationships between one-handed force exertions in all directions and their associated postures. Clinical
Yu D., Xu X., Lin J.-H., 2018. Impact of posture choice on one-handed pull strength variations at low, waist, and overhead pulling heights. International Journal of Industrial Ergonomics, 64, 226-34.
Table 1. Main characteristics of the two participant groups (mean ± SD [range]). Young male (YM)
n = 6
Young female (YF) n = 5 Age (years) 24.3 ± 5.0 [21-34] 29.2 ± 5.5 [21-35] Mass (kg) 68.7 ± 10.5 [53-79] 54.7 ± 3.5 [50-59] Stature (cm) 177.0 ± 5 [170-181] 164.0 ± 5 [159.5-168] BMI (kg.m-²) 22.0 ± 2.5 [18-24] 20.4 ± 0.8 [19.5-21.5]
Figure 2. Different tested handbrake configurations, the values indicated in the table represent the position of the frame of the handbrake in mm relative to the seat reference frame which origin is located at the chosen H-point, the right panel shows examples of obtained postures according to handbrake configuration.
Figure 3. Examples of FFS according to the handbrake position for one subject. The red arrow (dotted line) corresponds to the maximum measured force (FEXP), the blue arrow (solid line) corresponds to the isometric maximum predicted force (FSIM).
Figure 4. (A) Mean and 95% confidence interval of the angle in degrees (ANGLE1) between the measured maximal isometric force FEXP and the maximal predicted force
by the FFS FSIM, (B) Angle in degrees (ANGLE2) between FEXP and the direction from
the point of force application on the hand to the glenohumeral joint centre position assessed from the musculoskeletal model. * Bonferroni adjusted pairwise differences with p<0.05.
(A)
Figure 5. Mean and 95% confidence interval (N) of the norm of (A) the predicted (FSIM)
and (B) the measured (FEXP) maximal isometric force during handbraking and (C) the
error of prediction (Δ) according to condition (HB21, HB22, HB23, HB24 and HB25). * Bonferroni adjusted pairwise differences with p<0.05.
(A) (B)
Figure 6. (A) Mean with 95% confidence interval of the angle in degrees (ANGLE1) between the measured maximal isometric force (FEXP) and the maximal predicted force
(FSIM) for the three different force intensity instructions (LOW, HIGH, and MAX). The
chosen configuration is HB21, (B) Mean with 95% confidence interval of the norm of the measured force (FEXP) for the three different force intensity instructions (LOW,
HIGH, and MAX). * Bonferroni adjusted pairwise differences with p<0.05.
(A)
Figure 7. Predicted force norm (FSIM) as a function of the measured maximal isometric
force (FEXP) in maximal isometric condition. The dashed line corresponds to the linear
regression between FEXP andFSIM. The equation is given in the frame together with the
correlation coefficient and its p value. The solid line has a slope of 1 and intercept of 0. The data points under the solid line correspond to underestimation and those above the line to over-estimation.
Figures and table captions
Figure 1. Adjustable car mock-up used for hand brake case study.
Figure 2. Different tested handbrake configurations. The values indicated in the table represent the position of the frame of the handbrake in mm relative to the seat reference frame which origin is located at the chosen H-point. The right panel shows examples of obtained postures according to handbrake configuration.
Figure 3. Examples of FFS according to the handbrake position for one subject. The red arrow (dotted line) corresponds to the maximum measured force (FEXP), the blue arrow
(solid line) corresponds to the isometric maximum predicted force (FSIM).
Figure 4. (A) Mean and 95% confidence interval of the angle in degrees (ANGLE1) between the measured maximal isometric force FEXP and the maximal predicted force
by the FFS FSIM, (B) Angle in degrees (ANGLE2) between FEXP and the direction from
the point of force application on the hand to the glenohumeral joint centre position assessed from the musculoskeletal model. * Bonferroni adjusted pairwise differences with p<0.05.
Figure 5. Mean and 95% confidence interval (N) of the norm of (A) the predicted (FSIM)
and (B) the measured (FEXP) maximal isometric force during handbraking and (C) the
error of prediction (Δ) according to condition (HB21, HB22, HB23, HB24 and HB25). * Bonferroni adjusted pairwise differences with p<0.05.
Figure 6. (A) Mean with 95% confidence interval of the angle in degrees (ANGLE1) between the measured maximal isometric force (FEXP) and the maximal predicted force
(FSIM) for the three different force intensity instructions (LOW, HIGH, and MAX). The
chosen configuration is HB21, (B) Mean with 95% confidence interval of the norm of the measured force (FEXP) for the three different force intensity instructions (LOW,
HIGH, and MAX). * Bonferroni adjusted pairwise differences with p<0.05.
Figure 7. Predicted force norm (FSIM) as a function of the measured maximal isometric
force (FEXP) in maximal isometric condition. The dashed line corresponds to the linear
regression between FEXP andFSIM. The equation is given in the frame together with the
correlation coefficient and its p value. The solid line has a slope of 1 and intercept of 0. The data points under the solid line correspond to underestimation and those above the line to over-estimation.
Supplementary data
The tables below provide the individual subjects data corresponding to Figures 4, 5, and 6.
Table S1. Angle in degrees (ANGLE1) between the measured maximal isometric force FEXP and the maximal predicted force by the FFS FSIM. Letters below the POSITION
conditions (a for HB21, b for HB22 and so on) are used to identify Bonferroni adjusted pairwise differences in the table e.g., ‘a’ in exponent means that the value of ANGLE1 for the considered condition is significantly different from that obtained for the HB21 POSITION condition with p<0.05, whereas ‘b’ in exponent means that the value is significantly different from that of the HB22 POSITION condition with p<0.05 and so on. Condition Subjects HB21 a HB22 b HB23 c HB24 d HB25 e Mean SD 1 9.9 21.0 11.4 3.7 4.9 10.2 6.8 2 7.2 10.5 2.0 4.9 5.0 5.9 3.1 3 6.3 15.1 6.4 6.4 4.8 7.8 4.2 4 10.1 11.9 7.5 11.5 4.0 9.0 3.3 5 6.3 7.5 14.3 4.8 1.9 6.9 4.6 6 4.7 8.9 8.5 4.7 4.3 6.2 2.3 7 8.1 12.6 10.6 9.5 6.4 9.4 2.4 8 1.7 4.7 14.6 2.5 5.8 5.8 5.1 9 3.9 9.2 1.4 8.1 7.0 6.0 3.2 10 6.4 14.8 8.8 9.3 2.3 8.3 4.6 11 6.7 16.1 12.1 6.7 8.1 10.0 4.1 Mean 6.5 b 12.0a,d,e 8.9 6.6 b 5.0 b 7.8 2.8 SD 2.5 4.6 4.4 2.8 1.9 3.2
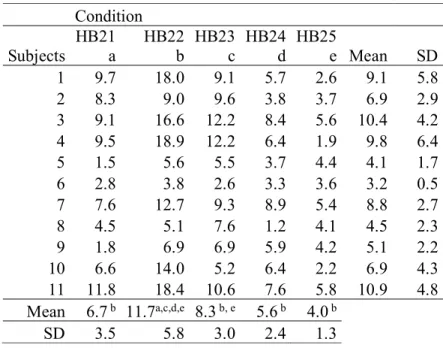
Table S2. Angle in degrees (ANGLE2) between the measured maximal isometric force and the direction from the point of force application on the hand to the glenohumeral joint centre position assessed from the musculoskeletal model. Letters below the POSITION conditions (a for HB21, b for HB22 and so on) are used to identify Bonferroni adjusted pairwise differences in the table e.g., ‘a’ in exponent means that the value of ANGLE2 for the considered condition is significantly different from that obtained for the HB21 POSITION condition with p<0.05, whereas ‘b’ in exponent means that the value is significantly different from that of the HB22 POSITION condition with p<0.05 and so on.
Condition Subjects HB21 a HB22 b HB23 c HB24 d HB25 e Mean SD 1 9.7 18.0 9.1 5.7 2.6 9.1 5.8 2 8.3 9.0 9.6 3.8 3.7 6.9 2.9 3 9.1 16.6 12.2 8.4 5.6 10.4 4.2 4 9.5 18.9 12.2 6.4 1.9 9.8 6.4 5 1.5 5.6 5.5 3.7 4.4 4.1 1.7 6 2.8 3.8 2.6 3.3 3.6 3.2 0.5 7 7.6 12.7 9.3 8.9 5.4 8.8 2.7 8 4.5 5.1 7.6 1.2 4.1 4.5 2.3 9 1.8 6.9 6.9 5.9 4.2 5.1 2.2 10 6.6 14.0 5.2 6.4 2.2 6.9 4.3 11 11.8 18.4 10.6 7.6 5.8 10.9 4.8 Mean 6.7 b 11.7a,c,d,e 8.3 b, e 5.6 b 4.0 b SD 3.5 5.8 3.0 2.4 1.3
Table S3. Mean and SD (N) of the norm of the measured (FEXP) and predicted (FSIM) maximal isometric force during handbraking and error of
prediction (Δ) according to condition (HB21, HB22, HB23, HB24 and HB25). Letters after the condition (from a to e) are used to identify Bonferroni adjusted pairwise differences with p<0.05 according to the same scheme than that of tables S1 and S2.
SUBJECT 1 2 3 4 5 6 7 8 9 10 11 Mean SD FEXP HB21 a 279 150 286 177 296 171 176 356 145 426 440 264b, e 109 HB22 b 210 106 209 126 215 155 147 279 111 279 258 191a, c, d, e 65 HB23 c 260 166 303 176 239 186 184 392 131 408 433 262b, e 107 HB24 d 291 149 302 183 303 200 173 356 166 436 466 275b, e 111 HB25 e 395 223 430 231 411 238 258 618 218 564 565 377a, b, c, d 154 FSIM HB21 a 329 204 471 178 365 198 191 453 319 474 420 327 b, e 119 HB22 b 207 133 324 109 255 186 170 324 162 364 292 230 a, c, d, e 87 HB23 c 360 221 509 216 393 204 228 528 258 535 488 358 b, e 138 HB24 d 361 201 491 168 353 216 191 446 320 433 430 328 b, e 117 HB25 e 434 350 574 315 419 404 342 644 430 708 519 467 a, b, c, d 128 Δ HB21 a 50 54 185 1 69 27 15 96 174 49 -20 64 66 HB22 b -3 27 115 -18 40 31 23 46 50 85 33 39c 37 HB23 c 99 55 206 40 154 17 44 136 127 127 54 96b 59 HB24 d 71 52 189 -15 50 16 18 90 154 -3 -36 53 70 HB25 e 39 127 144 84 7 166 84 26 212 144 -46 90 78
Table S4. Angle in degrees (ANGLE1) between the measured maximal isometric force and the maximal predicted force by the FFS in the medium configuration (HB21) for the three different force intensity instructions (MAX, HIGH, and LOW). The two last lines correspond to the mean measured force amplitudes in each condition. Letters below the INTENSITY conditions (a for LOW, b for HIGH and c for MAX) are used to identify Bonferroni adjusted pairwise differences in the table e.g., a in exponent means that the value of ANGLE1 for the considered condition is significantly different from that obtained for the LOW INTENSITY condition with p<0.05, whereas b means that the value is significantly different from that of the HIGH INTENSITY condition with p<0.05 and so on.
SUBJECT LOW a HIGH b MAX c
1 18.9 17.3 8.4 2 31.8 8.9 5.5 3 6.7 7.9 5.5 4 8.3 11.0 9.9 5 20.3 9.5 8.2 6 13.8 7.6 7.0 7 8.1 7.6 4.7 8 4.7 1.9 2.1 9 19.3 5.0 4.4 10 9.2 7.2 4.9 11 10.0 9.9 7.3 Mean 13.7c 8.5 6.2a SD 8.1 3.8 2.2
Measured force amplitude FEXP [N]
Mean 51.5a,b 130.9a,c 287.8a,b
![Table 1. Main characteristics of the two participant groups (mean ± SD [range]).](https://thumb-eu.123doks.com/thumbv2/123doknet/14661904.739893/26.918.229.689.141.276/table-main-characteristics-participant-groups-mean-sd-range.webp)