HAL Id: hal-01885794
https://hal.univ-grenoble-alpes.fr/hal-01885794v2
Submitted on 11 Nov 2018HAL is a multi-disciplinary open access archive for the deposit and dissemination of sci-entific research documents, whether they are pub-lished or not. The documents may come from teaching and research institutions in France or abroad, or from public or private research centers.
L’archive ouverte pluridisciplinaire HAL, est destinée au dépôt et à la diffusion de documents scientifiques de niveau recherche, publiés ou non, émanant des établissements d’enseignement et de recherche français ou étrangers, des laboratoires publics ou privés.
Maha Alsayasneh, Vivien Quéma, Renaud Lachaize
To cite this version:
Maha Alsayasneh, Vivien Quéma, Renaud Lachaize. The Case for Dynamic Placement of Distributed Systems Components. Conférence d’informatique en Parallélisme, Architecture et Système 2018 (COMPAS 2018), Jul 2018, Toulouse, France. �hal-01885794v2�
The Case for Dynamic Placement of Distributed Systems
Components
Maha Alsayasneh, Vivien Quéma, Renaud Lachaize Université Grenoble Alpes - Laboratoire LIG
Bâtiment IMAG - 700 av. Centrale - Domaine Universitaire 38401 St Martin d’Hères, France [email protected]
Abstract
Today distributed systems are made of many software components with complex interactions. One of the key challenges in such an environment is determining how to place the components so that the system performs efficiently. In this paper, we illustrate the importance of compo-nent placement with a case study, examining the performance of a common stream processing pipeline comprising Kafka, Spark, and Cassandra. We study three applications (word count, Twitter sentiment analysis, machine learning) and three placement strategies. Our results show that (i) placement has a significant impact on the application throughput (up to 52%) and (ii) the placement achieving best results differs depending on the application. We discuss why existing solutions for performance troubleshooting in distributed systems are not sufficient to help choosing an efficient placement or to detect if a chosen placement is significantly under-performing compared to others. Finally, we describe research directions to address this open problem.
Keywords : Distributed systems, performance optimization, application placement
1. Introduction
Applications deployed in distributed environments are composed of a variety of software com-ponents. These components provide different functionalities e.g., publish-subscribe messaging, real-time analysis and rendering of streaming data, and storage. Besides, in order to achieve scalability, each component can be divided into a number of partitions spread on separate machines for parallel processing. In addition, for fault tolerance and high availability, each component/partition typically has a number of replicas. Overall, all these components (and their internal replicas and partitions) have many interactions, involving both control messages and data. With such a complex and diverse architecture, it is generally difficult to understand the overall behavior of a distributed system and how its performance can be improved. First of all, it is difficult to determine whether or not a given system is performing efficiently with respect to the capacity of the underlying hardware resources. In particular, the existence of a saturated hardware resource does not guarantee that the resource is used efficiently (e.g., CPUs may be saturated due to contention on a spinlock). Conversely, the absence of resource satura-tion is not necessarily a sign of fluid operasatura-tion (e.g., the system may be excessively idle due to a cascade of blocking interactions with a slow thread). Second, even if an inefficiency has been
detected in the distributed system, it is often difficult to determine the root cause and/or how to fix it (e.g., if a deep modification is required or modest configuration changes are sufficient to alleviate the issue).
In this context, the present paper considers the following problem: given an already deployed dis-tributed system, is it possible to design a profiling tool able to (i) pinpoint that the system is significantly under-performing and (ii) suggest simple configuration changes to improve performance? By “simple configuration changes”, we mean actions such as adjusting the allocation of execution resources (e.g., thread pool tuning) or changing the placement of software components on the physical machines. In this paper, we only focus on the latter kind of configuration change (component placement). The crux of the problem here is that the proposed tool cannot rely on previous knowledge or trial-and-error (i.e., known performance results of alternative configurations), because a brute-force exploration of the configuration space is not viable. In this paper, make the case for the importance of this problem and report on preliminary experiments through a concrete case study. Using a distributed data processing pipeline implemented with a popular software stack (ZooKeeper, Kafka, Spark Streaming and Cassandra), we show that such a com-mon distributed system can exhibit performance trends that are difficult to anticipate/explain and very sensitive to the impact of workload changes and simple placement decisions. In other words, there is no one-size-fits-all strategy for the placement of software components, and no easy way to assert if a given placement strategy is yielding “good enough” performance. Fur-thermore, we stress that the above problems are not specific to very complex systems with factors such as large-scale deployments, massive input load, churn, resource virtualization and multi-tenancy [23, 25]. Indeed, as we show, even a small-scale system deployed on a fixed set of dedicated machines can be impacted.
The remainder of the paper is organized as follows. First, we start by describing the data pro-cessing pipeline use case and the three different examined applications in Section 2. In Section 3, we present the evaluation methodology and the results. Finally, we discuss the related work in Section 4 and provide research directions to address the problem in Section 5.
2. Context
In this section, we first present the components of the processing pipeline that we study. Then, we briefly describe the three benchmark applications built on top of it.
2.1. Case Study: Data Processing Pipeline
We consider a data processing pipeline comprising ZooKeeper [7], a coordination service, Kafka [5], a distributed publish-subscribe messaging system, Spark Streaming [6], a Big Data processing and analysis framework, and Cassandra [4], a distributed NoSQL database manage-ment system. The above-described software stack is nowadays a de facto standard in produc-tion for data analytics. In our setup, we use a factor of replicaproduc-tion of three for each component (additionally, the processing performed by Kafka and Spark is parallelized via sharding) and the whole pipeline is deployed on 6 dedicated physical machines. Additional details on the studied configurations are provided in §3.1.
2.2. Applications
For each of the three applications described below, the input data is ingested through Kafka, then processed by Spark Streaming, and the results are saved in Cassandra.
Word Count (WC)is a standard micro-benchmark for big data [11]. We use a randomly gener-ated corpus of English words.
Twitter Sentiments Analysis (TSA)monitors people’s opinion on different topics. We use the SentiWordNet [8] dictionary for opinion mining. As a dataset, we use recent tweets in English crawled through the Twitter API [21].
Flight Delays Prediction (FDP)uses machine learning (with a logistic regression classification algorithm) to predict the delays of airline flights. We use input data from the U.S. Department of Transportation’s (DOT) Bureau of Transportation Statistics (BTS) [22].
3. Evaluation
3.1. Testbed and Methodology
We deploy the data processing pipeline on a fixed number of homogeneous machines (here-after named “nodes”) – in this setup, we use six nodes. Regarding the client side, we run each single client thread on a separate machine (we increase the number of client machines as needed to reach the system saturation point). The experiments are performed on the G5K [9] testbed using the Nova cluster. Each host has the same hardware configuration with two 8-core CPUs, 32GB RAM, a 600GB HDD, and a 10 Gbps Ethernet interface. For the software stack, we use Debian 8 with a 3.16.0 Linux kernel, OpenJDK version 1.8.0_131, ZooKeeper 3.4.10, Kafka 0.11, Spark Streaming 2.1.0, and Cassandra 3.0.9.
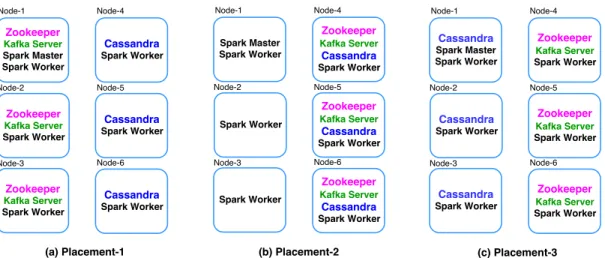
In order to build and operate a high-performance data processing pipeline, various placement strategies for the different software components can be chosen. Since a complete exploration of the configuration space is impractical, we study only a subset of the possible placement strate-gies, using the following methodology. We start by placing one component on dedicated nodes (one node per replica) and co-locating the other components on the remaining machines. This may help alleviate bottlenecks if the isolated component requires a large amount of resources (e.g., CPU time, memory bandwidth or I/O bandwidth). In addition, consolidating the remain-ing components on the other nodes may improve the performance of communications among them (local vs. remote). Given that there are three main components in the pipeline that we study (Kafka/ZooKeeper, Spark Master and Cassandra)1, exploring the above-mentioned ap-proach leads to studying three concrete deployment strategies. We then fine tune the number of Spark workers for each application, spreading them on three to six nodes2, in order to optimize the application throughput. We end up with three placement strategies (P1, P2, P3). depicted in Figure 1. P1 “isolates” the Cassandra components, while P2 and P3 respectively do the same for the Spark Master and the Kafka/ZooKeeper components.
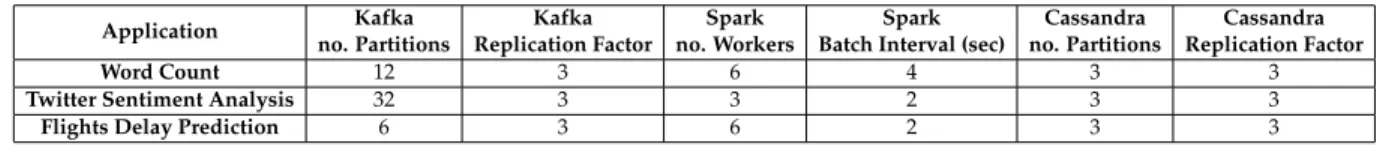
The system and application settings are tuned independently for each application (WC, TSA, FDP). However, for a given application, we use the same settings between the different place-ments, i.e., the only change between the different configurations is the placement of the com-ponents. Table 1 shows the main settings for each application.
Application Kafka no. Partitions Kafka Replication Factor Spark no. Workers Spark Batch Interval (sec)
Cassandra no. Partitions
Cassandra Replication Factor
Word Count 12 3 6 4 3 3
Twitter Sentiment Analysis 32 3 3 2 3 3
Flights Delay Prediction 6 3 6 2 3 3
Table 1: Main settings for the three studied applications.
1
ZooKeeper is only used by Kafka, which relies on it for storing metadata information and fault-tolerance. Given the tight coupling between Kafka and ZooKeeper, we systematically colocate Kafka and ZooKeeper. We have checked that ZooKeeper is never under-provisioned in our different configurations.
2
Figure 1: The three studied placement strategies for the data processing pipeline.
3.2. Results and Discussions
2 4 6 8 10 12 Number of Clients 0 200 400 600 800 1000 1200 Throughput (K.rec/sec) Placement-1 Placement-2 Placement-3
Figure 2: Throughput of the three placement strategies for the WC application
We examine the performance for the three placement strategies described earlier. For each application, our results show significant differ-ences in throughput between the three strate-gies (up to 52%, 27%, and 48%). We measure the system throughput as the number of input messages (injected by Kafka clients) that can be processed per time unit, varying the number of clients. For a given application, we compute the throughput differences using the worst per-forming placement as a baseline. Below, we mostly focus on the results for the highest in-put load.
WC:As shown in Figure 2, P3 achieves the best throughput, with respectively a 52% and a 23% improvement over P1 and P2. Besides, P2 achieves a 24% improvement over P1.
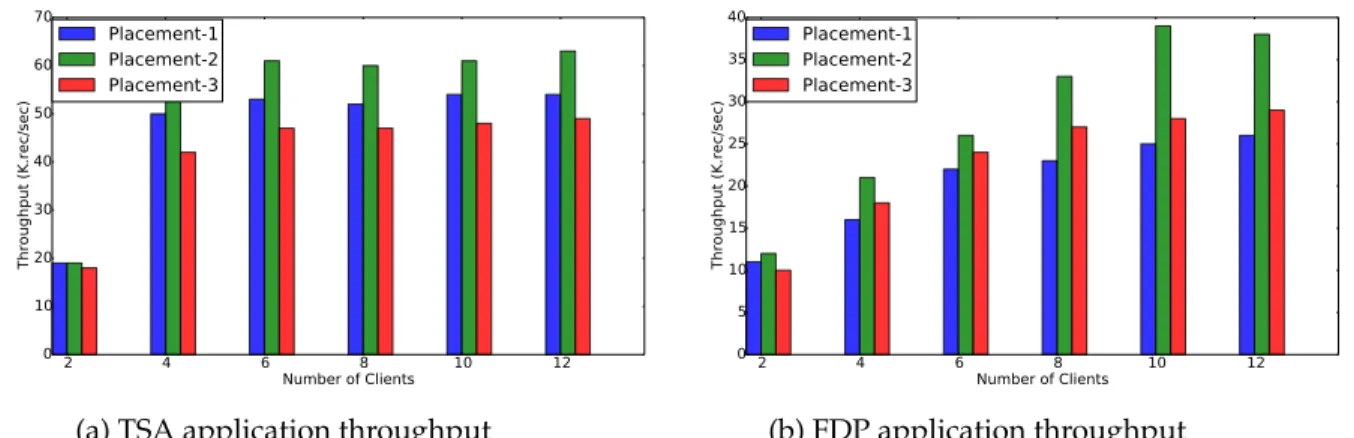
TSA:As shown in Figure 3a, P3 achieves the worst throughput (unlike with WC). P2 achieves the best throughput, with respectively a 15% and a 27% improvement over P1 and P3. Besides, P1 performs 11% better than P3.
FDP:This application yields yet another performance hierarchy. As shown in Figure 3b, P2 achieves the best throughput, with resp. a 48% and a 33% improvement over P1 and P3. Be-sides, P3 performs 10% better than P1.
Table 2 shows the resources usage for the three studied applications for each placement (mea-sured at the peak load). We can notice that these resources are far from being saturated, even in the worst case: e.g., CPU consumption and memory usage never exceed 55% and 25% respec-tively. Besides, these indicators do not necessarily exhibit large variations between the best and the worst strategies (e.g., P3 vs. P1 for WC). This discards trivial explanations for the observed performance differences between strategies.
depending on the application; (ii) the ratios of performance differences between placements vary significantly depending on the applications; (iii) none of the studied configuration exhibits any noticeable bottleneck/saturated hardware resource.
2 4 6 8 10 12 Number of Clients 0 10 20 30 40 50 60 70 Throughput (K.rec/sec) Placement-1 Placement-2 Placement-3
(a) TSA application throughput
2 4 6 8 10 12 Number of Clients 0 5 10 15 20 25 30 35 40 Throughput (K.rec/sec) Placement-1 Placement-2 Placement-3 (b) FDP application throughput Figure 3: Throughput of the three placement strategies for the TSA and FDP applications.
Resource usage P1 P2 P3
WC TSA FDP WC TSA FDP WC TSA FDP
CPU (%) Max 25 55 32 35 53 48 25 53 23 Avg 19 37 18 21 33 22 16 30 13 Memory (%) Max 19 16 19 20 18 16 22 23 23 Avg 10 10 9 10 8 15 12 13 10 Network I/O (MB/sec) Max sent 57 39 316 78 38 338 85 33 314 Avg. sent 15 12 96 20 13 76 29 11 71 Max rece. 56 37 306 83 33 369 92 37 337 Avg. rece. 14 11 93 19 12 73 28 11 69 Disk I/O (MB/sec) Max 47 10 257 68 15 312 77 12 287 Avg 11 5 69 14 6 55 21 5 52
Table 2: resources usage for the three studied applications.
4. Related work
There has been much research devoted to performance troubleshooting for distributed systems [20, 24]. Below, we discuss the most closely related works, organized into three categories. Is the system performing efficiently?
CPI2 [25] uses cycles-per-instruction (CPI) data obtained by hardware performance counters to identify slow tasks out of a set of independent but similar tasks running on a cluster of machines. To identify interfering tasks, CPI2 looks for correlations between the CPI of the
slow tasks and the CPU usage of the other tasks running on the same machine. CPI2 then uses CPU hard capping to throttle the CPU consumption of interfering tasks and improve the performance of slow tasks. This technique is not sufficient for our problem, in which there are not only interferences between local tasks but also interdependencies (via synchronous and/or asynchronous interactions) between local and remote components. Altman et al. present the
WAIT tool [2], for pinpointing the causes of idle time in server applications. The tool provides a dashboard and a rule-based system for the business component of Java Enterprise applications, highlighting where threads wait (e.g., locks, database, network, disk). However, this tool only focuses on a single component, whereas, in our case, a complete view of all the components of an application is necessary to fully understand and debug performance [10, 12].
What are the performance issues and where do they lie?
In order to fix performance issues in a system, it is necessary to identify the symptoms (“what?”) and also the root cause (“where?”). In the context of data analytics frameworks, Ousterhout et al. [17, 18] propose blocked time analysis, which allows quantifying how much faster a job would complete if its tasks never blocked on disk or network I/O. Applying their method-ology to Spark, they identify several causes for performance issues including high CPU uti-lization, garbage collection, and disk I/O. This approach is useful but currently limited to the scale/context of a single component (Spark), with specific instrumentation and assumptions regarding the execution model. Pivot Tracing [16], is a recent monitoring framework for dis-tributed systems that combines dynamic instrumentation with causal tracing. It correlates and groups system events across components and machines boundaries. As an example, this al-lows identifying the components that create resource contention downstream on other parts of the system. Pivot Tracing requires instrumentation provided by the developers or system users in order to propagate specific metadata. By design, Pivot Tracing is only aimed at pinpointing the root cause of known performance issues, not at detecting such issues, nor at suggesting optimizations.
How to place logical resources?
There has been much research devoted to improving the performance of distributed systems by optimizing the placement of its logical resources. By logical resources we refer to both (i) data and (ii) application components (i.e., code). In this Section, we first discuss related works regarding data placement [1, 14, 15]. Then, we discuss works concerning application place-ment [3, 13, 19, 26].
Agarwal et al. [1] present Volley, a system that optimizes data placement across geographically distributed data-centers by analysing request logs based on data access patterns and client lo-cations to decide how to migrate data between data centers. The migration decision is taken according to administrator-defined trade-offs between performance and cost. Kumar et al. [15] develop SWORD, a workload-aware data placement and replication approach for minimizing resource consumption. SWORD focuses on deciding which data items should be replicated and where to place the data as well as the replicas. Moreover, SWORD monitors the workload changes in order to identify candidate sets of data items whose migration has the potential to reduce the query (request) span the most and then performs the migrations during periods of low load.
Karve, et al. [13] propose a controller that dynamically configures the placement of clustered Web applications consolidated on the same set of machines. The goal is to optimize the re-source allocation and the load balancing between component instances according to the input load variations of the different applications/tiers. ClouDiA [26] is a deployment advisor map-ping latency-sensitive application components (e.g., graph processing) to virtual machine in-stances in public clouds. Taking the application communication graph, ClouDiA outputs an optimized deployment plan minimizing the largest latency between application nodes. The above-mentioned works [13, 26] are focused on optimizing a specific objective function
(re-source consolidation under a service-level agreement or network latency) and do not consider the detection and analysis of bottlenecks in the system. Amiri et al. have introduced the ABA-CUS system [3,19], which handles dynamic function placement for a data-intensive application deployed on a cluster. ABACUS continuously collects statistics and dynamically migrates com-ponents across machines if it predicts that the net effect will improve the average application response time across all the applications that are accessing a given server. This work shares some goals and building blocks with our research but also has significant differences. ABA-CUS strongly relies on the assumption that all the application components are designed with a specific framework and a dedicated programming model. Moreover, the design of ABA-CUS is mostly aimed at applications with a specific topology (a set of client and server nodes) and a specific type of problem (figuring out which subset of components executing currently on clients can benefit the most from computing closer to the data, without overloading the servers). In contrast, our work (in progress) addresses a more general version of the problem: in particular, we do not make strong assumptions about the design or implementation of the software components (although our approach may require to instrument some of them), nor about the distributed topology of the application or the performance metrics to be optimized.
5. Conclusion and research directions
This paper highlights the fact that the placement of software components can have a significant impact on the performance of distributed systems and that selecting an efficient placement is not trivial. We aspire to build a tool that is able to automatically suggest a more efficient placement strategy.
In order to address this challenge, we are currently designing a tool that will combine several kinds of inputs and build on existing methodologies for providing better insight. In addition to metrics about utilization of hardware and OS-level resources, the tool will also gather (i) network-level statistics (latency, throughput, data volumes, timing of communication patterns) and (ii) application-specific indicators both for synchronous and asynchronous interactions be-tween components (e.g., timing and contextual information about blocked time, growth rate of producer-consumer queues).
The tool will use the above-mentioned data to perform distributed blocked time analysis. This technique will extend notions from blocked time analysis [17] (identification of hardware and software bottleneck resources) and articulate them with insights from workflow-centric tools like Pivot Tracing [16] (distributed causality tracking of thread interactions and resource con-sumption). By bridging these different insights, we hope to both (i) detect inefficient interac-tions between components and (ii) identify better placement strategies through “what-if” sim-ulations.
Acknowledgments
This work is supported in part by the “Studio virtuel” project (funded by EU FEDER, Région Auvergne Rhône-Alpes and BPI, France), and the “RainbowFS” project of Agence Nationale de la Recherche, France, number ANR-16-CE25-0013-01. Experiments presented in this paper were carried out using the Grid’5000 testbed, supported by a scientific interest group hosted by Inria and including CNRS, RENATER and several Universities as well as other organizations (see https://www.grid5000.fr).
Bibliographie
1. Agarwal (S.) et al. – Volley: Automated data placement for geo-distributed cloud services. – USENIX Symposium on Networked Systems Design and Implementation, 2010.
2. Altman (E.) et al. – Performance analysis of idle programs. – In ACM Sigplan Notices, pp. 739–753. ACM, 2010.
3. Amiri (K.) et al. – Dynamic function placement for data-intensive cluster computing. – In USENIX Annual Technical Conference, General Track, pp. 307–322, 2000.
4. Apache Software Foundation. – Cassandra. – https://cassandra.apache.org/. 5. Apache Software Foundation. – Kafka. – https://kafka.apache.org.
6. Apache Software Foundation. – Spark. – https://spark.apache.org.
7. Apache Software Foundation. – Zookeeper. – https://zookeeper.apache.org. 8. Baccianella (S.) et al. – Sentiwordnet 3.0: an enhanced lexical resource for sentiment
analy-sis and opinion mining. – In LREC volume 10, pp. 2200–2204, 2010.
9. Balouek (D.) et al. – Adding virtualization capabilities to the Grid’5000 testbed. In : Cloud Computing and Services Science. – Springer International Publishing, 2013.
10. Beschastnikh (I.) et al. – Debugging distributed systems. Queue, vol. 14, n2, 2016, p. 50. 11. Dean (J.) et Ghemawat (S.). – MapReduce: simplified data processing on large clusters.
Communications of the ACM, vol. 51, n1, 2008, pp. 107–113.
12. Gregg (B.). – Systems performance: enterprise and the cloud. – Pearson Education, 2013. 13. Karve (A.) et al. – Dynamic placement for clustered web applications. – In Proceedings of
the 15th international conference on World Wide Web, pp. 595–604. ACM, 2006.
14. Kosar (T.) et Livny (M.). – A framework for reliable and efficient data placement in dis-tributed computing systems. Journal of Parallel and Disdis-tributed Computing, vol. 65, n10, 2005, pp. 1146–1157.
15. Kumar (K. A.) et al. – Sword: workload-aware data placement and replica selection for cloud data management systems. The VLDB Journal, vol. 23, n6, 2014, pp. 845–870.
16. Mace (J.) et al. – Pivot tracing: Dynamic causal monitoring for distributed systems. – In Proceedings of the 25th Symposium on Operating Systems Principles, pp. 378–393. ACM, 2015. 17. Ousterhout (K.) et al. – Making sense of performance in data analytics frameworks. – pp.
293–307. USENIX Symposium on Networked Systems Design and Implementation, 2015. 18. Ousterhout (K.) et al. – Monotasks: Architecting for performance clarity in data analytics
frameworks. – In Proceedings of the 26th Symposium on Operating Systems Principles, pp. 184– 200. ACM, 2017.
19. Petrou (D.) et al. – Easing the management of data-parallel systems via adaptation. – In Proceedings of the 9th workshop on ACM SIGOPS European workshop: beyond the PC: new chal-lenges for the operating system, pp. 103–108. ACM, 2000.
20. Sambasivan (R. R.) et al. – Principled workflow-centric tracing of distributed systems. – In Proceedings of the Seventh ACM Symposium on Cloud Computing, pp. 401–414. ACM, 2016. 21. Scott (J.). – Archive team: The twitter stream grab. – https://archive.org/details/
twitterstream, 2012.
22. U.S. Department of Transportation, Bureau of Transportation Statistics. – Airline on time data. – http://stat-computing.org/dataexpo/2009/the-data.html, 2009. 23. Veeraraghavan (K.) et al. – Kraken: Leveraging live traffic tests to identify and resolve
resource utilization bottlenecks in large scale web services. – In OSDI, pp. 635–651, 2016. 24. Wang (C.) et al. – Performance troubleshooting in data centers: an annotated bibliography.
ACM SIGOPS Operating Systems Review, vol. 47, n3, 2013, pp. 50–62.
Proceedings of the 8th ACM European Conference on Computer Systems, pp. 379–391. ACM, 2013.
26. Zou (T.) et al. – Cloudia: a deployment advisor for public clouds. The VLDB Journal, vol. 24, n5, 2015, pp. 633–653.