DEVELOPMENT OF TECHNIQUES AND TOOLS FOR THE DETERMINATION OF CARBON
ANODE QUALITY
Duygu Kocaefe1, Yasar Kocaefe1, Dipankar Bhattacharyay1, Bazoumana Sanogo1, Yao Ahoutou1, Hang Sun1, Patrick Coulombe2 1Centre universitaire de recherche sur l’aluminium (CURAL), University of Quebec at Chicoutimi, 555, boul. de l’Université, Chicoutimi,
Quebec, Canada G7H 2B1
2Aluminerie Alouette inc., 400, Chemin de la Pointe-Noire, C.P. 1650, Sept-Îles, Quebec, Canada, G4R 5M9
Keywords: Coke, Pitch, Image Analysis, Vibro-compactor, Sound Analysis, Impurities, Colorimetry, Resistivity Abstract
The quality of prebaked carbon anodes, consumed in electrolysis during the primary aluminum production, has an important impact on the cell performance. The anode quality depends on the raw material quality and operating conditions in the anode plant. Development of simple, quick, and inexpensive techniques and tools for anode quality control will help industry identify the source of problems and take the necessary corrective actions rapidly. In this article, different quality control tools developed to find the wettability of coke by pitch, effect of mixing on coke particle size distribution, metallic impurity content, optimum vibration time, pitch content in green anode, and the measurement of green and baked anode electrical resistivities are presented. In parallel, data analysis using the artificial neural network (ANN), a powerful statistical tool for such applications, provides complementary information on quality and process. This article also presents the potential utilization of ANN in quality control.
Introduction
Primary aluminum is produced by the electrolysis of alumina in the Hall-Héroult process. The anodes are the source of carbon required for the reduction process. Carbon anodes constitute an important part of the aluminum production cost [1, 2]. During the production of aluminum, carbon anodes are consumed and CO2 is
produced [3]. CO2 further reacts with the anode carbon to produce
CO. Air also reacts with the exposed anode surface to produce CO2. These reactions increase anode consumption and add to the
cost of aluminum production. One of the key industrial goals is to minimize this excess consumption of anodes. The energy consumption increases with increase in electrical resistivity of anodes. In general, high density, low specific electrical resistivity, low permeability, low reactivity, high mechanical strength, and high thermal shock resistance are the basic requirements of good quality anodes [1]. The anode quality depends on the raw material quality and operating conditions in the anode plant. Improvement in anode quality can reduce the production cost, energy consumption, and the emission of greenhouse gases.
Anodes are produced using a mixture of dry aggregates (calcined petroleum coke, recycled green and baked anodes, and butts) and coal tar pitch. Petroleum coke constitutes about 2 % of the overall production of an oil refinery [4]. Thus, its quality is not necessarily a major concern for the petroleum industry. Coal tar pitch, which is a binder for the dry aggregate, is a residue produced by the distillation or heat treatment of coal tar. Similar to coke, the quality of this by-product is crucial for the anode quality. Variations in raw material properties and quality create challenges for producing of good quality anodes and maintaining the quality in the aluminum industry.
Anode paste is produced by mixing dry aggregate with molten pitch [3]. The interaction of dry aggregates with pitch controls the mixing characteristics and the properties of paste [5, 6]. The measurement of wettability for different components of dry aggregate by pitch gives an indication of the paste quality. Under good forming and baking conditions [7, 8], a good quality paste will result in good quality anodes. Thus, the measurement of wettability of a dry aggregate by pitch is an important tool to control the final anode quality. Also, the measurement of the granulometry of particles before and after mixing indicates the efficiency of mixing [9]. Currently, toxic solvents such as xylene are used to remove pitch from paste to measure the granulometry of the clean particles.
The paste is compacted by a press or a vibro-compactor to produce green anodes. Nowadays, the industry usually uses vibro-compactors. The green anodes are then baked at high temperature during which pitch is carbonized [10]. This helps bind the particles together and, consequently, decreases the electrical resistivity.
The vibration time used to vibro-compact the anode paste is one of the key parameters that influence the properties of carbon anodes. If the anode is compacted for a short time (under-compaction), the green anode density will be low giving high porosity. If the anode is compacted for a period longer than necessary (over-compaction), the green anode density will be high resulting in the formation of cracks in the anode during baking [8]. Thus, under-compaction or over-compaction of anodes leads to poor anode quality. Variation in raw material quality, recipe, and other parameters can influence the optimum compaction time. Compaction for an optimum time helps produce good quality green anodes, which is likely to produce good quality baked anodes. Jonathan et al. [11] used the acceleration of the vibro-compactor table to determine the optimum compaction time. Gao et al. [12] used the movement of a bar fixed to the cover of the compactor to determine this time. Such tools were difficult to implement in the plant. Thus, a tool indicating the optimum compaction time of the paste during the compaction process is important to control anode quality.
The level and the distribution of pitch influence the homogeneity of an anode. Non-homogeneity in anodes results in non-uniform consumption in the electrolytic cell. Also, baking is a costly process as it involves significant amount of time and fuel. Presently, the quality of industrial green anodes is judged by visual inspection [13] which may lead to problems as the perceptions of different human beings are different. A tool is necessary to evaluate the pitch distribution in a green anode without damaging the anode. This would help eliminate the “human factor” from the quality control of a green anode and reduce the loss incurred by baking defective anodes.
Additional carbon is lost during the electrolytic process due to air and carbon dioxide reactivities [14]. Impurity content in the anode controls the reactivities significantly. There are different standard methods to quantify the impurities. The American Society for Testing and Materials (ASTM) developed different test methods using Inductively Coupled Plasma Atomic Emission Spectrometry (ICP-AES), Atomic Absorption Spectrometry (AAS), and X-ray Fluorescence Spectroscopy (XRF) [15]. These standard methods require intensive sample preparation, highly skilled personnel, and costly reagents. The methods are usually time-consuming. Thus, a simple but effective tool is necessary to estimate the level of different impurities in the raw materials and the anode. This tool can help control the quality of an anode.
Electrical resistivity is an important property which shows the quality of an anode. High resistivity values in a green anode indicate the presence of cracks or high concentrations of pitch [16]. High resistivity values in a baked anode however show the presence of cracks [16]. Over-pitching in a green anode could create high porosity/cracks in the baked anode due to higher devolatilization at a particular location. The distribution of electrical resistivity in an anode shows the level of non-homogeneity in that anode. The problems in the green anode will have consequences later on during baking and electrolysis, resulting in high energy and carbon consumption [16, 17]. Hence, a tool is necessary for the industry to determine the distribution of electrical resistivity in green and baked anodes to control quality. The study of the impact of raw material quality as well as processing parameters for the production of anodes on baked anode properties is of great importance. The strength of the plants is their collection of vast amount of data related to the quality of raw materials, process conditions and the quality of baked anodes. However, the data are complex; and it is hard to analyze using conventional methods. Artificial neural network (ANN) is a mathematical tool that can analyze these data and can predict baked anode properties based on the quality of raw materials and process parameters even before baking [18]. Models based on ANN can help produce good quality anodes, minimize rejections, and improve anode quality. Berezin et al. [1] used ANN to predict problems in an aluminum reduction cell. Meghlaoui et al. [19] developed an ANN model for efficient control of alumina feeding in the electrolytic cell. Bhattacharyay et al. [18, 20, 21] have studied the effect of different parameters on anode properties.
Different tools for the quality control of anodes Different tools were developed to monitor and control anode quality at different stages of production based on industrial needs. Wettability of a dry aggregate by pitch
The wettability of the different components (coke, butts, etc.) of a dry aggregate by a pitch drop was characterized with the contact angle formed between the pitch drop and the solid particle bed. The wettability was measured by the sessile drop method at 170 °C under inert nitrogen atmosphere. The dynamic contact angle was determined by using a video recorder, and the contact angle was measured from the images using the FTA 32 software [5, 6, 22]. The higher the contact angle is, the lower the wettability of the solid particle by the pitch is.
Granulometry of paste
An inexpensive, quick, and environmentally-friendly method was developed to remove pitch from the paste using a nontoxic solvent [9]. The paste was dipped in the solvent for a specified time. The clean particles were dried and sieved, and then the granulometry was measured. Figure 1 shows the steps of the process.
Figure 1: Extraction of pitch from anode paste [9] Measurement of impurities in raw materials or anodes
A method was developed to extract metallic impurities (transition metals iron, vanadium, nickel) from carbon samples by chemical reaction as well as electrophoresis [23]. The extracted metallic impurity was measured by colorimetry. The solution of the extracted metal was treated with a reagent to produce a color. The schematic of the set-up is shown in Figure 2. The picture of the colored solution in a plastic container was taken using a camera, and the color of the picture was analyzed after a certain time with a custom-made software. A calibration curve was prepared by plotting a color component with the known concentration (measured by XRF) of the impurity. The calibration curve was later used to determine the concentration of the metallic impurity in an unknown sample. The method was validated in the presence of interfering ions.
Figure 2: A schematic view of the set-up to analyze color Determination of optimum vibration time using sound analysis A tool was developed to determine the optimum compaction time based on the analysis of sound of the vibro-compactor. In this method, the sound of the vibro-compactor was recorded using a microphone (Audio Technica ATR6550 Condenser Shotgun) and a custom-made software. The recorded sound during the compaction process was analyzed using the software. The rates of change in the levels of the sound of the vibro-compactor were calculated in a certain frequency range. The optimum time of compaction was determined based on the rate and some predetermined threshold values. Figure 3 shows the position of the microphone used for the analysis.
Figure 3: Position of the microphone Measurement of pitch distribution using image analysis
An image analysis tool was developed to analyze the level and the distribution of pitch on the green anode surface. Figure 4 shows a schematic view of the set-up. The anode surface was illuminated uniformly. Then, the picture (mvBlueFOX USB2.0 camera) of the surface of the anode was taken and different color components were analyzed with a custom-made software. The software determines the value of color component above which there is high level of pitch on the anode surface. These positions are marked with pink colors in the picture. It also measures the size distribution of the pink patches. A large-size pink patch means a significant concentration of pitch at that point, and such anodes may create problems during baking.
Figure 4: A schematic view of the set-up to analyze the pitch distribution on a green anode surface
A spectrophotometric method was also developed to measure the level of pitch in an anode sample. The pitch was extracted with a solvent and the quantity of pitch was measured by a UV-visible spectrophotometer at a particular wavelength of light. The pitch levels in anode samples were measured by the spectrophotometric method to validate the image analysis results.
Measurement of electrical resistivity distribution
A simple, fast, and non-intrusive method and equipment, SERMA (Specific Electrical Resistance Measurement of Anodes) was developed to measure the distribution of electrical resistivity in an industrial anode. A current was passed at multiple points through the anode block from one surface to the opposite surface, and the corresponding voltage drops are measured. The electrical resistivities at different points were calculated across the anode. This technique could be used for both green and baked anodes. A low current level is used (in the order of about 10 amperes) to make it easy to implement in the plant. Low current levels also ensure that any perturbation in the anode is small.
Four plates were used to carry out the measurements: two plates between the top and bottom surfaces of the anode and two plates between the side surfaces. Each pair of plates contains a certain number of flexible contacts at exactly the same positions to feed current from one surface and to receive it from the opposite surface. These contacts were connected to a power supply and the circuit was completed. Close to the current contacts, the voltage contacts were installed on both plates to measure the voltage drop at a given position. The current and voltage contacts were distributed over the plate covering the entire anode surface. The results were plotted to identify the defects in the anode. The schema of the set-up was published elsewhere [16, 17].
Artificial neural network (ANN)
Different custom made feed-forward ANN models were developed. The models were trained by experimental data. The model identifies the pattern in the experimental dataset. The model was then validated with the experimental data which were not used for training. The validated model was used to predict different anode properties for which no experimental data are available. The description of different ANN models were published elsewhere [18, 20, 21].
Results and Discussion Wettability of a dry aggregate by pitch
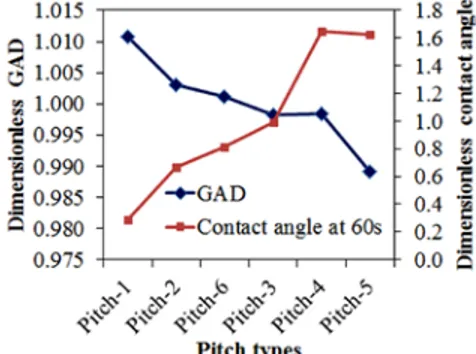
A number of studies were published [5, 6, 9, 22] in the literature by the research group on the wettability of different types of coke by different pitches. Figure 5 shows the wettability of a particular coke by different pitches and the densities of the green anodes produced by the coke-pitch pairs [22]. The wettability was expressed in terms of contact angle. A low contact angle indicates high wettability of coke by pitch. The results show that the green anode density (GAD) increased when the contact angle was low (good wetting). Thus, the tool helps identify the suitable coke-pitch pair. Good wettability of coke by coke-pitch will result in a good green anode density.
Figure 5: Comparison of contact angle for a particular coke wetted by different pitches, and the densities of the green anodes
produced by the coke-pitch pairs [22] Granulometry of paste
The method was developed to determine the granulometry before and after mixing with an industrial kneader (Figure 6) [9]. In this figure, particle size decreases from 1 to 6. Very fine particles (ball mill product, filtered dust) were not included in this analysis because the emphasis was to investigate if the large particles were
crushed during kneading. Figure 6 shows that there were changes in the particle size fractions of 1 and 2. Reduction in coarser size fractions resulted in an increase in smaller size fractions (size 5 and size 6).
Figure 6: Coke fraction distribution before and after kneader [9] Measurement of impurities in raw materials and anode samples Different coke and butt samples were used for the analysis. The samples were treated with acid followed by electrophoresis. Measured amount of the clear solution obtained by electrophoresis was treated with reagents to produce a certain color. Figure 7 (a-c) shows the color produced by iron, vanadium, and nickel, respectively.
Figure 7: Colors produced by the coke extract containing (a) iron, (b) vanadium, and (c) nickel
Table 1 shows the validation of the colorimetric method by comparing with the XRF analysis. The results show that the colorimetric method could estimate the impurity levels in carbon samples with a reasonable precision. The differences in the values might be due to the non-homogeneity of the samples. The analysis time was around 30 minutes, and no special sample preparation was necessary. In all cases, standard laboratory grade reagents were used. Thus, the method was fast, inexpensive, but reliable. The method worked for both coke and butt samples.
Determination of optimum vibration time using sound analysis During the compaction of paste in a vibro-compactor to form a green anode, there are three phases: reorganization of the particles, compaction, and stabilization [24]. Figure 8 shows a typical analysis of the sound of a vibro-compactor, and three phases can be clearly identified. Certain criteria were used to identify the end of each phase. An anode which passes through all these phases is compacted well. Specific criteria were used to mark the end of the stabilization phase to determine the optimum compaction time. Experimental studies showed that the anodes compacted for optimum time had high green and baked densities. Four anodes were fabricated using the same raw material and under the same conditions for validation. The time of compaction was maintained the same. The sound of the compactor was analyzed, and the optimum compaction time was identified for each anode. The difference between the actual and the optimum compaction times showed the level of over-compaction of the green anode. The anodes were baked and the ratio of the baked anode density (BAD) to the green anode density (GAD) was plotted as a function of the over-compaction time (Figure 9). The
results show that the BAD for the same GAD increased when the over-compaction time decreased. The anodes compacted close to the optimum time had relatively higher baked density. The study also shows that the non-homogeneity of the raw materials has an influence on the optimum time of compaction.
Table 1. Comparison of XRF and colorimetric results for different impurities Impurity Sample Concentration, ppm Measured by XRF Measured by colorimetry Iron Coke 100 92 Butt 260 270 Coke 200 210 Vanadium Coke 330 335 Butt 390 390 Coke 320 318 Nickel Coke 170 171 Coke 160 161 Butt 150 149 Coke 200 201
Figure 8: Different phases of compaction obtained from the analysis of the sound of a vibro-compactor
Figure 9: Change in the BAD/GAD ratio as a function of the level of over-compaction
Measurement of pitch distribution using image analysis
Figure 10 (a) shows the picture of the surface of a rejected industrial green anode, taken by a digital camera under certain lighting conditions. Figure 10 (b) shows the locations with high pitch concentrations (marked in pink). The picture shows high pitch content on the top right corner of the anode. It also shows high pitch content at the top of the slots. The size of the patches shows that the anode is not suitable for baking. If this problem is found repeatedly, then the pitch content of the anode, mixing and forming conditions should be assessed.
Figure 10: (a) Picture of the surface of a rejected green anode, (b) Analysis of the surface (Pink color shows high
pitch concentration)
To validate the method developed for the determination of pitch distribution on a green anode surface using image analysis, tests were performed using laboratory anodes. Different sections of a laboratory anode surface (see Figure 11 (a)) were analyzed by the image analysis technique (results are shown in Figure 11 (b)) and the spectrophotometric method. The results are summarized in Figure 12 which shows that there is a good correlation (R2 = 0.95)
between the percentages of pink patches with the amount of pitch determined by the spectrophotometric method. Thus, the pink patch on the anode surface can be an indicator of the distribution of pitch on the anode surface.
Figure 11: (a) Different sections of a lab anode (b) Results of the image analysis of the surface
Figure 12: Comparison of the results of the spectrophotometric and image analysis techniques for different anode sections Measurement of the electrical resistivity distribution
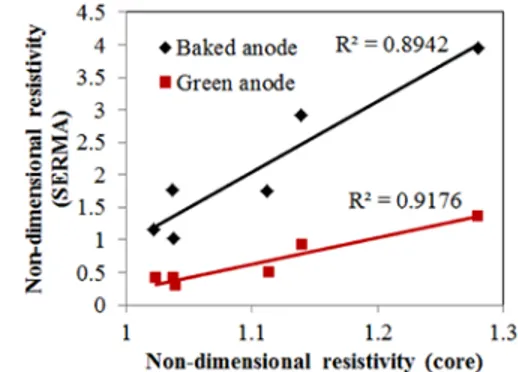
The overall resistivities of different industrial green and baked anodes were measured using SERMA. Then, cylindrical core samples were taken from different sections of the anodes, and the resistivities of these samples were measured according to the ASTM standard. The resistivities of anodes measured by SERMA and those of the cores were compared [17]. Figure 13 shows that a reasonably good correlation was found between the average resistivity measurements obtained with the equipment and those
of the cores. The method can be used for both green and baked anodes.
Figure 13: Comparison of average non-dimensional resistivities measured using SERMA with those determined from the cores taken from different positions in the green and baked anodes [17] Artificial neural network (ANN)
Industrial as well as published data were analyzed using the ANN model. The ANN model was found to identify the effect of a particular component better than the linear multivariable analysis and partial least square methods [21]. For example, it is difficult to determine experimentally the effect of a particular impurity since it is not possible to change the concentration of only that impurity while keeping the others constant. An example for such a case is presented here. Figure 14 shows that both vanadium and iron could catalyze the CO2 reactivity of anodes [18, 25-27]. This
observation is supported by different researchers. The ANN study showed that both elements showed similar effect when their concentrations were low. However at high concentrations iron seems to have more influence on CO2 reactivity [20].
Figure 14: Effect of vanadium and iron on CO2 reactivities [16]
Conclusions
Techniques and tools were developed to determine the sources of the anode-quality related problems. Wettability measurements give an idea on the degree of interaction between coke and pitch. A method was developed to measure the particle distribution in paste to see if the kneader affected the granulometry. The above two methods can help obtain a good paste, which leads to good quality anodes provided that the other conditions are suitable as well. Metallic impurities affect the anode reactivity and consequently carbon consumption. With the methods developed, metallic impurities in raw materials or anodes can be measured. If
the vibro-compaction time is not well-chosen, anodes can be under or over-compacted, leading to the deterioration of the anode quality. The method developed can determine the best vibration time for each anode. A method was also developed to measure the surface pitch distribution of green anodes, which identifies over and under-pitched anodes. A method and equipment (SERMA) were developed to measure the electrical resistivity distribution in anodes, which can detect the actual location of a defect. The last three methods have the potential for on-line use in plants. The ANN model can be used to analyse the vast amount of data available in the plants to get information on the relationship between various parameters, including the impact on anode quality. Above tools can help industry apply immediately the necessary corrective action when a problem is detected.
Acknowledgements
The technical and financial support of Aluminerie Alouette Inc. as well as the financial support of the Natural Sciences and Engineering Research Council of Canada (NSERC), the Développement économique Sept-Îles, the Université du Québec à Chicoutimi (UQAC), and the Foundation of Université du Québec à Chicoutimi (FUQAC) are greatly appreciated.
References
1. A. I. Berezin, P.V. Polaykov, O. O. Rodnov, V.A. Klykov, V.L. Krylov, “Improvement of green anodes quality on the basis of the neural network model of the carbon plant workshop”, Light Metals, (2002), 605-608.
2. Choate, W.T. and G. John A. S, U.S. Energy requirements for aluminium production: historical perspective, theoretical limits and new opportunities, U.S. Department of Energy, Energy Efficiency and Renewable Energy: Washington, D.C., (2003).
3. K.L. Hulse, Anode Manufacture, R&D Carbon Ltd., New Zealand, (2000).
4. R. Fernandez, “Petroleum coke, grades and production”, CarboMat seminar, Trondheim, (2003).
5. A. Sarkar, D. Kocaefe, Y. Kocaefe, D. Sarkar, D. Bhattacharyay, B. Morais, “Coke-pitch interactions during anode preparation”, Fuel, (2014), 117(A), 598–607.
6. X. Huang, D. Kocaefe, Y. Kocaefe, D. Bhattacharyay, “Wettability of bio-coke by coal tar pitch for its use in carbon anodes”, Colloids and Surfaces A: Physicochemical and Engineering Aspects, (2016),490, 133-144.
7. K.A. Dorcheh, “Investigation of the materials and paste relationships to improve forming process and anode quality”, PhD thesis, University of Laval (2013).
8. S. Amrani, D. Kocaefe, Y. Kocaefe, D. Bhattacharyay, “Characterization of cracking mechanisms of carbon anodes used in aluminum industry by optical microscopy and tomography”, Journal of Materials Engineering and Performance, (2016), DOI: 10.1007/s11665-016-2257-3. 9. A. Sarkar, “Effect of coke properties on anode properties”,
PhD thesis, University of Quebec at Chicoutimi, Canada, (2016).
10. N.A Adams, “Characterization on pitch wetting and penetration behaviour of petroleum coke and recycled butts in prebake carbon anode”, Ph.D thesis, The Pennsylvania State University, University Park, (2004).
11. P.H. Jonathan, B. Arnaud, T. Sonia, “Maximising vibroformer performance through vibration monitoring”,
10th Australasian Aluminium Smelting Technology Conference, (2011).
12. S. Gao, C. Bao, S. Zhang, H. Wang, J. Woo, E. Cutshall, “Optimum vibration time for green anode production”, Light Metals, (2013), 1123-1126.
13. D. Bhattacharyay, D. Kocaefe, Y. Kocaefe, B. Morais, “Determination of coke, pitch and pores/cracks in green anode by image analysis”, Journal of Surface Engineered Materials and Advanced Technology, (2013), 3, 1-6. 14. D. Kocaefe, A. Sarkar, S. Das, S. Amrani, D. Bhattacharyay,
D. Sarkar, Y. Kocaefe, B. Morais, M. Gagnon, “Review of different techniques to study the Interactions between Coke and Pitch in Anode Manufacturing”, Light Metals, (2013), 1045-1050.
15. American Society for Testing Materials, “Annual book of ASTM standards” (Philadelphia, PA: ASTM, American Society for Testing and Materials, Vol. 5. 1970).
16. Y. Kocaefe, D. Kocaefe, D. Bhattacharyay, “Quality control via electrical resistivity measurement of industrial anodes, Light Metals, (2015), 1097-1102.
17. D. Kocaefe, Y. Kocaefe, D. Bhattacharyay, “Measurement of anode electrical resistivity for quality control in aluminum industry, COM 2014 (Conference of Metallurgists), (2014).
18. D. Bhattacharyay, D. Kocaefe, Y. Kocaefe, B. Morais, “An artificial neural network model for predicting the CO2
reactivity of carbon anodes used in the primary aluminum production”, Neural computing and Applications, (2015), 26(8), DOI 10.1007/s00521-015-2093-7.
19. A. Meghlaoui, R.T. Bui, J. Thibault, L. Tikasz, R. Santerre, “Predictive control of aluminum electrolytic cells using neural networks”, Metall Mater Trans B, (1998) 29(5),1007– 1019.
20. D. Bhattacharyay, D. Kocaefe, Y. Kocaefe, B. Morrais, M. Gagnon, “Application of the artificial neural network (ANN) in predicting anode properties”, Light Metals, (2013), 1189-1194.
21. D. Bhattacharyay, D. Kocaefe, Y. Kocaefe, B. Morrais, “Comparison of linear multivariable, partial least square regression and artificial neural network analyses to study the effect of different parameters on anode properties”, Light Metals, (2015),1129-1134.
22. Y. Lu, “Effect of pitch properties on anode properties”, Masters thesis, University of Quebec at Chicoutimi, Canada, (2016).
23. Bureau, D. Kocaefe, D. Bhattacharyay, Y. Kocaefe, B. Morais, “Quantification of sodium present in dry aggregates and anodes”, Light Metals, (2016), 877-881.
24. F. Rabaine, “Étude de l’influence des paramètres de vibro-compaction sur les propriétés mécaniques des anodes crues en carbone”, PhD thesis, University of Quebec at
Chicoutimi, Canada, (2016).
25. M.R.J. Tosta, E.M. Inzunza, L.A. Delgado, “Boron salt inhibitors of air reactivity of prebaked carbon anodes: literature review and laboratory studies. Light Metals (2009), 1173–1176.
26. Y.D. Bensah, T. Foosnaes, “The nature and effect of Sulphur compounds on CO2 and air reactivity of petrol coke, ARPN J
Eng. Appl Sci.,(2010), 5(6):35–43.
27. T. Eidet, M. Sorlie, J. Thonstad, (1997), “Effects of sulphur, nickel and vanadium on the air and CO2 reactivity of cokes. Light Metals, (1997), 436–437.
![Figure 1: Extraction of pitch from anode paste [9]](https://thumb-eu.123doks.com/thumbv2/123doknet/7575977.231035/2.918.534.778.211.380/figure-extraction-pitch-anode-paste.webp)