HAL Id: tel-00726013
https://tel.archives-ouvertes.fr/tel-00726013
Submitted on 28 Aug 2012HAL is a multi-disciplinary open access archive for the deposit and dissemination of sci-entific research documents, whether they are pub-lished or not. The documents may come from teaching and research institutions in France or abroad, or from public or private research centers.
L’archive ouverte pluridisciplinaire HAL, est destinée au dépôt et à la diffusion de documents scientifiques de niveau recherche, publiés ou non, émanant des établissements d’enseignement et de recherche français ou étrangers, des laboratoires publics ou privés.
An Integrated Process Planning System for Machining
and Inspection
Yaoyao Zhao
To cite this version:
Yaoyao Zhao. An Integrated Process Planning System for Machining and Inspection. Chemical and Process Engineering. University of Auckland, 2009. English. �tel-00726013�
An Integrated Process Planning System for
Machining and Inspection
Yaoyao (Fiona) Zhao
A Thesis submitted in partial fulfilment of the requirements for the degree of Doctor of Philosophy in Engineering
December 2009
Intelligent and Interoperable Manufacturing Systems Research Group Department of Mechanical Engineering
Faculty of Engineering University of Auckland
Abstract
Abstract
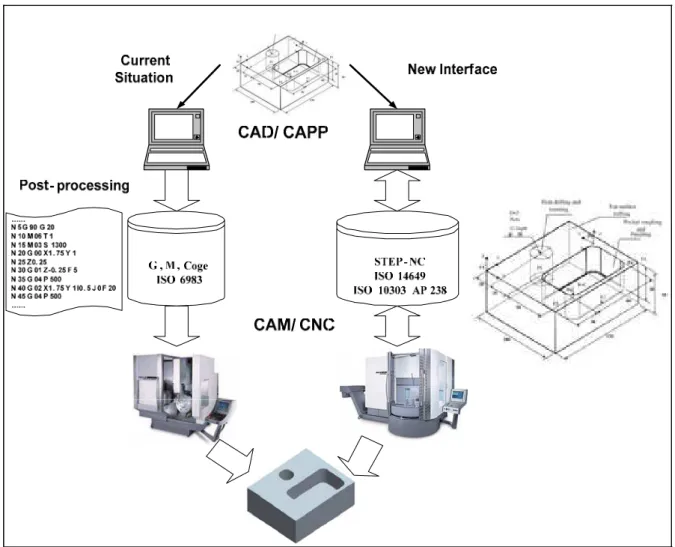
Due to the deterministic nature of manufacturing processes, measuring important process parameters and performing timely adjustment is an effective way to improve manufacturing efficiency and quality. In-process measurement is such a method. It is capable of monitoring manufacturing processes in real time. However, the current information flow between different manufacturing processes is segmented due to the lack of a consolidated data model to represent sufficient information of a product. This directly results in segmented process planning for in-process measurement. The establishment of STEP (STandard for Exchange of Product data) offers manufacturers a new method to exchange product data through the entire product lifecycle. As an extension to STEP, STEP-NC provides the potential to finally close the gap between design and manufacturing in the drive for a complete and integrated product development environment. The STEP/STEP-NC data model is a long overdue improvement in the domain of process planning for Computer Numerical Controlled (CNC) machining in the industry where G-codes have been in use for more than half a century. STEP/STEP-NC brings richer information to the CNC machining industry presenting an opportunity for the development of more intelligent, interoperable and informative machining processes.
The research work documented in this thesis introduces a consolidated STEP/STEP-NC data model and system for an automatic and integrated process planning system for machining, in-process measurement, and feedback. This research first developed the current STEP/STEP-NC data model with new definitions covering tolerance requirement information, and measurement operation information. A mechanism to link tolerance requirements and machining feature information was also developed to provide the crucial connection between machining and measurement.
With sufficient information provided by the proposed STEP data model, the concept of an integrated process planning system was conceived to carry out automated process planning for machining and in-process measurement. The system is able to analyse and select critical tolerance(s) from an input data file, generate measuring operation(s) for each
Abstract
critical tolerance in-between machining operations. Measurement of each critical tolerance is also planned by the developed system including generating, allocating, and sequencing measurement points for each measuring operation. After the measurement results of each measuring operation are collected, the system analyses the results and provides proper adjustments to the immediate subsequent machining operation(s). A software prototype was developed to test the proposed data model and the integrated process planning and feedback concept.
The ultimate goal of performing measurement in a manufacturing system is to gain close control of the machining process based on tolerance requirements and to adjust process errors as they occur. The key issue is to connect machining and tolerance requirements. What to measure and when to measure is another critical issue. This research has made an attempt to address these issues in order to realize a long-awaited paradigm of automatic placement of measurement procedures in-between machining operations and provide automated process-intermittent feedback to the machining process.
The research work in this thesis has been reported in 3 published journal papers [1-3], 2 journal papers in press [4, 5], and presented at 2 international conferences [6, 7]. This research has also been carried out in collaboration with the U. S. National Institute of Standards and Technology where the author made two research visits.
Acknowledgements
Acknowledgements
For the past three years, my life has been devoted to this research. It has been a rewarding journey: along the way I have stumbled but regained my footing, I have learnt and I have grown. Always, I have received support and encouragement from my supervisors, colleagues, friends, and my parents. Without them I would not have reached this point. I extend my appreciation and thanks to each of those people who helped me, cared about me and loved me.
Firstly, I offer a special thank you to my supervisor, Associate Professor Xun Xu, who gave me the opportunity to work on this exciting research project. His supervision, encouragement, and inspiration supported me all the way. His advice on doing research and on becoming a better person is invaluable to me. I am also thankful to my co-supervisor, Dr. Shane Xie, and the Advisory Committee members for their detailed and constructive comments.
Many thanks to Mr. Sarath Pathirana and Mr Ken Snow, the technicians at the Manufacturing Systems Laboratory, for their kind assistance, useful comments and prompt response toward my request.
I feel fortunate to have been part of such a vibrant research community – Intelligent & Interoperable Manufacturing Systems (IIMS) group – that enabled me to be benefited from interactions with a number of researchers in that group: Dr. Derek Wang, Mohamad Bin Minhat, Albert Yang, Salah Habeeb, Firman Ridwan, Aini Zuhra Abdul Kadir, Vincent Wang, and Dr. Matthieu Rauch. I would like to thank also Ian Yen-hung Chen from the Electrical and Computer Engineering Department for his help on the software development. I am thankful for and proud of the friendship I share with each of them.
Funding for this research project has been supplied by the University of Auckland Faculty of Engineering International Doctoral/Fees scholarship, Postgraduate Students Support (PReSS) funding, and New Zealand Postgraduate Study Abroad Award. Without their support, this project would not have happened.
Acknowledgements
Lastly, I present this thesis as a special gift to my mother and father for their unflagging love and support through out my life. Had it not been for their ongoing encouragement and love, this thesis would have not been a reality. Throughout my life, they have done their uttermost to provide me with the best possible environment to grow up in, be it for attending school or studying overseas. My parents have always been there for me, both during my rebellious teenage years and later, supporting me and encouraging me every time I felt beset by difficulties, under pressure or feeling a bit down. I have no words adequate to fully describe my appreciation of their everlasting love for me. They are the best parents I could every ask for. This thesis is my special gift to them; I trust they will share this happiness with me. I will continue to do my best to be the daughter they are proud of.
Yaoyao Fiona Zhao
List of Abbreviations
List of Abbreviations
AAG Attributed Adjacency Graph
AAM Application Activity Model
AIAG Automotive Industry Action Group
AIM Application Interpreted Model
AM Application Model
ANSI American National Standards Institute
AP Application Protocol
API Application Programming Interface
ARM Application Reference Model
ASME American Society of Mechanical Engineers
ASQ American Society for Quality
BS British Standard
CAD Computer-Aided Design
CAIPP Computer-Aided Inspection Process Planning
CAM Computer-Aided Manufacturing
CAPP Computer-Aided Process Planning
CAVES Computer Aided Valid Expert System
CLM Closed-loop Manufacturing
CMM Coordinate Measuring Machine
CMC Canonical Machining Commands
CNC Computer Numerical Controlled
DMIS Dimensional Measuring Interface Standard
DML Dimensional Markup Language
DMSC Dimensional Metrology Standard Consortium
EB Error Budge
EMC Enhanced Machine Controller
EWEDS Extended Winged Edge Data Structure
List of Abbreviations
FTP File Transfer Protocol
GCAPPSS Genetic Computer-Aided Process Planning Support System GD&T Geometric and Dimensional Tolerancing
GOIS Genetic Object Information System
GSL GNU Scientific Library
HIPP High-level Inspection Process Planning
HTTP Hyper Text Transfer Protocol
I++DME Inspection++ Dimensional Measurement Equipment
IDE Integrated Development Environment
IDEF0 Integration DEfinition for Function Modelling IGES Initial Graphics Exchange Specification
IIMS Intelligent and Interoperable Manufacturing Systems
IPF Inspection Plan Fragments
IPIM Integrated Product Information Model IPPEX Inspection Process Planning EXpert system
IS International Standards
ISO International Organization for Standardization
MEPT MEtrology Project Team
MFC Microsoft Foundation Classes
MMC Maximum Material Condition
NIST National Institute of Standards and Technology NURBS Non-Uniform Rotational B-Spline
OMM On-machine Measurement
PLM Product Lifecycle Management
PMI Product Manufacturing Information
POM Probe Orientation Module
QMD Quality Measurement Data
RDS Rapid Design System
SC Sub-Committee
SDAI STEP Data Access Interface
STEP STandards for Exchange of Product data
List of Abbreviations
STL STereo Lithography
TC Technical Committee
TSP Travelling Sales Person
UOF Units of Function
VGM Virtual Gear Model
VRML Virtual Reality Model Language
Table of Content
Table of Content
Abstract ... i
Acknowledgements...iii
List of Abbreviations... v
Table of Content ...viii
List of Figures ...xiii
List of Tables...xviii
Chapter 1 Introduction... 1
1.1. Closed-loop Manufacturing ... 2
1.2. Process Variations and Error Resources... 6
1.3. In-process Measurement... 9
1.4. Measurement Sensors... 13
1.5. Information and Data Model for In-process Measurement ... 15
1.6. Recap... 16
1.7. Thesis Organization... 16
Chapter 2 Literature Review ... 19
2.1. Review on CAIPP Systems... 20
2.1.1. Early Research (Prior to 1995) on CAIPP... 21
2.1.1.1. Tolerance-driven CAIPP Systems ... 21
2.1.1.2. Geometry-based CAIPP Systems... 25
2.1.2. Recent CAIPP Research for OMM and CMM... 26
Table of Content
2.1.2.2. Measurement/Sampling Points Selection and Optimization ... 30
2.1.2.3. Probing Path Planning and Generation... 33
2.1.3. Review of CAIPP Systems for OMM ... 35
2.2. Recap of CAIPP Review... 40
2.3. Dimensional Metrology Interoperability Issues... 45
2.3.1. Product Definition ... 47
2.3.2. Measurement Process Definition... 48
2.3.3. Measurement Process Execution ... 50
2.3.4. Analysis and Report ... 51
2.3.5. Crosscutting Interoperability Issues in Dimensional Metrology Systems ... 53
2.3.6. Recap of Dimensional Metrology Interoperability Issues... 54
2.4. Recap... 56
Chapter 3 STEP and STEP-NC ... 58
3.1. A Snapshot of STEP ... 58
3.1.1. Overview of STEP... 58
3.1.2. History of STEP ... 59
3.1.3. Objectives of STEP ... 61
3.2. Structure and Technical Details of STEP... 61
3.2.1. Description Methods ... 63
3.2.2. STEP Implementation Methods ... 65
3.2.3. Part 21 Physical File Implementation Method ... 66
3.2.4. STEP Data Access Interface... 67
3.2.5. XML Files ... 69
3.2.6. Application Protocols ... 69
3.2.6.1. Application Activity Model ... 69
3.2.6.2. Application Reference Model ... 70
3.2.6.3. Application Interpreted Model ... 71
3.2.6.4. Other Documentation Strategies of AP ... 71
3.2.7. STEP Integrated Resources ... 72
Table of Content
3.3.1. Information Content and Structure ... 74
3.3.2. ARM vs. AIM in STEP-NC ... 78
3.4. Recap... 79
Chapter 4 Proposed STEP Data Model ... 81
4.1. STEP/STEP-NC Related Research on CAIPP and Standard Development... 81
4.1.1. Overview of STEP/STEP-NC Related CAIPP Research ... 82
4.1.2. CAIPP Related STEP/STEP-NC Standard Development ... 85
4.2. Proposed STEP ARM Data Model for Integrated CNC Machining and Inspection ... 87
4.2.1. AAM Model of Integrated Machining and In-process Measurement Process Planning System ... 87
4.2.2. Proposed STEP Application Protocol ARM Data Model for Integrated CNC Machining and Inspection ... 93
4.2.3. GD&T Data Definitions ... 102
4.2.4. Measurement Technological Information Definitions ... 111
4.3. Recap... 113
Chapter 5 Proposed Integrated Process Planning System... 114
5.1. Integrated Process Planning and Feedback System... 117
5.2. Measurement Geometry Selection/Creation System... 119
5.2.1. Tolerance Filter ... 119
5.2.2. Measurement Geometry Decision Rules ... 121
5.2.2.1. Form Tolerances ... 128
5.2.2.2. Orientation Tolerances... 128
5.2.2.3. Location Tolerances ... 129
5.3. Workingstep Re-sequencing ... 134
5.4. Micro Inspection Process Planning... 136
5.4.1. Measurement Points Generation and Distribution ... 136
5.4.2. Feature Interaction Detection ... 140
Table of Content
5.5. Measurement Result Analysis and Feedback ... 146
5.5.1. Data Fitting Algorithms... 147
5.5.1.1. Mathematical Representation of Geometric Elements ... 147
5.5.1.2. Data Fitting Criteria ... 149
5.5.2. Tolerance Zone Analysis and Feedback Update ... 152
5.6. Recap... 154
Chapter 6 System Implementation and Case Studies... 156
6.1. Software Development Environment and Tools ... 156
6.1.1. Microsoft Visual Studio and Microsoft Foundation Class® ... 157
6.1.2. ST-Developer™... 157
6.1.3. Open CASCADE®... 161
6.1.4. GNU Scientific Library ... 163
6.2. STEP-INSPEC Software Prototype ... 163
6.2.1. Implementation Environmental Setting... 164
6.2.2. STEP-INSPEC Software ... 166
6.2.3. STEP-INSPEC Software Information Flow... 169
6.3. Case Studies... 172
6.3.1. Case Study 1 ... 173
6.3.2. Cast Study 2... 178
6.4. Recap... 183
Chapter 7 Conclusions and Future Work... 185
References ... 192
Appendix A
EXPRESS-G Diagram of Proposed Data Model ... 204
Appendix B
STEP-NC programs ... 208
Appendix B.1 ISO 14649 Part 11 Example 1... 209
Table of Content
Appendix C
STEP-INSPEC Software Output Files... 221
Appendix C.1 CMC Output of Fish-head Roughing Example ... 222
Appendix C.2 G-code Output ... 234
Appendix C.3 Newly Generated STEP Part 21 File ... 245
Appendix D
Abstracts of Research Publications ... 254
Appendix D.1 Journal Publication (6-1) ... 256
Appendix D.2 Journal Publication (6-2) ... 257
Appendix D.3 Journal Publication (6-3) ... 258
Appendix D.4 Journal Publication (6-4) ... 259
Appendix D.5 Journal Publication (6-5) ... 260
Appendix D.6 Journal Publication (6-6) ... 261
Appendix D.7 Conference Publication (2-1) ... 262
List of Figures
List of Figures
Figure 1: Elements of CLM... 3
Figure 2: Six error elements in linear axis motions... 8
Figure 3: Concept of in-process measurement ... 10
Figure 4: Sensor application versus level of precision and error control parameters [19].. 14
Figure 5: An expert inspection planning system model [25] ... 22
Figure 6: An inspection control hierarchy... 23
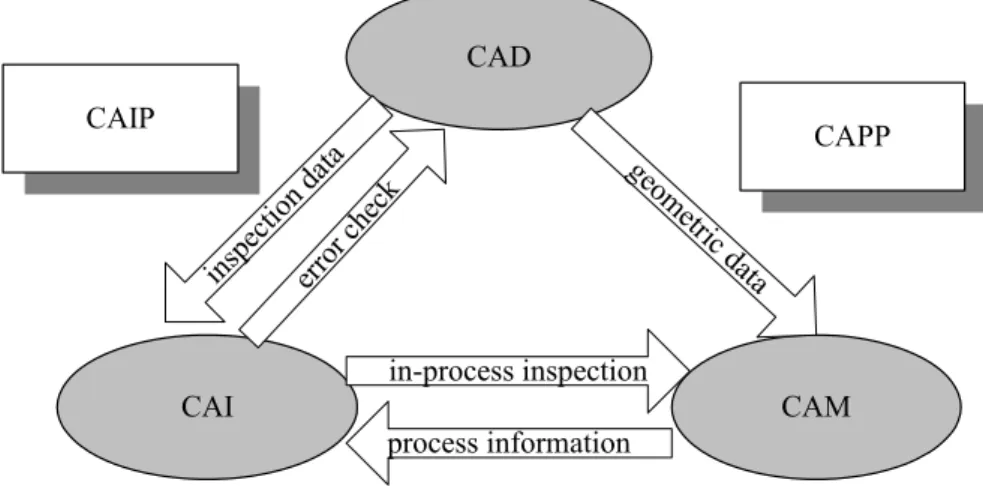
Figure 7: The role of CAIP and the inter-relations between CAD/CAI/CAM... 25
Figure 8: Flowchart of the feature-based inspection process planning system ... 28
Figure 9: CATIP system structure [53] ... 29
Figure 10: Flowchart of the collision free probing path generation ... 34
Figure 11: CAIPP system using (a) CMM and (b) OMM... 36
Figure 12: Framework of GCAPPSS ... 37
Figure 13: The overall schematic structure of OMM process planning ... 39
Figure 14: IDEF0 model of dimensional metrology system ... 42
Figure 15: IDEF0 diagram of measurement process definition activity ... 43
Figure 16: Interoperability barriers between dimensional metrology commercial software systems ... 45
Figure 17: Current-state dimensional metrology interoperability issues ... 46
Figure 18: The current metrology interoperability standard landscape [83] ... 54
Figure 19: Future vision of dimensional metrology system ... 55
List of Figures
Figure 21: Structure of the STEP standard [20] ... 62
Figure 22: An example of EXPRESS schema... 64
Figure 23: An example of EXPRESS-G diagram ... 66
Figure 24: An example of Part 21 file ... 68
Figure 25: An AAM for digital manufacturing [21]... 70
Figure 26: Design – manufacturing chain enabled by STEP-NC... 73
Figure 27: Comparison of G&M code and STEP-NC data ... 75
Figure 28: Structure of the STEP-NC data model [21] ... 76
Figure 29: Structure of a STEP-NC program ... 77
Figure 30: Relationships between ISO 14649 and STEP APs [125]... 79
Figure 31: Prototype implementation of the STEP-NC enabled CLM [129]... 83
Figure 32: Research on STEP/STEP-NC enabled inspection systems (2001-2008)... 86
Figure 33: A0 level AAM model for the integrated process planning system ... 88
Figure 34: A0 activities in the integrated process planning AAM model ... 89
Figure 35: A1 activities in the integrated process planning AAM model ... 90
Figure 36: A11 activities in the integrated process planning AAM model ... 91
Figure 37: A12 activities in the integrated process planning AAM model ... 92
Figure 38: A2 activities in the integrated process planning AAM model ... 93
Figure 39: Information defined in ISO 14649 Parts 10, 11, 12, 111, and 121 ... 95
Figure 40: Dimensional measurement related information definitions ... 98
Figure 41: EXPRESS-G diagram of dimensional measurement features ... 100
Figure 42: GD&T definitions in the proposed data model... 104
Figure 43: Datum information definitions... 106
List of Figures
Figure 45: Illustration of feature and toleranced_geomtry... 108
Figure 46: Toleranced geometry definitions ... 109
Figure 47: Illustration of value_qualifier attribute ... 110
Figure 48: Measurement result and measurement strategy definitions ... 112
Figure 49: Measurement technology and measurement machine function definitions ... 112
Figure 50: Proposed STEP-based CLM system architecture ... 115
Figure 51: Proposed integrated process planning system framework ... 118
Figure 52: Machine accuracy information... 120
Figure 53: Form deviation, orientational deviation, and locational deviation... 125
Figure 54: Information linkage between machining, tolerance, and features ... 126
Figure 55: Difference between a machining feature and a measurement geometry ... 126
Figure 56: Parallelism tolerance of a cylinder axis ... 127
Figure 57: Positional tolerancing for symmetrical features ... 130
Figure 58: Symmetry tolerancing for symmetrical features... 130
Figure 59: Measurement geometry decision making algorithm... 132
Figure 60: Measurement geometry selection algorithm ... 133
Figure 61: Distribution of points on rectangular plane... 138
Figure 62: A distribution of points on a cylinder ... 139
Figure 63: Round hole defined in STEP-NC standard [118] ... 140
Figure 64: Illustration of feature interaction ... 141
Figure 65: Feature interaction detection zones for closed pocket feature ... 143
Figure 66: Feature interaction zones for step feature ... 143
Figure 67: Feature interaction detection algorithm flowchart for closed pocket feature .. 144
List of Figures
Figure 69: ST-Developer™ architecture ... 158
Figure 70: Compiling EXPRESS source for use in application program... 159
Figure 71: Converting STEP EXPRESS schema into C++ classes and ROSE schema files ... 160
Figure 72: Open CASCADE® software platform structure... 161
Figure 73: STEP-INSPEC software library and additional directory setup ... 165
Figure 74: STEP-INSPEC input interface ... 166
Figure 75: STEP-INSPEC software input and output interface ... 167
Figure 76: STEP-INSPEC system outputs and tree-view ... 168
Figure 77: Four elements of STEP-INSPEC software system and their program files... 170
Figure 78: STEP-INSPEC software prototype system flowchart... 171
Figure 79: ISO 14649 Part 11 Example 1... 173
Figure 80: Dimensions and tolerances of the example... 174
Figure 81: Case study software output ... 175
Figure 82: Machining and inspection workingsteps combined ... 176
Figure 83: Machined workpiece of Example 1 ... 178
Figure 84: Second case study workpiece and its machining_workingsteps... 179
Figure 85: Second case study drawing ... 180
Figure 86: STEP-INSPEC software output for the second case study ... 182
Figure 87: Machined workpiece of the second case study ... 183
Figure 88: EXPRESS-G diagram of proposed GD&T, datum, and toleranced geometry definitions. ... 205
Figure 89: EXPRESS-G diagram of proposed measurement workingstep, operation, technology, strategy, machine function, result definitions... 206
List of Figures
Figure 90: EXPRESS-G diagram of proposed dimensional measurement feature definitions
... 207
Figure 91: ISO 14649 Part 11 Example 1... 209
List of Tables
List of Tables
Table 1: Types of measurement and their properties [11]... 4
Table 2: Summary of research on measurement points sampling ... 31
Table 3: Machine tool database used in the case study ... 121
Table 4: Symbols for geometric characteristics ... 123
Table 5: Minimum number of measurement points on each basic features [143] ... 137
Chapter 1 – Introduction
Chapter 1 Introduction
Manufacturing operations are driven by cost requirements that relate to the value of a particular product to the marketplace. Given this selling price, the system works backwards to determine what resources can be allocated to the manufacturing portion of the cost equation. Then, production personnel set up the necessary resources and provide the workpieces that are consumed by the market. Everyone is happy until something changes. Unfortunately, the time constant associated with change in the manufacturing world has become very short. Requirements often change even before a system begins producing parts, and even after production is underway there are typically many sources of variability that impact on the cost/quality of the operation. Variability associated with scheduling changes are to be accommodated by designing flexibility into the basic manufacturing systems. However, the variability that is related to changing process conditions are best handled by altering system performance at a more basic level.
Error conditions often occur where one or more process parameters deviates significantly from the expected value and the process quality degrades. The sensitivity of the process to these variations in operation conditions depends on the point in the overall manufacturing cycle at which they occur as well as the specific characteristics of a particular process disturbance. Amplitude, a frequency of occurrence, and a direction typically characterize these process errors [8, 9]. In a machining operation, the typical result is a lack of synchronization between the tool and part locations so that erroneous dimensions are produced.
Over time, the amplitude of process errors is typically limited to a specific range either by their inherent nature or by the operator’s actions. For example, shop temperature profiles tend to follow a specific pattern related to cutting forces, and cutting tools are replaced as they wear out. As multiple process error sources interact, the result is typically a seemingly random distribution of performance characteristics with a given “normal range” that defines the routine tolerances achievable within a given set of operations. On the other
Chapter 1 – Introduction
hand, trends such as increased operating temperatures due to a heavy workload, coolant degradation, and machine tool component wear, have a non-random pattern that continue over time until an adjustment is made [8].
One solution to the problem of process variation is to build a system that is insensitive to all disturbances; unfortunately, this is rarely practical. A more realistic approach is to use a manufacturing model that defines the appropriate response to a particular process parameter change. This technique can be very successful if the necessary monitoring systems are in place to measure what is really happening within the various manufacturing operations. This approach works because manufacturing processes are deterministic in nature: a cause-and-effect relationship exists between the output of the process and the process parameters [8]. Events occur due to specific causes, not random chance, even though an observer may not recognize the driving force behind a particular action. If the key process characteristics are maintained at a steady-state level, then the process output will also remain relatively constant. Conversely, when the process parameters change significantly, the end product is also affected in a noticeable manner. By measuring the important process parameters in real time and performing appropriate adjustments in the system commands, great improvements can be achieved in increasing product quality and lowering production costs [9]. Closed-Loop Manufacturing (CLM) as such a method is widely employed in modern industry.
1.1. Closed-loop Manufacturing
Closed-loop manufacturing is a method for optimizing the efficiency of a manufacturing process. It involves the use of measurement technology (metrology), most often touch sensor probes, to determine actual part dimensions as well as coordinates of machine tool characteristics [10]. The elements of CLM are comprised of reliable machines, robust processes, automatic data collection, continuous improvement, and efficient and accurate analysis. Each element is supported by various methods which when combined deliver a complete closed-loop solution. The CLM cycles consist of measurement, data collection, data analysis, and process adjustment. Figure 1 illustrates these elements and the cycle of CLM.
Chapter 1 – Introduction Co nti nu ou s I mp rov em en t R o b u s t P ro c e s s e s Figure 1: Elements of CLM
The loop is closed when the measurements are controlled and when they are utilized to improve the manufacturing process. The data that is collected during the measurements is the basis for various kinds of optimization loops targeting different aspects of manufacturing process. This data is not only used and applied within the machine’s control when adjusting offsets, but also utilized by engineers who analyze the process data over time to evaluate retargeting of dimensions, to modify tolerance requirements or to use the gained knowledge to better design parts for their producability. The benefits of utilizing CLM for manufacturing processes can be summarized as follows:
1) improving the reliability of the machine, 2) providing a more controlled environment,
3) lessening the human error involved with offset modification,
4) providing assurance of an acceptable accuracy level of the machinery, and 5) providing automate workpiece setup and tool setup.
Chapter 1 – Introduction
Using the measurement of workpiece as a check on the CLM process is well established but there are a number of issues as to where to measure, what to measure and when to measure. There are three types of measurement in manufacturing processes listed as follows, all of which can be used to provide measurement data for CLM processes. These types of measurement and their properties are also summarized in Table 1 [11].
Table 1: Types of measurement and their properties [11]
Where? In-process In situ Remote
What type of measurement? Dynamic Static Integrated
Type of control Adaptive control Statistical control
Long-term traceability
Information obtained Very specific Medium Comprehensive surface geometry
Information required Process control Process monitor Machine tool monitor
Speed Very fast
Few/No operator intervention
Time to record and judge
Functional judgment
Outcome Working shift
controlled Quality of conformance assured Quality of design assured 1) In-process measurement
i) with On-Machine Measurement (OMM), which takes place as the workpiece is being made.
ii) with portable measurement, where the workpiece surface is tested when the part has been made but not relocated. The surface instrument, which is hand-held, has somehow to be perched on the part when the machining has stopped and then the measurement recorded.
Chapter 1 – Introduction
2) In situ measurement
The workpiece is removed from the machine and measured with an instrument located near the machine tool.
3) Remote measurement
The workpiece is taken to a properly equipped inspection room to be inspected on a Coordinate Measuring Machine (CMM).
Different types of CLM systems utilize different measurement operations to collect data. There are three types of CLM loops in a manufacturing system.
1) Process Control Loop
An immediate closed loop exists between the machine tool and the measuring system. The CNC program takes measurements instantly after one machining operation, compares the results to tolerance limits and adjusts offsets to compensate for the deviation between the actual and the desired state. In-process measurement is commonly employed for this type of closed-loop.
2) Process Improvement Loop
The process improvement loop is neither automated nor instant after machining but depends on the manufacturing engineer evaluating the process. Part dimensional data that was collected from the manufacturing process over a period of time provides an understanding of how well the process repeats and how accurate it is. In situ measurements are commonly used for this type of closed-loop, however, in-process measurement data is also considered for evaluation.
3) Design-for-Manufacturability Loop
If interpreted from a design engineering perspective, process data can tell how well and how easy certain features can be produced. A dissatisfying process capability causes scrap, rework, and repair. Some part features are easier to machine than others. The
Chapter 1 – Introduction
design-for-manufacturability loop suggests that the design engineer analyses manufacturing process data to consider the degree of difficulty in producing one feature over another. Providing that fit, form and function of the feature are not compromised, the feature offering the better manufacturability may be preferred. Obviously, other considerations such as assemblability and cost influence should be considered by design engineers as well. In this type of closed loop, remote measurements are commonly used. Data collected through in-process measurement and in situ measurement is also utilized for analysis for this type of closed-loop.
Among the above three types of CLM systems, process control loop is the most important one and is of primary consideration of this research. Only when a manufacturing system is adaptive and stable enough, can it provide high quality parts for the rapidly changing modern manufacturing industry. An important goal of the manufacturing system with a process control loop is to reduce process variability and bias to as small a level as is economically justifiable. Process bias is the difference between a parameter’s average value and its designed value. Bias errors are a steady-state deviation from an intended target and while they do cause unacceptable produce, they can be dealt with through calibration procedures. On the other hand, process variability is a continuously changing phenomenon that is caused by alterations in one or more manufacturing process parameters. It is inherently unpredictable and therefore more difficult to accommodate. However, the real-time process parameter measurements in CLM can provide the information needed to deal with unexpected excursions in manufacturing systems. The concept of conventional CLM is not a complex concept, however, the collection of the necessary process data can be a challenge. To decide when and where to conduct in-process measurement for collecting necessary in-process data, it is important to understand common process variation and error resources in manufacturing systems.
1.2. Process Variations and Error Resources
Process variability hinders the efforts of system operators to control the quality and cost of manufacturing operations. This basic manufacturing characteristic is caused by the inability of a manufacturing system to do the same thing at all times and under all conditions. Machining operations typically exhibit a much higher degree of process
Chapter 1 – Introduction
control. However, variability is still present in relatively simple operations such as attempting to control a feature’s diameter and surface finish without maintaining a constant depth of cut, coolant condition, temperature, tooling quality, etc. Inspecting parts and monitoring the value or various process parameters under different operating conditions helps collect process variability data. However, the following questions must be answered before qualifying the process variability: what parameters can and should be measured; when should measurement take place; how much variation is acceptable; is bias a problem (it is usually a calibration issue); what supporting inspection data is required; and does the process model accurately predict the system operation? In industry, Error Budges (EB) method [9] is commonly used to answer most of these questions. It categorizes system errors and understands the impact of altering the magnitudes of the various errors, and selecting a viable approach for meeting the desired performance goals. After the EB procedure, a system error model is obtained by conducting a series of experiments through which a relationship is established between individual process parameters and the quality of the workpiece. Once the system error model has been validated, a reliable assessment can be made of the impact of reducing, eliminating, or applying a suitable compensation technique to the different error components.
Process parameter information can be used to monitor the condition of a manufacturing operation as well as provide a process control signal to a feedback algorithm. If any of the key process parameter deviates, an error is known to have occurred. The error can come from two sources: machine accuracy related and tooling accuracy related. Machine accuracy can be described in a generic term that is how accurate the tool path can be. In general, this characteristic is influenced by two categories of error: quasi-static error and dynamic error. Quasi-static errors are process disturbances that change relatively slowly and have long time constants. The result of this type of system error is usually observed as the degradation of part form due to the inaccurate positioning of the tool with respect to the workpiece. Quasi-static errors are related to machine structure and design (the geometry and kinematics of the machine) and normally caused by slowly varying forces that act on the machine and thermally induced strains in the machine tool. Dynamic errors are related to a machine’s servo system, such as vibration, spindle errors, axes motion errors, etc. This type of error occurs in relatively high frequency and in short time constants. It is associated
Chapter 1 – Introduction
with the travel of a machine’s moving elements and can be discussed in relation to typical machine axes (Figure 2). With the type of linear carriage shown in Figure 2, it is possible to measure six individual error elements due to the six degrees of freedom. The result of this type of error can be observed in many forms, such as the dimensional or geometric errors on the workpiece. These errors are normally the combination of these six error elements.
Y axis of vertical straightness
Z axis of horizontal straightness
X axis of linear straightness Yaw pitch
Roll Carriage
Figure 2: Six error elements in linear axis motions
Tooling accuracy related errors can also be categorized in two groups: workpiece fixturing and cutting tool errors. Workpiece fixturing error is mostly caused by wrong clamping force, which makes the workpiece deform. Cutting tool errors are mostly caused by misalignment between cutter and machine axis and errors in the shape of the cutting tool. For example, the misalignment between cutter and machine axis causes the “high point” of the cutter is wrongly projected in tool path. The errors in the cutting tool shape result in the workpiece is machined without maintaining a constant contact point between the workpiece and the cutter.
Once a correct manufacturing system error model is established, key process parameters can be identified. Constant monitoring of these key parameters and their error occurrences enables correct compensation or adjustments to the control of manufacturing processes. Therefore, a stable and accurate manufacturing system is achievable. For example, if errors due to component deflection, machine geometry, etc. are relatively constant, then tool
Chapter 1 – Introduction
offsets based on the condition of the cutting tool can improve the system performance. However, if adjustments are made based on historical data rather than immediate monitoring, then the system is vulnerable to unexpected changes in factors such as tool performance, material characteristics, operator induced changes in feeds and speeds. Offsets that are based on product certification results are a little better, since there is a closer tie with the “current process”, but the delay between production and inspection can still cause difficulties. In-process measurements offer the best alternative as long as the time required to collect data is not an unacceptable cost to production operations. In order to be useful, in-process measurement data must be easily obtained; the prediction of system performance must be accurate and useful to the process operator.
Apart from improving the accuracy and consistency of manufacturing operations, in-process measurements of critical parameters can be used to provide real-time assurance that the workpiece quality is being maintained at the desired level. This usage of in-process measurement with OMM is the primary focus of this research. Aside from the obvious step of measuring one or more critical dimensions on a finished workpiece, additional process data can be collected to qualify the process before the part is removed from the machine tool. The data collected through in-process measurement can also be used to analyze the process consistency, the deflection/size errors, and tool wear errors. Therefore, compared with the other two types of CLM measurements mentioned above, in-process measurement has the advantages of providing direct, continuous, real-time measurements of those part attributes that are defined in the acceptance-tolerance criteria for the workpiece.
1.3. In-process Measurement
Inspection, including dimensional inspection, has commonly been an activity performed after, rather than during, a manufacturing step or process. In many instances, several steps may have been performed before a part is measured. If the part is found to deviate from the specified tolerances, it must either be rejected at a point where considerable value has been added or be reworked. In either case, the manufactured cost has been boosted. As aforementioned, in-process measurement is significant in that it ultimately allows a manufacturer to achieve a goal of zero scrap (i.e. the “first part correct” paradigm), since deviations in the manufacturing process measured by sensors can be used in a corrective
Chapter 1 – Introduction
manner to control the process before tolerances are exceeded. Advances in sensor technology and digital computers and controllers are permitting a dramatic increase in the application of in-process measurement and control.
The concept of in-process measurement and control has to do with (a) measuring a process variable while that variable can still be influenced and (b) applying a corrective feedback to the machine that affects the process so as to encompass those sources of error that normally occur during the process and thus eliminate error from the variable on the resultant workpiece. Figure 3 illustrates the basic concept of in-process measurement.
Process Raw Material Machine Tool (Workstation) Final Workpiece Measurement Instruments Control Machine Tool Control Design Data (Theoretical Dimensional Data)
Actual Dimensional Data
Compensation Control
Figure 3: Concept of in-process measurement
In order to produce a workpiece, raw material is required, equipment such as a machine tool is needed to effect the process, and something to describe quantitatively the amount of material to be removed – the design drawing or data from the design – is required. During machining process, OMM instruments or portable measurement instruments provide a continuous measurement that can be in the form of an analog signal or a digital data work, which is compared with the required dimension derived from the part design. The result of the comparison is a compensatory signal which is applied to the machine control so as to
Chapter 1 – Introduction
restore the dimension within its allowable range on either the part being machined or subsequent parts.
The use of limited in-process measurement coupled with the monitoring of the key process parameters of manufacturing process as a substitute for extensive postprocess inspection is becoming more realistic and attractive in achieving fully automated manufacturing process [9]. The two types of measuring devices commonly used in in-process measurement (introduced in Section 1.1) are OMM and portable measuring devices. Compared with portable measuring devices, OMM has been gradually used as the preferred measuring equipment for the purpose of direct inspections in manufacturing and quality control, which is a vital feature for an automated production system. In-process measurement with OMM operations is a process that integrates the design, machining, and inspection aspects of manufacturing to allow a product to be inspected and accepted directly on a machine tool. This process is accomplished by using the machine tool as the inspection device while the part is secured on the machining centre with its coordinate system intact. Using the machine tool as an inspection device eliminates the need for expensive inspection equipment, allowing the manufacturer to divert resources to other uses. There is no need for inspection fixture either, because the machine tool part fixture serves as the inspection fixture. As the workpiece gets more complicated, the role of OMM becomes more significant as efficient dimensional measuring equipment [12]. Sensors present in a CNC system have the capability of providing accurate feedback for the different drive/motors. They are often limited to just perform these functionalities and not geared toward supporting those inspection tasks which are effectively what OMM is about. The advantages of employing OMM for in-process measurement are summarized as follows [13-17].
1) Cost and time saving through
(i) reducing lead-time required for gages and fixtures,
(ii) minimizing need for design, fabrication, maintenance of hard gages, fixtures & equipment,
(iii) reducing inspection queue time and inspection time, and (iv) eliminating rework of nonconforming product.
Chapter 1 – Introduction
2) Changing from “reactive” inspection to “proactive” control by
(i) integrating quality control into product realization process,
(ii) using characterized and qualified processes to increase product reliability, (iii) focusing resources on prevention of defects instead of detection in the end
(a post-mortem process),
(iv) utilizing real-time process knowledge and control, and part acceptance/disposition, and
(v) enhancing small lot acceptance capability.
3) Elimination of non-value added operations such as lot inspection, sampling plans, receiving inspection, design, fabrication and maintenance of hard gages, and reworking nonconforming parts;
4) Agile machining.
OMM enables quick responses to product design changes. Since inspection operations are carried out on the same machining centre, inspection gages and fixture changes are not required. New and existing technologies such as probing strategy, error compensation, data analysis software and fixture design technology can be integrated into the OMM system. As errors occurring during machining processes are detected and recorded as they appear, part distortion can be “corrected” promptly by adjusting the subsequent machining operations.
Therefore, in-process measurement with OMM operations presents a promising solution toward improving manufacturing processes; it is the main focus of this research. A question might be raised as to the validity of dimensional measurement on the same machine that makes the part. While measurements performed by a cutting machine are subject to some of the same error producing factors as the cutting progress, the errors that are most difficult to eliminate through machine maintenance and certification can easily be detected and accounted for with in-process measurement. For example, machine flexing, tool wear, and vibration will all be absent during measurement. Additional error compensation techniques such as laser measurement, ball-screw compensation, and measuring pre-cut proofing parts for future reference can also be applied to compensate for
Chapter 1 – Introduction
other machine inaccuracies. The ability to rectify manufacturing errors caused by problems such as these has led to the acceptance of in-process measurement as part of a manufacturing system [18]. Apart from the concern of OMM accuracy, a traditional objection to OMM is that it diverts machine time away from actual machining. This notion can be overcome by measuring productivity in terms of total in-process time rather than machining cycle time. The view that OMM steals machining time overlooks the fact that checking a part off-line, a step that OMM seeks to replace, can impose the need for additional part handling and another setup; this adds to in-process time, as well as introducing the potential of fixture errors [13].
1.4. Measurement Sensors
Although the advantages of in-process measurement are obvious, it is not a trivial task to accomplish in manufacturing processes. The main reason for this is attributed to assorted physical constraints such as the presence of chips or coolant which obscure a location that needs to be inspected. Therefore, selecting proper measurement sensors is essential. Sensors in manufacturing are usually involved in three generic types of monitoring applications [19]. They are for
1) production monitoring where transducers are utilized to determine the status of operations on the production floor,
2) machine monitoring that involves determination of whether or not a process is functioning properly (an early warning of the need for preventive maintenance or process adjustments is the objective of these measurements), and
3) environmental monitoring where sensors provide information concerning the condition of an area. A common location for the installation of these censors is in the heating, ventilation and air conditioning system.
As might be expected, each of these broad categories overlaps with the others to a certain extent. The sensors used for in-process measurement belong to the second category – machine monitoring sensors. These sensors can be categorized into numerous different types. The most commonly used sensors in the industrial manufacturing environment are for measuring force, power, and acoustic emission, such as touch trigger probes and dial
Chapter 1 – Introduction
gages. Different types of sensors can achieve different levels of accuracy. Figure 4 summarizes the level of precision that each types of sensor can achieve, and the parameters these sensors are used to control.
Figure 4: Sensor application versus level of precision and error control parameters [19]
Since in-process measurement on workpiece acceptance (form and dimension) with OMM operations is the primary focus of this research, force meter sensors are more suitable than other types of sensors. Considering the real-time manufacturing environment, the chosen force meter sensors should be able to resist the moisture environment (caused by coolant) and sharp edges (generated by chips). Touch trigger probe, as such a sensor, is chosen for this research to conduct measurements.
Chapter 1 – Introduction
1.5. Information and Data Model for In-process Measurement
The advantages of using in-process measurement with OMM operations to monitor machining process and workpiece dimensions in real-time are discussed in the above sections. However, where and when to carry out OMM operation still remains a problem. In order to have optimal OMM operations for in-process measurement, sufficient product related information together with a knowledge base is needed for carrying out process planning. This information includes
Ü design information or product definition information, such as design features and tolerance requirements,
Ü machine accuracy information from a machine tool database or knowledge accumulated at shop-floor,
Ü process planning information, such as machining operation sequence, and
Ü measurement device related information, such as sensor dimension and data collection type.
Only when all this information is provided for the process planning system can an efficient and optimal in-process measurement process be planned for a chosen machine environment or a machining process. In industry, many commercialised software tools are used for different manufacturing activities. For example, Pro/E and CATIA are the software for designing a product, MasterCAM and SolidCAM are for machining process planning, Metrolog and PC DMIS are for inspection process planning. Each of these software tools has its own proprietary data format. A complete in-process measurement process planning system often needs data from the design and process planning stage, and the data is input to inspection process planning software to generate a proper in-process measurement plan. The proprietary data format hinders smooth information exchange between these software tools or process planning systems. Tedious interpretation between different data format is time-consuming and expensive. With a more decentralised manufacturing industry, the desire for a consolidated data model that can be exchanged freely between different manufacturing activities is inevitable. This kind of data model will also enable the integration of in-process measurement with machining process planning, thus making in-process measurement process planning more efficient and accurate.
Chapter 1 – Introduction
1.6. Recap
Recognizing the deterministic nature of manufacturing operations paves the road for improvements in product quality and reduction of production costs. This is accomplished by measuring the important process parameters and by performing appropriate adjustments in the system commands; through this a CLM system is formed. The elements necessary to form an efficient CLM system are an operational strategy or model that establishes acceptable limits of variability and the appropriate response when these conditions are exceeded, a means of measuring change within the process, plus a mechanism for inputting the necessary corrective response. Three types of measurements exist in CLM systems serving three types of closed-loop in the manufacturing systems. Compared with in situ measurement and remote measurement, in-process measurement, commonly used for process control loop, has the benefits of being able to monitor manufacturing process in real time when a significant alteration has occurred within a manufacturing cycle. In-process measurement can be used in two ways: In-process control (monitor key In-process parameters) and process qualification (monitor workpiece form/dimension acceptance). The data collected in both practices can be used in statistical analysis to improve manufacturing processes.
To facilitate process planning for in-process measurement with OMM operations and to utilize the measurement data more efficiently, the input data must provide explicit and complete representation of product data such as workpiece features and tolerance requirements. Only based on this substantial product design information can the machining and inspection features be identified, and associated machining and measurement operations be sequenced in an optimal order. Therefore, a consolidated data model including product definition information, machining process planning information, machine tool and measurement sensor information is a necessity.
1.7. Thesis Organization
This research focuses on developing an automated in-process measurement system with OMM operations to monitor workpiece geometric and dimensional characteristics during machining processes. Measurement data is analysed right after inspection and update value
Chapter 1 – Introduction
is fed back to the following machining operation for necessary corrections. Among all types of measuring sensors, touch trigger probe is chosen for the measurement operations.
Chapter 2 gives a thorough review of Computer-aided Inspection Process Planning (CAIPP) from the mid 1980s to recent years. It identifies the research trends in CAIPP research and function modules which a complete CAIPP system should consist of. The review reveals problems in the current CAIPP systems. Following the review is an investigation of dimensional metrology interoperability issues, which stems from the same reason that leads to the problems in CAIPP systems.
Chapter 3 gives a detailed account of new ISO (International Organization for Standardization) standards ISO 10303 (STEP) [20] and ISO 14649 (STEP-NC) [21] standards. It starts with an overview, history, and objectives of STEP. This is followed by a description of various Parts and the technical content of STEP and STEP-NC.
In Chapter 4, a review of research on STEP/STEP-NC related CAIPP and STEP/STEP-NC standard development is discussed. Then, the proposed STEP Application Protocol ARM data model for integrated CNC machining and inspection is described in detail.
In Chapter 5, the framework of the proposed integrated process planning system is presented. Itt consists of three main sub-systems: a macro process planning system that identifies critical GD&T requirements, selects measurement geometry, and inserts new in-process measurement operations in-between machining operations; a micro in-process planning system that generates measurement points for each measurement operation; a measurement result analysis and feedback update system that provides real-time feedback to the subsequent machining operations based on measurement result analysis.
Chapter 6 describes the implementation of the proposed system. A STEP-INSPEC software prototype was developed. The algorithms developed and implemented in the software prototype are discussed in detail. This is followed by the introduction of the case studies that are used to test the proposed STEP Application Protocol ARM data model for integrated CNC machining and inspection and the STEP-INSPEC software.
Chapter 1 – Introduction
Chapter 7 gives an in-depth discussion of the proposed data model and the integrated process planning system summarizing their advantages and benefits. Then, conclusions are drawn for the research. This chapter ends with suggestions for future research directions and recommendations.
There are two Appendices at the end of the thesis. Appendix A contains EXPRESS-G diagram of proposed data model. Appendix B includes the STEP Part 21 files of the two case studies carried out in this research. Appendix C includes three output files generated from the STEP-INSPEC software prototype for the second case study. These files are the Canonical Machining Command (CMC) output, G-code output, and the new STEP Part 21 file. Appendix D includes the abstracts of 6 journal papers and 2 conference papers that the author has published/accepted.
Chapter 2 - Literature Review
Chapter 2 Literature Review
Inspection process planning is an integral part of design and manufacturing activities. It determines what characteristics of a product are to be inspected, where and when. As introduced in the previous chapter, in-process measurement is the focus of this research. It gives manufacturers the opportunity of controlling production and achieving the desired quality during manufacturing processes rather than being a means of acceptance or rejection at the end. To have efficient in-process measurement operations, fast yet accurate inspection as well as effective integration with the product model and relevant databases is required. With the fast growth of product complexity and variety and the constant demand of reducing product development cycle, industries are in search of more automated inspection process planning for measurement operations and better decision support tools.
In manufacturing processes, decisions made in the course of process planning have a significant effect on the resulting product quality, in addition to the production time and cost. Some manufacturing methods and sequences selected during process planning may be more prone to errors and inconsistencies due to a large number of setups or an improper choice of datum and references. Coupling manufacturing process planning with inspection process planning leads to closure of the desired quality assurance loop and, when taken in the wider context of concurrent engineering, will ensure that quality is “designed-in” from the start, and reduce costly rejected and/or reworked parts [22].
In a conventional quality control system, a workpiece machined on a machining centre requires being moved to a CMM to check its dimensional accuracy. The manual job set-up and inspection of machined parts are usually time consuming, subject to human errors, and often lead to longer lead times and the need to rework. The bottleneck problem is further compounded with the difficulty of capital investment and time delay of material flow between CMMs and machine tools in the factory.
Chapter 2 - Literature Review
Inspection process planning for CMMs has been a research focus for more than twenty five years. With increased accuracy and stability of CNC machine tools and more capable measuring devices, OMM has become widely accepted in industry. However, the inspection process planning for OMM operations are still lack of research attention. This chapter first reviews the CAIPP research for CMM, followed by the review of CAIPP for OMM operations. Then, the fundamental reason why CAIPP for OMM demands research – issues in dimensional metrology interoperability and standardization – is discussed.
The major part of this chapter has been reported in one published journal paper [2] and one journal paper in-press [5].
2.1. Review on CAIPP Systems
A CAIPP system may include automated or semi-automated modules capable of identifying and recognizing dimensional inspection features along with associated inspection constraints. It should be able to recommend an inspection method for each dimensional inspection feature. The resulting inspection operation also needs to be integrated into an overall inspection plan [23].
Automatic inspection planning for dimensional and geometric inspections can be at a high level or a low level. High-level (macro) planning is concerned with producing a collection of setups. Each set-up is related to accessibility of the features to be inspected, the probes to inspect each type of feature and the relative orientation of the part. Attempts are made to group the features, the types of tolerances and the type and size of probes to be used. Low-level (micro) planning primarily addresses the issuees of point selection, path generation, and generation of executable codes. Although much of the inspection carried out in industry continues to be conducted using conventional metrological equipment, most of the resent CAIPP systems are based on CMMs.
Research on CAIPP systems started in the early 1980s. Before the mid-1990s, most of the research work remained at the conceptual level (macro level) CAIPP systems [2]. These systems can be categorized into two groups:
Chapter 2 - Literature Review
1) tolerance-driven inspection process planning system, and 2) geometry-based inspection process planning system.
The research in the first category focused on planning inspections for those features that have specific tolerance requirements. The research in the second category focused on planning the inspection process to obtain a complete geometric description of a manufactured workpiece using the inspection data. Thus, comparison can be made with the design model for a complete geometry inspection.
From the middle of the 1990s, research on CAIPP systems started to shift to one or some of the modules that a typical CAIPP system has (the micro-level), such as sampling strategies and probing path planning strategies. At the same time, non-CMM measurement, such as 3D optical scanner, attracted more and more attention. Therefore, CAIPP system research for non-CMM measurement methods has become another major characteristic of the research trend during this period. The following sub-sections first review the research prior to 1995 in the two aforementioned categories respectively, followed by reviews on recent CAIPP research according to the modules that each research focused on.
2.1.1. Early Research (Prior to 1995) on CAIPP
Early research (prior to 1995) on CAIPP systems is reviewed in this section briefly. Only 2½D manufacturing features are considered. Free-form surface inspection is quite a different research area and is not the concern of this research. Interested readers are referred to a review by Li and Gu [24].
2.1.1.1. Tolerance-driven CAIPP Systems
One of the earliest CAIPP systems was developed by EIMaraghy and Gu [25]. It used a knowledge-based approach to generate inspection tasks. The system was developed in PROLOG and used a feature-oriented modelling approach. It took into account the characteristics of the CMMs, the function and geometry of the inspected part as well as the geometric and dimensioning standards and theories. It was the first system to group inspection features according to their datum, assign inspection priority based on the nature and magnitude of the assigned tolerance and check features accessibility in a given part
Chapter 2 - Literature Review
orientation. Figure 5 shows the planning logic which resulted in a recommended inspection feature sequence, probe selection and part orientation sequence. The system has a modular structure and features serve a key role.
Fixturing Module Non CMM Module Access Module Datum Module Measure Module Probe Module Tolerance Module Main Module Goal Input Expert Tolerancing Consultant Features Features Features
Figure 5: An expert inspection planning system model [25]
Helmy, H. A. [26] developed a feature recognition module that extracts the data of a component from its B-Rep geometric model, and then uses the data to generate a Dimensional Measuring Interface Standard (DMIS) [27] inspection program. Attributed Adjacency Graph (AAG) was used to group the inspection features. AAGs were introduced by Joshi and Chang [28] to enable machined feature recognition for machining process planning. The recognition approach includes procedures for each different manufacturing feature such as steps, slots and cylindrical holes. Using these recognition procedures, together with the AAG representation and a wireframe visualization interface, the features of a component to be inspected are selected interactively. The implementation of the system requires the user to enter the machine coordinated system, the number of measurement points required, and the tolerances to be measured.
Hopp and Lau K. C. [29] presented an approach using an inspection control hierarchy to generate control codes for CMMs (Figure 6). After the user selects the required tolerance from a Computer-aided Design (CAD) database, the scope of the inspection is determined and the characteristics of the tolerance are identified. The surfaces involved in the characteristics are then selected for inspection and probing. Next, probing points, path planning, machine motion, and servo commands are carried out sequentially. A CMM
Chapter 2 - Literature Review
inspection program is then generated. Some commercial systems such as Valisys [30] and Audimess [31] use a similar approach.
Tolerance Feature Surface Probing Points Paths Machine Motions Servo Control
Setup, Scope of inspection
Nominal points, probing points selection Measurable surface, probe secection Datum frames, features
Collision avoidance, speeds offsets Machine exis motion ambiguities, machine coordinates
Coordinate, axis motions
Figure 6: An inspection control hierarchy
Medland and Mullineux [32-34] tried to integrate a CMM with a manufacturing system. The inspection plan is created automatically from a feature-based model, which contains information about the features, their significance (i.e. importance of their dimensional accuracy for the acceptance of the part), the requirements on different probe types and orientations to reach the feature. The developed system is modular and based on a manufacturing network where communication is achieved through files exchanged within an integrated manufacturing environment. The measuring activities are controlled by a combination of dedicated programs and a constraint modelling system.
The system developed by Merat et al. [35] is part of a large effort to develop a Rapid Design System (RDS). The objective is to reduce the time from design to manufacture and inspection. In this system, tolerances are represented as features. An overall inspection plan consists of fragments, each of which relates to how toleranced geometry of a given feature is to be inspected. These Inspection Plan Fragments (IPF) are generated based upon rules and methods used in industrial practices. Inspection planning is the selection of appropriate IPFs which result in an overall time efficient plan. IPF is generated by a macro
![Figure 4: Sensor application versus level of precision and error control parameters [19]](https://thumb-eu.123doks.com/thumbv2/123doknet/14528407.723208/34.892.179.746.272.764/figure-sensor-application-versus-level-precision-control-parameters.webp)

![Figure 25: An AAM for digital manufacturing [21]](https://thumb-eu.123doks.com/thumbv2/123doknet/14528407.723208/90.892.130.787.237.655/figure-aam-digital-manufacturing.webp)