HAL Id: tel-01266217
https://halshs.archives-ouvertes.fr/tel-01266217
Submitted on 2 Feb 2016
HAL is a multi-disciplinary open access
archive for the deposit and dissemination of
sci-entific research documents, whether they are
pub-lished or not. The documents may come from
teaching and research institutions in France or
abroad, or from public or private research centers.
L’archive ouverte pluridisciplinaire HAL, est
destinée au dépôt et à la diffusion de documents
scientifiques de niveau recherche, publiés ou non,
émanant des établissements d’enseignement et de
recherche français ou étrangers, des laboratoires
publics ou privés.
THE SPATIAL DIFFUSION OF AGRICULTURAL
INNOVATIONS IN KISII DISTRICT, KENYA
Ronald Garst
To cite this version:
Ronald Garst. THE SPATIAL DIFFUSION OF AGRICULTURAL INNOVATIONS IN KISII
DIS-TRICT, KENYA . Philosophy. Michigan State University, 1972. English. �tel-01266217�
1001101
09/ oil 2001.
KEN
I
Skiti53S•IC
This is an authorized facsimile, made from the microfilm
master copy of the original dissertation or master thesis
published by UMI.
The bibliographic information for this thesis is contained
in UMI's Dissertation Abstracts database, the only
central source for accessing almost every doctoral
dissertation accepted in North America since 1861.
Dissertation
Services
A Bell & Howell Company300 N. Zeeb Road, Ann Arbor, Michigan 48106 1-800-521-0600 313-761-4700
Printed in 1997 by xerographic process on acid-free paper
This dissertation was produced from a microfilm copy of the original document. While the most advanced technological means lis photograph and reproduce this document have been used, me quality is neaviiy dependent upon the quality of the original submitted.
The following explanation of techniques is provided to help you understand markings or patterns which may appear on this reproduction.
The sign or "target" for pages apparently lacking from the document photographed is ''Missing Page(s)". It it was possible to obtain the missing page(s) or section. they are spliced into the film along with adjacent pages. This may have necessitated cutting thru an image and duplicating adjacent pages to insure you complete continuity.
When an Image on the film is obliterated with a large round black mark, it is an Ind cation that the photographer suspected that the zopy may have moved during exposure and thus C3USC a blurred
image. You will find a good image of the page in the adjacent frame.
When a map, c1 , 3wing or chart, etc., was part of the material being photographed the photographer followed a definite method in "sectioning" tne material. It is customary to begin photoing at the upper left hand corner of a large sheet and to continue ohotoing from left to right in Pcue! sections witn a small overlap. If necessary, sectioning is continued again — beginning below the first row and continuing on until ccmplete.
The majority of users indicate that the textual content is of greatest value, however, a somewhat higher quality reproduction could be made from "photographs" if essential to the understanding of the dissertation. Silver prints of "photographs" may be ordered at auditional charge by writing the Order Department, giving the catalog numbei, title, author and specific pages you wish reproduced.
University Microfilms
300 North Zeal Road Ann Arbor. M■cnigart 48106
GARST, Ronald David, 1941-
1I SPATIAL DIFFUSION OF AGRICULIURAL INNOVATIMS IN KISH DISTRICT, KENYA. Michigan State University, Ph.D., 1972 Geography
IN KISI1 DISTRICT, KENYA
By
Ronald D. Garst
A THESIS
Submitted to
Michigan State University
in partial fulfillment of the requirements for the degree of
DOCTOR OF PHILOSOPHY
Department of Geography
Some pages may have indistinct print. Filmed as received.
THE SPATIAL DIFFUSION OF AGRICULTURAL INNOVATIONS IN KISII DISTRICT, KENYA
By
Ronald D. Garst
Due to the failure of the modern sector of the economy to generate sufficient employment opportunities and the rapid growth of its cities, particularly Nairobi, the Kenya government has placed greater emphasis on rural development. It is hoped that greater attention to agri-culture and to the rural areas will increase the production of food, create more jobs in the rural areas and thus slow down rural to urban migration. Previous plans for employ-ment and food production expansion based on opening new lands have been abandoned primarily because of the high cost. Instead, intensification of production on presently used land will be the focus of efforts by the Kenya
government.
In order to intensify production it is necessary of course, to change current practices and change will
require the farmer to accept new techniques, technical inputs or crops, all of which can be classified as
• 14 •
P. 0. Box 0 Nairobi
r:
-nyJinnovations. Therefore, the study of innovation diffusion is intimately related to the problem of agricultural in-tensification. Geographers have generally confined their spatial diffusion research to the developed countries, to the neglect of the developing countries. A gap therefore exists in the literature concerning the developing
countries.
This study is an empirical investigation of the spatial diffusion of five new crops and grade cattle in a densely populated, high agricultural potential area of Kisii District, Kenya. The innovations investigated Are coffee, pyrethrum, tea, passion fruit, hybrid maize and grade cattle. The data consist of 1935 short interviews conducted in 93 different sampling areas to determine when farmers first adopted the Innovations in question and 485 long interviews ascertaining socio-economic and demographic characteristics of the farmers. A total of 55 computer maps, using the SYMAP technique, were produced to depict
the spatial diffusion pattern for each innovation over time. These maps show the distribution of adoption per-centage levels every two years from the time of original introduction to 1970, plus a final map for 1971.
The general diffusion pattern is as follows: (1) initially low levels of adoption are found at
scattered locations, (2) an outward spread at low levels of adoption occurs, (3) the emergence of peaks of higher
levels of adoption, and finally (4) the coalescence of these peaks into broad areas of high percentages of adoption. The forward edge of the diffusion wave moves very rapidly outward to encompass much of the final area of adoption in about half the time period. After the
initial spread, the gradient between no adoption and the highest levels becomes progressively steeper.
Factor analysis of 57 geographic, socio-economic, demographic and innovation-measuring variables reveals
little relationship between the innovation measures and the non-innovation variables as the latter primarily factor out by themselves or with the geographic variables. The principal determinant influencing the location of greatest intensity of adoption and use is the place of original introduction. Thus, the mass media communication channels and extension services are of minimal importance while person-to-person communication, as exemplified by the Personal Information Field, is the major moving force behind the spatial diffusion process. Recommendations
for policy planners and suggestions for further research are also given.
The field investigation upon which this study is
based was made possible by a Fulbright-Hays graduate
fellowship, supplemented by a grant from the Michigan
State University office ot. International Studies and
Pro-grams. The Institute for Development Studies, University
of Nairobi, provided part of the field operation expenses.
Computer costs were met in part by a grant from the
National Science Foundation.
As is typical of any dissertation involving foreign
field work, numerous persons were involved. Mr. Malcolm
N. H. Milne, Planning Officer, Nyanza Province, provided
valuable assistance in securing approval for the field
investigation. Dr. E. S. Ole-Mperre and Mr. S. M. Wambua,
Kisii District Agricultural Officers, were most
coopera-tive and helpful in providing assistance while in Kisii.
Numerous other government officials gave freely of their
scarce time to provide background information. Dr.
Joseph R. Ascroft, of the Institute for Development
Studia5, who was instrumental in getting the field
in-vestigation underway, assisted greatly in problems of
My colleague on the field investigation, Miss Carolyn Barnes, endured the many physical and emotional hardships of field work with unfailing dedication and determination.
The Kisii Department of Agriculture provided three agricultural extension agents to serve as interviewers: Mr. Andrew Atone, Mr. Fred Nyagwaya and Mr. Mathew Onsomu. Without them this study would have been impossible. Mr.
Timothy Ahoda, Data Processing Unit, Institute for
Develop-ment Studies, supervised the data punching and preliminary
computer analysis in Nairobi.
My graduate guidance committee provided greatly
appreciated stimulation, advice and guidance on this
dissertation. Dr. John M. Hunter, chairman of the
gui-dance committee, sparked my interest in the problems of
developing areas in an excellent seminar that eventually
saw five of its participants do foreign area field work.
My greatest vote of thanks goes to Dr. Hunter for his
un-failing confidence in me; the value of which cannct be
overestimated. Dr. Stanley D. Brunn, through his ememplary
teaching, rekindled my dormant interest in the quantatitive
techniques that are so evident in this dissertation. or.
Ronald J. Horvath, through personal conversations, helped
me to clarify many of my own thoughts about the diffusion
process. Dr. Carl K. Eicher brought to life the role of
rural development in Africa. Dr. Everett M. Rogers, a
vation diffusion than either of us would have expected back in 1969. Each of these men, in his own way, has been instrumental in formulating my academic interests and this research.
Dr. Lawrence M. Sommers, Chairman of the Depart-ment of Geography, Michigan State University, helped
finance my graduate program with a Graduate Assistantship, an NDEA Fellowship, a National Science Foundation Trainee-ship and, during the final year, a half-time position as Instructor of Geography.
Dr. Robert I. Wittick and Mr. Brian P. Holly acsisted greatly with computer mapping techniques. Mr. Sherman Hollander and Mr. Mark Sullivan, respectively, are responsible for the cartography and photographic work. Their skill speaks for itself.
Each of the abovementioned people have been in-volved in some way with the preparation of this disser-tation. However, there is one group of individuals who must go unnamed. They are the nearly 2,000 Gusii farmers who kindly provided the raw material out of which this document was produced. My hope is that the information
they provided will help, in some small way, others like them by furthering our understanding of the spatial diffusion proce:s.
wife for persevering through two very difficult years. She accompanied me to Kenya, gave birth to our daughter while there, and after returning to East Lansing managed
to complete her own Ph.D. dissertation in music as well as perform the duties of wife and mother. A lesser person could never have accomplished so much.
TABLE OF CONTENTS
Page
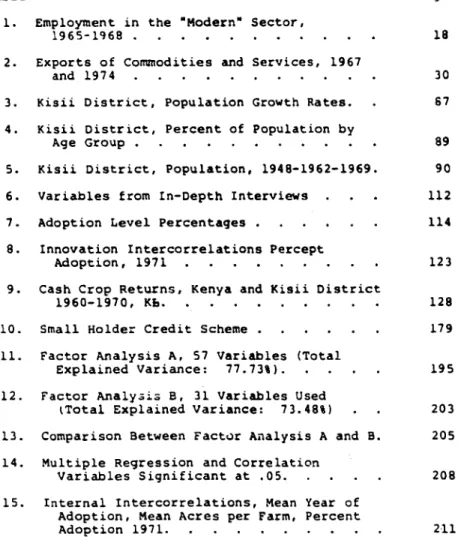
LIST OF TABLES ix
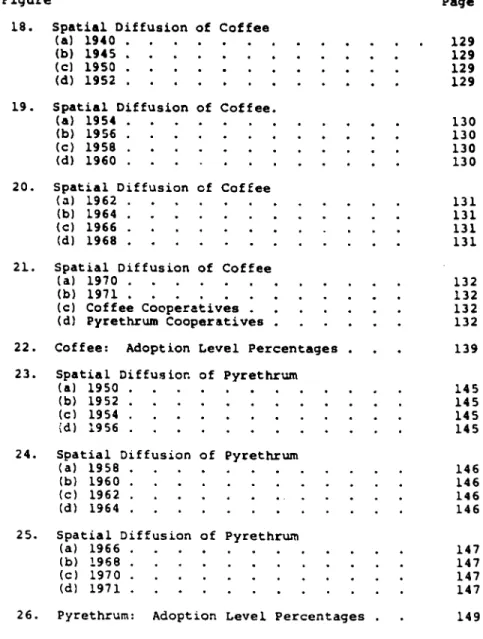
LIST OF FIGURES xi
INTRODUCTION 1
Chapter
GROWTH OF THE KENYA ECONOMY: 1963 to
1.971 4
Introduction 4
Population Growth and Rural to Urban
Migration 6
The Employment Problem 11
The Kenya Economy: An Overview 1 6
The Modern Sector 16
Industrialization 19
Tourism 21
Agriculture 22
Principal Exports 29
Principal Objectives of the Kenya Development Plan, 1970-74. .
Conclusion
32 35
SPATIAL AND TEMPORAL DIFFUSION PROCESSES:
A REVIEW AND INTEGRATION 36
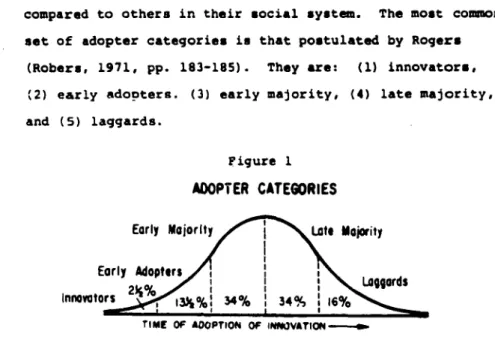
Introduction 36 Temporal Diffusion 36 Adopter Categories . . . .. 37 Characteristics of Innovations . 39 Sources of Information 45 vi
Chapter Page
Spatial Diffusion 49
Spatial Diffusion Research by Non-
Geographers. . . .. . . 50 Types of Spatial Diffusion . . . . 53 Ba.lic Concepts of Expansion Diffusion. 55 Personal Information Field . . 58
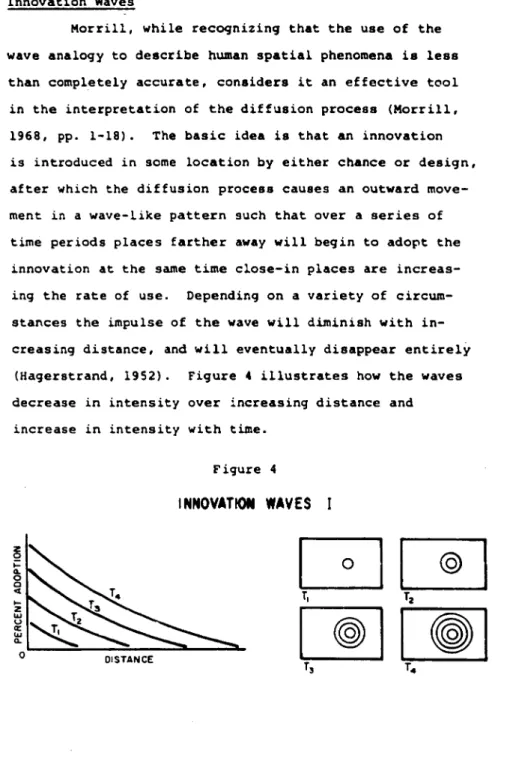
Innovation Waves 60
Thc "S" Shaped Growth Curve . 62
Simulation of Diffusion 65
Integration 68
III. KISIT DISTRICT: BIOPHYSICAL AND SOCIO- ECONOMIC BACKGROUND TO THE DIFFUSION
PROCESS 73
Introduction. . . 73
Physical Geography. 75
Climate ... .. 81
Vegetation and Soils 85
The Population of Kisii District . 87
The Gusii 92
Social Structure. 93
Infrmstructural Development 100
IV. DATA COLLECTION AND METHODS OF ANALYSIS 105
Data Collection 105
Slection of the Study Area . . 105
Selection of the Sample 106
The Field Survey and Data Collection 107 The Interview Schedule. . 108
Methods of Analysis . 110
Data Coding and the Raw Variables . 110
Diffusion Maps . . . 111
Factor Analysis ... . . 115 Multiple Regression and Correlation Ile
THE SPATIAL ATTRIBUTES OF INNOVATION
DIFFUSION IN KISII DISTRICT 120
Introduction 120
The Spatial Diffusion Process 121
Spatial Diffusion of Coffee Adoption. 124 Spatial Diffusion of Pyrethrum
Adoption 141
Spatial Diffusion of Tea Adoption. 163 Spatial Diffusion of Passion Fruit
Adoption 170
Spatial Diffusion of Grade Cattle
Adoption 178
Spatial Diffusion of Hybrid Maize
Adoption 183
Generalizations on the Diffusion
Process 191
Factor Analysis and Multiple Regression
and Correlation 193
Factor Analysis A, 57 Variables . 194 Factor Analysis B, 31 Variables 202 Factor Analysis B Related to
Innovation Adoption 206
Some Internal Interrelations 209
The Accelerating Pace of Change . . . 213 Generalizations About the Factor Analysis
and Regression and Correlation Models . 217
SUMMARY, CONCLUSIONS AND RECOMMENDATIONS. . 220
Summary 220
Conclusions 229
Recommendations for Policy Planners. 233 Suggestions for Further Research. . 236
BIBLIOGRAPHY 238
APPENDIX
257 258
Table Page
Employment in the "Modern" Sector,
1965-1968 ... 18
Exports of Commodities and Services, 1967
and 1974 30
Kisii District, Population Growth Rates. 67
Kisii District, Percent of Population by
Age Group 89
Kisii District, Population, 1948-1962-1969 90
Variables from In-Depth Interviews 112
Adoption Level Percentages 114
Innovation Intercorrelations Percept
Adoption, 1971 123
Cash Crop Returns, Kenya and Kisii District
1960-1970, Kb 128
Small Holder Credit Scheme 179
Factor Analysis A, 57 Variables (Total
Explained Variance: 77.73%). 195
Factor Analysis B, 31 Variables Used
tTotal Explained Variance: 73.48%) . 203
Comparison Between Factor Analysis A and B. 205
Multiple Regression and Correlation
Variables Significant at 05 208
Internal Intercorrelations, Mean Year of Adoption, Mean Acres per Farm, Percent
Adoption 1971 211
Figure
4.
Adopter Categories
Linear Diffusion.
Personal Information Field
Innovation Waves I Page 38 55 59 60 5. Innovation Waves II 62
6. "S" Curve in Time and Space 64
7. Kisii District: Location Map 74
8. Kisii District: Farmland 76
9. Kisii District: Hillside 77
10. Kisii District: Physiography 78
11. Annual Precipitation: Kisii Seed Farm 83
12. Kisil District: Annual Precipitation. 84 13. Kisii District: Population Density, 1969 91 14. Kisii District: Locations and Sub-
Locations 94
15. Kisii District: Roads and Towns 101 16. Cumulative Percent Adoption 122
17. Kisii District: Cash Crop Marketing
Locations 126
Figure Page
18. Spatial Diffusion of Coffee
1940 129
1945 129
1950 129
1952 129
19. Spatial Diffusion of Coffee.
1954 130
1956 130
1958 130
1960 130
20. Spatial Diffusion of Coffee
1962 131
1.964 131
1966 131
1968 131
21. Spatial Diffusion of Coffee
1970 132
1971 132
Coffee Cooperatives . 132
Pyrethrum Cooperatives 132
22. Coffee: Adoption Level Percentages 139
23. Spatial Diffusion of Pyrethrum
1950 145
1952 145
1954 145
1956 145
24. Spatial Diffusion of Pyrethrum
1958 146
1960 146
1962 146
1964 146
25. Spatial Diffusion of Pyrethrum
1966 147
1968 147
1970 147
1971 147
26. Pyrethrum: Adoption Level Percentages 149
27. Pyrethrum Diffusion, 1950 . 151 28. Pyrethrum Diffusion, 1952 . 152 29. Pyrethrum Diffusion, 1954 • 153 30. Pyrethrum Diffusion, 1956 . 154 31. Pyrethrum Diffusion, 1958 155 32. Pyrethrum Diffusion, 1960 156 33. Pyrethrum Diffusion, 1962 157 34. Pyrethrum Diffusion, 1964 158 35. Pyrethrum Diffusion, 1966 159 36. Pyrethrum Diffusion, 1968 160 37. Pyrethrum Diffusion, 1970 161 38. Pyrethrum Diffusion, 1971 162
39. Spatial Diffusion of Tea
1956 166
1959 166
1960 166
1962 166
40. Spatial Diffusion of Tea
1964 167
1966 167
1968 167
1970 167
41. Spatial Diffusion of Tea
1971 168
Collection Stations 168
42. Tea: Adoption Level Percentages. 171
43. Spatial Diffusion of Passion Fruit
1960 173
1962 173
1964 173
44. Spatial Diffusion of Passion Fruit
1968 174
1970 174
1971 174
Pick-up Points 174
45. Passion Fruit: Adoption Level Percentages. 177 46. Spatial Diffusion of Grade Cattle
1962 181
1964 181
1966 181
1968 181
47. Spatial Diffusion of Grade Cattle
1970 182
1971 182
48. Grade Cattle: Adoption Level Percentages 184 49. Spatial Diffusion of Hybrid Maize
1960 186
1962 186
1964 186
1966 186
50. Spatial Diffusion of Hybrid Maize
1968 187
1970 187
1971 187
51. Hybrid Maize: Adoption Level Percentages . 190
52. Composite Adoption Index 215
This study is an empirical investigation of the spatial diffusion process in a densely populated, high agricultural potential, African small-holder agricultural area in Kisii District of western Kenya. The principal objectives are: (1) to determine and map the spatial diffusion for coffee, pyrethrum, tea, passion fruit, grade cattle and hybrid maize; (2) to determine if the spatial diffusion pattern found in Kisii District corresponds to
the pattern found in the more developed countries; (3) to determine, with the use of factor analysis, the inter-nal structure of a series of socio-economic, demographic, locational and innovation-measuring variables; and (4) to determine via multiple regression and correlation the direction and degree of relationship between the spatial distribution of the above-mentioned variables and the
spatial diffusion pattern.
In addition to the primary objectives mentioned above the following will be undertaken. First, the role of rural development in the overall economic structure of Kenya will be evaluated to determine why planners have
generally reduced their emphasis on industrialization in favor of agricultural development and why they now favor agricultural intensification over new extensive land settlement schemes. Second, the growth of the Kenya economy from 1963 to 1971 will be examined to determine the contribution of each of the major sectors toward
foreign exchange earnings and employment generation. A brief examination of the agricultural sector will evalu-ate the role of each of the six abovementioned innovations towards the foreign exchange and employment problems. Finally, the basic objectives of the 1969-1974 Kenya Development Plan will be discussed. Third, the literature on aspatial diffusion and spatial diffusion will be re-viewed and an attempt made to integrate the basic concepts of both into an explanatory model. Fourth,
recommen-dations for policy planners and suggestions for further research will be offered.
It is normally assumed that the adoption of inno-vations is ipso facto beneficial to the adopter. By beneficial it is meant that the welfare of the farmer and his family is improved. However, this is not always the case. If, for example, a farmer removes a sizable portion of his land from food production and uses it for commercial crop production the overall quality of the
family diet may deteriorate. Cash earned from the sale of commercial crops could be used to purchase an adequate
Clearly, the adoption of commercial crops may not always
lead to an improvement in living standards. However, this dissertation is concerned with the spatial diffusion of agricultural innovations and not the consequences of those innovations.
GROWTH OF THE KENYA ECONOMY: 1963 TO 1971
Introduction
An investigation of the spatial diffusion of six agricultural innovations may, at first glance, seem to be far removed from the more generalized problem of economic development. Spatial diffusion is, however, closely
linked to the efforts to achieve a higher level of economic development.
Due to problems of population growth, rural to urban migration, inadequate employment generation and in-sufficient foreign exchange earnings the 1970-74 Kenya Development Plan has focused greater attention on rural development. The commitment of the Government of Kenya to rural development is no longer questioned. Instead, the questions revolve around the ways to most effectively improve rural levels of living. To help achieve that end the government has established a Special Rural Development Program (SRDP). Fourteen areas, represent-ing differrepresent-ing ecological, agricultural potential and population density conditions were selected in which to
develop programs that will raise rural living standards with a minimum of outside capital or personnel inputs. Techniques devised for implementing change in the SRDP
areas must be replicable in other parts of Kenya using only normal government staff and financial resources. Therefore, capital or personnel intensive projects will
not suffice. To help develop, test and evaluate the techniques for affecting change the government invited the Institute for Development Studies of the University of Nairobi to establish an SRDP Research and Evaluation Unit (Heyer, 1969, pp. 1-5; and Kenya, 1969a, pp. 174-178).
The process by which change is accepted has both a temporal and a spatial dimension. The temporal dimension has been researched rather thoroughly, but research on the spatial dimension of change in the developing countries is lacking. Therefore, this study focuses on the spatial dimensions of change in a rural area.
The six innovations used in this study will serve as vehicles for searching out the influences on the spatial diffusion process. The underlying purpose is to investigate the processes involved rather than the geography of six innovations. For it is only by under-standing the spatial diffusion process that an optimal spatial structure of a change program can be designed. Thus spatial diffusion research that seeks universals can contribute to the more efficient use of scarce developmental resources.
Population Growth and Rural to Urban Migration
Until recently East Africa has not been considered as a population problem area. Past rates of annual
popu-lation increase are as follows: Tanzania 1.8 percent (1948 to 1957), Uganda 2.5 percent (1948 to 1959), and Kenya 3.1 percent (1948 to 1962). Newer figures indicate that the rate of increase has increased. Tanzania (1957 to 1967) is growing at 3.1 percent per year, Uganda (1959 to 1969) at an annual rate of 3.9 percent and Kenya (1962 to 1969) at 3.3 percent annually. Growth rates of this magnitude will cause the populations of these countries to double in 18 to 23 ylars (United Nations, 1971, pp. 408-409).
Annual rates of increase of this size have often made it difficult to provide sufficient food for the growing numbers of people. However, the demand for food
is much easier to meet than is the demand for employment. Increased food demand first became a problem in the developing countries after World War II, so it has existed for some time, and has been met with reasonable success via the use of new technological inputs that allow greater yields and via the expansion of acreage.
There is approximately a 15-year grace period between the birth of a child and the time he enters the labor forcc. Thus, the current growth of the lal -,oL force is a reflection of the birth rate of 15 years ago, and
today's birth rate will determine the growth of the labor force 15 years hence. Unfortunately, an expanding body of unemployed poses a greater threat to peace and stability than does famine (Brown, 1970, pp. 121-126).
The initial thrust of development activity during the 1950's and the early 1960's was an effort to transform the economic structure of developing countries, that is, to change from a rural-agricultural economy to an urban-industrial economy. Development based on economic trans-formation was abandoned when it became apparent that the industrial sector would be unable to absorb adequate numbers of workers. This failure is most evident in the place that epitomizes the modern sector, the city: for it is here that high urban growth rates converge with the lack of employment generation provided by the industrial sector. Employment generation will be considered below, but first rural to urban migration will be examined.
Nairobi, for example, expanded between 1962 and 1969 at an annual rate of 9.5 percent. However, this figure includes all nationality groups; African, Asian, Arab and European. The non-African population in Nairobi actually declined by about (24 percent) 21,000 during this time period. So it seems appropriate to consider the growth of the African population as an indi-cation of future growth trends for the city. During the time in question the African population expanded from
156,246 to 407,736, or at an annual rate of approximately 14.5 percent (Kenya, 1966a, V. III, p. 21; Kenya, 1966c, V. IV, pp. 7, 41, 58, and 70; Kenya, 1970, V. I, pp. 1 and 70).
Theoretically it is possible to slow the migration of job seekers to the urban areas by lowering wage rates and by decreasing urban amenities. This would have the dual effect of making labor an attractive alternative to machinery and would probably reduce the rural to urban migration rate. The latter might not be true, because if more jobs are offered it could in fact attract even more workers, in spite of low pay and poor amenities.
Un-fortunately, policies that would tend to restrict wages in any portion of the economy, particularly in urban areas, are politically impractical (Harbison, 1967, pp. 174-193).
Rural to urban migration in most developing countries has been going on for several years at a very high rate. The result is that urban areas, and in particular the largest cities, are growing at two to three times the national rate, as in Kenya. In an effort to better understand why this migration has con- tinued unabated in spite of high urban unemployment rates, Todaro has developed a migration model that involves three basic elements. They are: (1) the urban-rural income differential, (2) the expected probability of getting
a job, and (3) the differences in urban vs. rural ameni-ties that will effect one's "real" income.
Urban wage levels are normally several times as high as rural wages, therefore even poor odds of getting a job become favorable considering the potential income if a job is secured. Thus the key element in the Todaro model is a consideration of the probability of finding
employment. The probability of getting a job during time period "t" is equal to the ratio of new modern sector employment openings in period "t" relative to the number of accumulated job seekers in the urban traditional sector
at time "t" (Todaro, 1969, pp. 138-148).
The real probabilities of finding employment are not as important as perceived probabilities, for that is what primarily influences the movement of people into the
city. For example, the 1964 tripartite agreement in Kenya between government, management and labor unions to increase the number of jobs by 15 percent was a failure, because it had the effect of attracting numerous new workers into the urban labor market. A few months later employee attrition, not offset by new hiring, brought the total employment back to the old levels, while total numerical unemploy-ment increased as a result of the migration induced by the prospect of new jobs. Thus the erroneously perceived probabilities of employment were largely responsible for the increased migration (Todaro, 1969, pp. 138-148).
The migration process generally involves two steps. First, the unskilled rural worker moves into the urban area and spends a certain amount of time in the urban traditional sector. That is, he is not regularly employed in the modern wage-earning sector, but instead is either overtly unemployed, underemployed, sporadically employed, or earns a minimal existence in petty retail trade and services. The second step is the attainment of a per-manent job in the modern sector (Todaro, 1969, pp.
138-148)
The urban bias in social services that attracts migrants to the city can easily be seen in Kenya. Local government operat'^^e !-- essentially into two groups, the seven municipalities consisting of those cities with over 10,000 people, and the 33 county councils that are largely responsible for services in the rest of the country. Lower levels of government, urban and area councils, are under the authority of the county councils for both budgetary and administrative matters. During the period 19A-68 the expenditures of the municipalities and the county councils were about equal, but the county councils served about 12 times as many people, with a resultant per capita expenditure of about 12 times as great. Per capita expenditures in 1968 were Kb 16
(U.S. $38.65) in the municipalities and only Kb 1.30 (U.S. $3.30) for the county councils. If social services only (education, health, housing and community development)
are considered, then the municipalities averaged about 27 times the per capita rate of expenditure for these services
(Kenya, 1969, pp. 179-180).
The Employment Problem
The structural transformation view of development was based on the fact that most rich countries have only a very small portion of their labor forces in agriculture, and therefore the way to modernize was to withdraw labor from agriculture and move it into the industrial sector as rapidly as possible. A corollary reason for this action was the widespread assumption of extensive disguised un-employment in agriculture. That is, a significant portion of the labor force has a marginal product of labor that
is either very low, zero, or even negative. Therefore it would be possible to remove large numbers of workers from
agriculture with no decrease in agricultural output and utilize that labor in the modern sector (Kao, 1964, pp. 129-144).
This assumed redundant labor was seen as a free form of capital that needed only to be organized. The free aspect took on two forms; first, the removal of workers from agriculture would not adversely effect
agri-cultural output (in fact, if the marginal product o_ labor was negative the removal of excess labor would actually increase output) and second, the excess labor could supposedly be organized at little or no cost. It
later became apparent that the removal of anymore than a few percent of the labor force would reduce the level of agricultural output, for the marginal product of labor was low, but positive (Kao, 1964, pp. 129-144).
The main problem was the gross .4ndercr.timate of the time, effort and amount of resources necessary for a structural transformation of the economy to take place. It also assumes that the developing countries will be able to industrialize on a massive scale, and that the only way to improve living standards is to duplicate the economic histories of the western developed countries. The basic fact is that the poor countries of today are starting with large populations, high population growth rates and generally limited resources; problems with which most of today's industrialized countries did not have to contend (Nicholls, 1964, pp. 11-44).
The very process of transformation from a tra-ditionally oriented economy to a modern economy seems to be a generator of unemployment. Rather than responding to supply and demand, wages increase due to government policies, trade union pressure and the desire of multi-national companies to make the wages of local employees comparable to those of expatriate employees. As the rate of production increases the poorer workers are weeded out and those remaining become more experienced, skilled and effective at their jobs, so the number of workers
per unit of production decreases. Thus it is not uncommon in the less developed countries to find production in-creasing more than ten times the rate of employment
(Eicher, at al., 1970, pp. 8-9; Harbison, 1967, pp. 174- 193).
It is becoming all too obvious to planners that in the modern sector of the less developed countries, increased production per unit of investment is the goal, the same as in the more developed countries. Workers become more skilled and effective, and the investment per worker increases. Today, for example, a factory of a given level of output employs fewer people than a factory of the same output would have ten years ago. Therefore, as the modern sector of the urban economy grows in output, but not in the size of the labor force, the size of the urban traditional labor force grows. This leads to in-creasing numbers of shoe shine boys, petty sidewalk traders, hand-cart operators, and hangers-on at the
small shop owned by family or friends.
In an effort to stem the tide of urban migration planners now are looking to the rural areas with the hope of controlling migration. In order to keep people out of the cities, they argue, it will be necessary to create more jobs in agriculture and increase rural living
standards to a level where it no longer becomes profitable to try the odds for an urban job. This calls for both increased rural incomes and additional rural amenities.
Increased agricultural production can be achieved by clearing new land or by increasing the productivity of presently cultivated land. Opening new land for settle-ment has not been overly successful for a variety of
reasons. In a country of already dense population in relation to the carrying capacity of the land, all of the good land will usually be occupied, leaving only marginal land to be opened by the settler. Most of the people who move to settlement schemes are very poor, thus are unable to make capital investments in the land, and are often short on skills. The most common result is for the government to invest much more in the settlement scheme than could ever be justified on purely economic criteria
(Lewis, 1964, pp. 299-310).
Ruthenberg summarizes problems of the Kenya agri-cultural schemes as follows: (1) There is seldom a cash crop capable of providing sufficient income to meet ex-penses. (2) Unjustifiably large expenditures go to housing, feeder roads, water supplies, etc. (3) Settlers are usually either the poorest farmers, uninterested in farming, or the formerly landless who possess few manage-ment skills. (4) Economic returns are not sufficient to attract the better farmers. (5) Squatters, one group for whom the settlements were designed, often prefer to remain where they are rather than move to a new area and subject
the scheme often tries to do more than is technically, economically and administratively possible. (7) When settlers fail to practice good husbandry and agriculture there is rarely any consistent policy of reprimand or correction. (8) The number and quality of staff the scheme could afford is generally insufficient to meet the needs, while an adequate staff is prohibitively ex- pensive. (9) Little or no continuity of policy is detri-mental to good operations. (10) The average cost for thirteen schemes has been about Kb 312 (U.S. $800) per
family, but that figure does not include the cost of Settlement Officers salaries (likely to be the most expensive item), overhead costs of associated government units and the interest charges on the money invested
(Ruthenberg, 1966, pp. 55-56).
The repeated failures of settlement schemes in other African countries such as Ghana (Miracle and Seidman, 1968, p. 2), Nigeria (Baldwin, 1957, pp. 166-
171), and Tanzania (de Wilde, 1967, pp. 419-420) has led planners to abandon this method of development. The degree of success seldom justifies the level of enonfii-ture. Given a limited amount of money it seems more expedient to spend it on intensification of presently occupied land.
Consideration will now be given specifically to the Kenya economy based on the problems of employment
kpl,zczati:n in rural and urban areas, and the gener-
ation of foreign exchange.
The Kenya Economy: An Overview
The purpose of this section is to examine the main sectors of the Kenya economy in order to evaluate their contribution toward reducing the problems of employment and foreign exchange. A three-fold breakdown of (1) the modern sector, with special emphasis on the role of in-dustrialization; (2) tourism; and (3) agriculture, will be used. Discussion will also be included on the principal exports as well as the principal objectives of the 1970-74 Kenya Development Plan.
The Modern Sector
In 1964 the modern sector of the Kenya economy accounted for about 64 percent of all wage employment. The :emainder consisted of employees on small-holder farms outside the settlement schemes, employees of the setLlement schemes and rural non-agricultural activities. In the rural areas the distinction between wage employ-ment and self-employemploy-ment is not always clear-cut. A farm owner may work occasionally for someone else, for the government, or perhaps in a nearby town. Thus a fair number of people probably are counted twice, as wage employees and as self-employeed. Altogether there were about 4,200,000 persons in Kenya engaged in economic
activities in 1968, including those counted twice. All wage employees accounted for roughly one-fourth of that
total (Kenya, 1968, pp. 119-120).
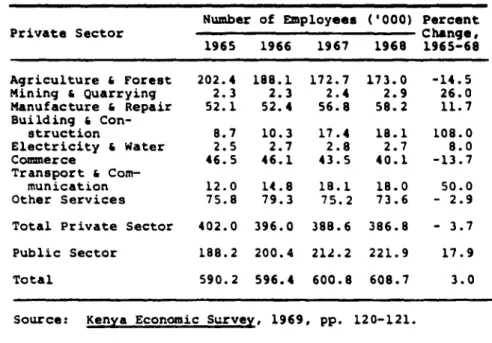
Employment (see Table 1) in the private modern sector (wage employment in privately owned enterprises) has actually been declining in recent years. Between 1965 and 1968 there was an overall decrease in employment of 3.7 percent. The decline in agricultural employment can be attributed to the transfer of ownership from the large-scale European farms to private smallholder status, with the former wage employees becoming self-employed. The steady decline in commercial employment is probably due to the departure of non-citizen Asians and Europeans. Also the departure of these high-income people and their purchasing power would have the effect of depressing this industry. The only classifications accounting for a significant increase in number of employees are manu-facturing and repairs, and building and construction
(Kenya, 1969, p. 121).
Had it not been for a steady rise in government employment, the overall modern sector would have declined in employment between 1965 and 1968. The public sector, which in 1968 accounted for about 36 percent of the modern
sector grew by 14.9 percent between 1965 and 1968. About three-fourths of the public sector employment is accounted for the Kenya Government and local governments. When the
TABLE 1.--Employment in the 'Modern" Sector, 1965-1968.
Private Sector
Number of Employees ('000) Percent Change, 1965-68 1965 1966 1967 1968
Agriculture 4 Forest 202.4 188.1 172.7 173.0 -14.5
Mining & Quarrying 2.3 2.3 2.4 2.9 26.0
Manufacture & Repair 52.1 52.4 56.8 58.2 11.7 Building 4 Con-
struction 8.7 10.3 17.4 18.1 108.0
Electricity & Water 2.5 2.7 2.8 2.7 8.0
Commerce 46.5 46.1 43.5 40.1 -13.7
Transport 4 Com-
munication 12.0 14.8 18.1 18.0 50.0
Other Services 75.8 79.3 75.2 73.6 - 2.9
Total Private Sector 402.0 396.0 388.6 386.8 - 3.7
Public Sector 188.2 200.4 212.2 221.9 17.9
Total 590.2 596.4 600.8 608.7 3.0
Source: Kenya Economic Survey, 1969, pp. 120-121.
entire modern sector, both public and private, is con-sidered, the increase in employment between 1965 and 1968 amounted to 3.2 percent, or about 1 percent per year. Considering that the modern sector is primarily urban, and that it employs only 14.5 percent of all people en-gaged in economic activity, the growth rates mentioned above are unimpressive. Indeed, the contribution to total employment provided by this sector is minimal
(Kenya, 1969, pp. 119-122). It should be noted in
examining Table 1 that while most categories showed large percentage increases in employment for the 1965-1968 period, their contribution to employment expansion is
not large due to the small base. The two categories showing the greatest decline in employment, agriculture and forestry, and commerce, were also the largest em-ployers. Therefore employment in the private sector declined by over 1 percent per year.
Industrialization
The potential for manufacturing expansion in Kenya is limited by a small natural resource base that does not show much promise for future expansion, by a
limited domestic market, and by rising unit costs that make Kenya products less competitive in the world market. There is no single natural resource in Kenya, such as petroleum, that could serve to support a major industrial complex. The national market, limited in size and pur-chasing power, could be expanded to include all of East Africa; but the worsening political climate between Kenya, Uganda and Tanzania precludes basing laiye-0.;ale
industrialization on such a market. In spite of the fact that Kenya has a vast reservoir of cheap labor the unit ousts f manufactured items are high. This is due largely to lack of worker training and skill, caused by the utter newness of the factory discipline and rules. Unfortu-nately, the net result is a per unit-cost that matches or surpasses that of the developed countries. And consider-ing transport costs and tariff barriers, the overseas market is quite limited (IBRD, 1963, pp. 153-154).
The Kenya government remains committed to the process of industrialization primarily because of the need for foreign exchange earning.. The country has not yet exhausted the opportunities for import substitution
industries. An additional national goal is to increase the degree of processing on raw materials produced in the country and gradually move to the exportation of processed goods rather than raw materials (Kenya, 1969, pp. 304-305).
As regards the annual increase in manufacturing output, Kenya has been doing rather well. Overall manu-facturing production rose from a 1964 base of 100 to 105 in 1965, to 112 in 1966, to 116 in 1967, and to 125 in 1968. The average growth was 6.2 percent per year
(Kenya, 1969b, p. 83). These figures suggest that while manufacturing output is increasing enough to make it
impor%ant as a factor in import substitution aimed at saving foreign exchange, it is not nearly as successful at employment generation.
The 1970-1974 Kenya Development Plan calls for an 8.9 percent annual increase in manufacturing production between 1967 and 1974. Given past performance of manu-facturing output an increase of this order of magnitude does not seem unreasonable. It also calls for an annual
increase of 3.7 percent in manufacturing employment, exactly the same as the 1965 to 1968 mean (Kenya, 1969, p. 314).
No mineral wealth of great consequence has been discovered in Kenya to date, nor are any great discoveries anticipated in the near future. Oil exploration that began in 1960 has almost completely been abandoned. Almost half of the mineral production is accounted for by soda ash. Salt makes up about one-fourth of the total production and gold about one-sixth. Overall, employment in mining and quarrying amounts to less than three thou-sand people, and in 1967 it accounted for only 1.3 per-cent of the total exports (IBRD, 1963, pp. 146-150; Kenya, 1969, pp. 153-156; Kenya. 1969a. pp. 93-95).
Tourism
Tourism is the fastest growing seqmdtnt of the Kenya economy. In 1963 the International Bank for Re-construction and Development mission to Kenya suggested that because of its important contribution to foreign exchange earnings, tourism be given the highest invest-ment priority (IBRD, 1963, pp. 170-175). importantly, the annual increase in the number of foreign visitors is currently on the order of 25 percent. The total number of foreign visitors rose from 50,000 in 1962 to 257,000 in 1968 (Kenya, 1967a, p. 66; Kenya, 1969a, p. 101). In terms of foreign exchange earnings tourism ranks third to the general categories of primary agricultural pro-ducts and manufactured propro-ducts. It is larger than any
foreign exchange earnings from tourism amounted to Kb 15 million (U.S. $38 million) and is expected to increase to Kb 37 million (U.S. $95 million) in 1974. The figure for
1974 represents about 75 percent of the total income de-rived from tourism, the other 25 percent will go for the cost of imported goods used by the industry and repatri-ation of profits (Kenya, 1969, pp. 427-428).
In terms of employment the tourist industry is not important to the Kenya economy, for the current employment amounts to about 20,000 people and the projected employ-ment for 1974 is roughly 40,000. This amounts to slightly
less than 1 percent of the economically active population (Kenya, 1969a, p. 452). Thus tourism justifiably ranks very high on the investment priority list because of the foreign exchange it generates, but unfortunately the same argument cannot be used for employment generation.
Agriculture
Agriculture has been and will continue to be the major sector of the Kenya economy. In terms of export production for the earning of foreign exchange it is currently the leader. In the realm of employment gener-ation agriculture is also the most important. Largely because of the latter reason agriculture has been given the highest pricrity in the allocation of financial and technical resources (IBRD, 1963, p. 63).
Agriculture's contribution to the Gross Domestic Product of Kenya is the obvious reason for its high priority position. In 1967 non-monetary agriculture made up about 21 percent of total output and in the monetary sector about 13 percent. About one-third of
the GDP consisted of agricultural products and about 60 percent of the value of commodity exports are raw or processed agricultural products. Of utmost importance
is the fact that about three-quarters of the population derives its livelihood from the land (Kenya, 1969, p.
191).
The following is a brief evaluation of each of the major cash crops and grade cattle treated in this dissertation in terms of the contribution to export earnings, and employment and the prospects for future growth.
Coffee, the leading export cash crop, faces at best an uncertain future. The 1962 International Coffee Agreement set export quotas for producing countries be-cause of a tendency for world production to amount to
about 130 percent of annual consumption. Therefore, in 1964 Kenya imposed a ban on further plantings of coffee trees. Old trees could be replaced and new growers could enter the market via the division of old plantings among new farmers. As will be seen later, the ban on further coffee plantings has not been enforced rigorously in
Kisii District. Fortunately, the Kenya-grown aribica coffee commands premium prices on the world market, and with a quality improvement campaign underway, it should be possible to increase export ea,nings while remaining within the quota (IBRD, 1963, pp. 116-120; Kenya, 1969a, p. 44).
Recently an increasing percentage of coffee pro-duction has come from small-holder plots as opposed to estates. In 1964 small-holders produced about 40 percent of the total compared to about 60 percent in 1967. This was primarily due to the breakup of European-owned estates
that were convered to small-holder African agriculture. While it does not represent any significant increase in the number of Africans working on coffee production, it does show an increase in coffee-tree ownership by African farmers (Kenya, 1969, p. 70).
Tea acreage has increased in recent years and plans are to continue the expansion. In 1968 a total of about 33,000 hectares (81,500 acres) of tea was divided two-thirds on large-scale estates and one-third on small-holder farms. By 1974 about 52 percent of the total acreage should be on small farms. This amounts to a 12 percent increase in acreage on the tea estates and a 120 percent increase in small-holder acreage (Kenya, 1969, pp. 245-246).
The international price for tea fell somewhat when the British devalued the pound sterling, but increased production in Kenya caused foreign exchange earnings to increase. However, the reduction in price may discourage others from planting. Tea ranks second only to coffee on the list of major exports, with Kb 10 million (U.S. $26 million) worth exported in 1968 (Kenya, 1969b, p. 43). The Kenya Tea Development Authority does not want to ex- ' pand the area of tea production but instead to intensify production in those areas where it is already grown. This will allow a reduction in the unit cost of trans-port and other overhead costs (Kenya, 1969, p. 246).
Expanded pyrethrum* production will probably be very dependent on two international developments. First is the great demand from the developed countries that want to discontinue the use of synthetic insecticides
such as DOT. Second is the marketing of an inexpensive synthetic for pyrethrum that is acceptable to these same countries. If more countries ban the use of DDT the demand could skyrocket, but if an effective and cheap synthetic is marketed it could spell disaster to Kenya pyrethrum producers. In anticipation of future market uncertainties the Pyrethrum Marketing Board is working to increase the efficiency of production and processing,
*Pyrethrins, the extract of the pyrethrum flower, is in great demand as it is a non-toxic, biodegradable additive for insecticides.
for as prices decline that is the only way the industry can survive. New verities of pyrethrum are being de-vulQpiid L'hat will yield more flowers per acre and a higher content of pyrethrins. The higher content will greatly reduce the cost of extracting the pyrethrins from the dried flowers. The higher yields and content will allow a reduction of about 40 percent in the pyrethrum area. So while exports have increased in the last year or two the Pyrethrum Marketing Board is not overly optimistic about the future, as it plans for declining prices and an uncertain market ,(IBRD, 1963, pp. 125-126; Kenya,
1969, p. 249; Kenya, 1969a, pp. 67-68).
In terms of foreign exchange earnings pyrethrum extract (pyrethrins) lost ground between 1966 and 1969 when the amount exported was worth Kb 2.4 million (U.S.
$6.1 million) and Kb 2.2 million (U.S. $5.6 million), respectively. By 1974 the contribution of pyrethrum to foreign exchar.ge earnings is expected to decrease by about 1/2 percent (Standard Bank, 1970, p. 2). The labor intensive nature of pyrethrum production is borne out by the fact that 75 percent r±f rho production comes from small-scale farms (Kenya, 1969, p. 249).
Passion fruit production is concentrated in the Kisii and Sotik area, but a new area of production is opening up in Thika, north of Nairobi, w.!ere a new processing plant is under construction. In :965 the
passion fruit industry was nearly wiped out by the brown spot disease, and only in 1970 did production reach pre-vious levels. If the North American market opens up, production could be tripled immediately (Interview No. 5). However, in anticipation of a slowly expanding market pro-duction is not scheduled to triple until 1974. Even then the total amount of foreign exchange earned will be on the order of Kb 210,000 (U.S. $540,000), a rather small figure when compared to the other principal export crops. Almost all production will continue to be on small farms. In the Kisii area it is anticipated that passion fruit will replace pyrethrum as the relative price structure begins to favor the former (Kenya, 1969, pp. 250-251; Kenya, 1969a, p. 69, and Interview No. 4).
Maize production has increased tremendously in recent years, largely due to the introduction of hybrid varieties. In 1965, for example, some 80,000 metric tons of maize were imported from the United States, and during the first few months of 1966 another 140,000 metric tons were imported (Kenya, 1967a, p. 32). By 1968 production had increased to the point where the government, through the Maize and Produce Board, was able to export 250,000 metric tons, worth Kb 4.8 million (U.S. $12.3 million)
(Kenya, 1969b, p. 65). But in order to do this the government subsidized the Maize and Produce Board about KSh.0.14 (U.S. $0.02) per kilogram. In the future the
efficiencies brought about by the introduction of hybrid varieties lower costs. Also, more efficient bulk handling
facilities will lower the cost of transporting the maize from farm to dockside by about . KSh. 0.07 (U.S. $0.01) per kilogram. The amount of maise exported is expected to rise to 430,000 metric tons, wroth Kb 7.6 million (U.S. $19.5 million) by 1974. However, at that time there will be no government subsidy, thus the value to export
earn-ings will be much greater than before. Currently most farmers grow some maize and in a few years nearly all of them will be growing hybrid varieties. Some use will have to be found for excess production. In anticipation of this, maize will increasingly be used for stockfeed
(Kenya, 1969, pp. 237-238).
Approximately four-fifths of Kenya is too dry for cultivation so the government is looking to cattle as a way to intensify the utliization of this land. Of the estimated 7 to 7.5 million cattle in the country, only a small portion are being raised for commercial purposes. Most are owned by semi-nomadic herders who do not raise the animals specifically to be sold or to produce milk. Currently most of the cattle are not of a sufficient quality to be sold on either the Kenya urban or the
international market. Also,they do not produce enough milk to be of great value to the owner. Today, through-out the country, efforts are underway to increase the quality of the cattle. This is done either through the
introduction of grade cattle to replace the local cattle or through a program of upgrading via artificial insemi-nation (Kenya, 1969, pp. 251-268).
About 25 percent of the total cattle slaughterings are marketed threlugh the Kenya Meat Commission and about half of this es exported while the remainder is sold in the urban areas. There is a ready market, both local and international, for beef, so the limitations on the growth of the industry are on the supply side. As for the dairy
industry, there are two trends. One is an effort to in-crease the amount of milk available for the urban areas and for the Kenya Cooperative Creamery, Ltd. to process into cheese and dry milk. The other is to expand the availability of milk for consumption by the rural African population. In order to accomplish these goals grade cows are replacing the zebu cows that produce only about one-tenth as much milk. With higher production per cow
the number of animals in the more densely populated areas should go down. In this way, with virtually no change in land requirements, milk could be made available to the local people (IBRD, 1963, pp. 126-132; Kenya, 1969, pp. 251-268; Kenya, 1969a, PP- 74-78 )-
Principal Exports
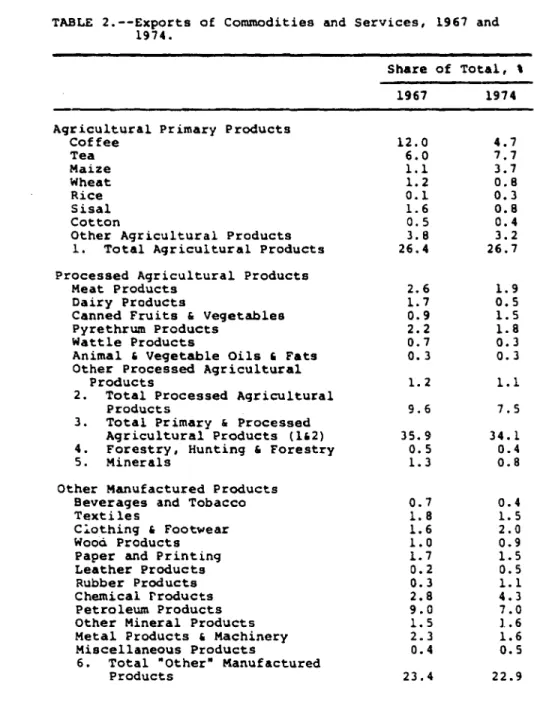
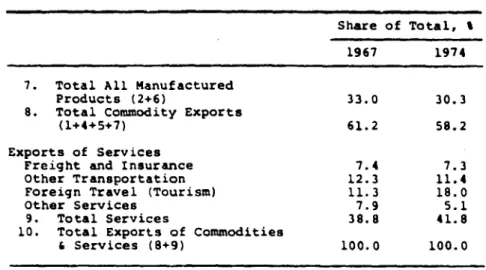
The respective roles of agriculture, manufacturing and tourism in the export economy of Kenya can be ascer-tained from Table 2. As far as commodity exports are
TABLE 2.--Exports of Commodities and Services, 1967 1974.
and
Share of Total, %
1967 1974
Agricultural Primary Products
Coffee 12.0 4.7 Tea 6.0 7.7 Maize 1.1 3.7 Wheat 1.2 0.8 Rice 0.1 0.3 Sisal 1.6 0.8 Cotton 0.5 0.4
Other Agricultural Products 3.8 3.2 Total Agricultural Products 26.4 26.7
Processed Agricultural Products
Meat Products 2.6 1.9
Dairy Products 1.7 0.5
Canned Fruits & Vegetables 0.9 1.5
Pyrethrum Products 2.2 1.8
Wattle Products 0.7 0.3
Animal 6 Vegetable Oils 6 Fats 0.3 0.3 Other Processed Agricultural
Products 1.2 1.1
Total Processed Agricultural
Products 9.6 7.5
Total Primary & Processed
Agricultural Products (162) 35.9 34.1 Forestry, Hunting 6 Forestry 0.5 0.4
Minerals 1.3 0.8
Other Manufactured Products
Beverages and Tobacco 0.7 0.4
Textiles 1.8 1.5
Clothing 6 Footwear 1.6 2.0
Wood Products 1.0 0.9
Paper and Printing 1.7 1.5
Leather Products 0.2 0.5
Rubber Products 0.3 1.1
Chemical rroducts 2.8 4.3
Petroleum Products 9.0 7.0
Other Mineral Products 1.5 1.6
Metal Products i Machinery 2.3 1.6
Miscellaneous Products 0.4 0.5
Total "Other" Manufactured
TABLE 2. --Continued.
Share of Total, t
1.967 1974
Total All Manufactured
Products (2+6) 33.0 30.3
Total Commodity Exports
(1+4+5+7) 61.2 58.2
Exports of Services
Freight and Insurance 7.4 7.3
Other Transportation 12.3 11.4
Foreign Travel (Tourism) 11.3 18.0
Other Services 7.9 5.1
Total Services 38.8 41.8
Total Exports of Commodities
Services (8+9) 100.0 100.0