Publisher’s version / Version de l'éditeur:
Structure and Infrastructure Engineering (Special Issue on Asset Management), pp. 1-20, 2012-02-01
READ THESE TERMS AND CONDITIONS CAREFULLY BEFORE USING THIS WEBSITE.
https://nrc-publications.canada.ca/eng/copyright
Vous avez des questions? Nous pouvons vous aider. Pour communiquer directement avec un auteur, consultez la première page de la revue dans laquelle son article a été publié afin de trouver ses coordonnées. Si vous n’arrivez pas à les repérer, communiquez avec nous à PublicationsArchive-ArchivesPublications@nrc-cnrc.gc.ca.
Questions? Contact the NRC Publications Archive team at
PublicationsArchive-ArchivesPublications@nrc-cnrc.gc.ca. If you wish to email the authors directly, please see the first page of the publication for their contact information.
NRC Publications Archive
Archives des publications du CNRC
This publication could be one of several versions: author’s original, accepted manuscript or the publisher’s version. / La version de cette publication peut être l’une des suivantes : la version prépublication de l’auteur, la version acceptée du manuscrit ou la version de l’éditeur.
For the publisher’s version, please access the DOI link below./ Pour consulter la version de l’éditeur, utilisez le lien DOI ci-dessous.
https://doi.org/10.1080/15732479.2012.657652
Access and use of this website and the material on it are subject to the Terms and Conditions set forth at Multi-objective and probabilistic decision-making approaches to sustainable design and management of highway bridge decks Lounis, Z.; Daigle, L.
https://publications-cnrc.canada.ca/fra/droits
L’accès à ce site Web et l’utilisation de son contenu sont assujettis aux conditions présentées dans le site LISEZ CES CONDITIONS ATTENTIVEMENT AVANT D’UTILISER CE SITE WEB.
NRC Publications Record / Notice d'Archives des publications de CNRC: https://nrc-publications.canada.ca/eng/view/object/?id=644f500d-424b-4f8f-8e8b-af958cc98276 https://publications-cnrc.canada.ca/fra/voir/objet/?id=644f500d-424b-4f8f-8e8b-af958cc98276
Multi-objective and probabilistic
decision-making approaches to
sustainable design and
management of highway bridge
decks
Lounis, Z.; Daigle, L.
NRCC-53995
A version of this document is published in:
Structure and Infrastructure Engineering (Special Issue on Asset Management), pp. 1-41, February-01-12
The material in this document is covered by the provisions of the Copyright Act, by Canadian laws, policies, regulations and international agreements. Such provisions serve to identify the information source and, in specific instances, to prohibit reproduction of materials without
written permission. For more information visit http://laws.justice.gc.ca/en/showtdm/cs/C-42
Les renseignements dans ce document sont protégés par la Loi sur le droit d’auteur, par les lois, les politiques et les règlements du Canada et des accords internationaux. Ces dispositions permettent d’identifier la source de l’information et, dans certains cas, d’interdire la copie de documents sans permission écrite. Pour obtenir de plus amples renseignements : http://lois.justice.gc.ca/fr/showtdm/cs/C-42
1
Multi-objective and probabilistic decision-making approaches to sustainable
design and management of highway bridge decks
Z. LOUNIS
1and L. DAIGLE
National Research Council, Institute for Research in Construction, Ottawa, ON, Canada
The aging an deterioration of highway bridges and the new requirements for sustainable infrastructures and communities require innovative approaches for their management that can achieve an adequate balance between social, economic and environmental sustainability. This paper presents a multi-objective decision-making approach for the sustainable design and management of highway bridge decks, which can considers several and conflicting objectives, such as the minimization of owner’s costs, users costs, and environmental impacts and uses goal setting and compromise programming to determine the satisficing and compromise solutions that yield the best trade-off between all competing objectives. The proposed approach is based on robust reliability-based mechanistic models of the deterioration and service life of reinforced concrete bridge decks, which include diffusion models for the prediction of chloride ingress into concrete and steel corrosion and thick-walled cylinder models for the prediction of stresses induced by the accumulating corrosion products in the concrete cover. The proposed approach is illustrated on the life cycle design and management of highway bridge decks using normal and high performance concrete. It is shown that the high performance concrete deck alternative is a Pareto optimum , while the normal concrete deck is found to be a dominated solution in terms in terms of life cycle costs and environmental impacts.
Keywords: Highway bridge decks; life cycle design; mechanistic service life models;
multiobjective decision-making; sustainable management; uncertainty modelling.
1. Introduction
Highway bridges are critical links in North America’s transportation network that should be kept safe, serviceable and functional during their service lives to enable personal mobility and transport of goods to support commerce and economic development. The aging and deterioration of Canada’s highway bridges and the limited funds available for their preservation require the
1
Corresponding author. Email: Zoubir.Lounis@nrc.gc.ca.
2 development of innovative design concepts, monitoring technologies and management strategies that will meet the needs of the present and future generations by ensuring: (i) acceptable safety, serviceability, and robustness against nature and man-made hazards; (ii) adequate levels of services provided by the bridges and overall road network in terms of traffic volume, speed and comfort; (iii) protection of the environment by minimizing the risk of degradation of the air, water and soil from with the construction, use, maintenance and renewal of the bridges and the overall road transportation network; and (iv) minimum life cycle costs or maximum benefits to the owners and users of the bridges. In Canada, reinforced concrete decks of highway bridges are the components that are directly exposed to the effects of the aggressive environment, including deicing salts used during winter, freeze-thaw cycles, as well as the increased traffic volume and truck load. Corrosion-induced deterioration is identified by transportation agencies in Canada as the main cause of deterioration of their highway bridge decks. The average service life of bridge decks vary from 15 years up to 50 years, which are continually extended by using different management strategies that include different combinations of maintenance, repair, rehabilitation, replacement, mitigation and adaptation actions.
The use of sustainability as a driving principle in the management of highway bridges will provide decision-makers with a comprehensive assessment of the impacts of their decisions on three key criteria or spheres of influence for sustainable communities, namely: society, economy and environment, which are referred to as the “three pillars of sustainability”. These three pillars are intrinsically linked and have impacts on decision-making at strategic, tactical and project levels of management. The implementation of sustainability principles in asset management decisions has become a “need or a necessity” rather than a “desire” to curb our consumption and emissions, protect the environment and improve our efforts towards social equity and sustainable communities. This concept has gained momentum and consensus since the publication of the
Brundtland commission report (WCED 1987), in which sustainable development was first coined and defined as a “development that meets the needs of current generation without
compromising the ability of future generations to meet their own needs.”
In the conventional approach to bridge management, some aspects of the social and economic pillars are used as the drivers and the focus for asset management at all levels of decision-making. However, the environment pillar and the consequences of management
3 decisions on the natural environment are rarely if at all considered in the decision-making process. The conventional approach to asset management should integrate environmental protection to ensure its compatibility with the principles of sustainable infrastructure and sustainable communities.
Bridge management can be defined as a systematic process of operating, maintaining, upgrading and expanding physical assets effectively throughout their life cycles as shown in Figure 1. It combines engineering principles with sound business practice and economic theory for resources allocation and utilization. The actual bridge management problem can be defined as a multi-objective optimization problem (Lounis and Cohn 1995; Frangopol et al. 1993; 2005) in which the decision maker is seeking to select the best decisions that achieve the best tradeoffs between different competing objectives, such as maximizing public safety, minimizing environmental impacts, maximizing the levels of services and minimizing the life cycle costs. However, most of the current decision-making approaches and bridge management systems are based on the optimization of a single objective, namely the minimization of life cycle costs. The state-of-art approaches to asset management have focused primarily on three objectives, namely: (i) preserving the physical condition of assets; (ii) ensuring acceptable levels of services (e.g. mobility); and (iii) minimizing the life cycle costs. It is clear that limited or no consideration has been given to assessing the life cycle or “cradle to grave” impacts on the environment and the society that result from the construction, operation, maintenance, failure, and replacement of bridge assets. Furthermore, there is also a need to assess the life cycle impacts on the environment of the service provided by these assets, such as vehicle emissions, impacts on environment due to traffic disruption, etc. The implementation of effective sustainable asset management approaches requires the development of approaches that can predict the performance of bridges and the services they provide and their impacts on society, economy and environment over their life cycles using appropriate performance measures.
The integration of environmental management with asset management will provide decision-makers with reliable and comprehensive measures on the asset performance and the associated risk of failure in terms of public safety, health, security, environmental impact, social equity, economic impact over the life cycle of the assets. Several measures can be used to mitigate the negative impacts of bridges on the environment, such as: (i) designing long life assets; (ii)
4 controlling the growth of service levels; (iii) dematerializing assets by designing efficient systems that consume less materials by using high performance materials and innovative structural systems; (iv) recycling waste and using recycled products as construction materials; (v) minimizing the disruption of service, which can have serious impacts on the environment; and (vi) implementing effective and pro-active management strategies to minimize the risk of failure of engineering assets.
In this paper, a multiobjective approach for decision-making, which can incorporate all relevant objectives, is proposed to enable the sustainable design and management of bridge decks. The objectives of this paper are twofold:
(i) Present a multiobjective approach to decision-making based on goal setting and compromise programming to ensure sustainable design and management of highway bridge decks. Multiple and conflicting objectives can be considered, including minimization of owner’s costs, users costs, and environmental impacts. ; and
(ii) Present more robust probabilistic mechanistic models for the prediction of the degradation and service life of reinforced concrete bridges decks that are exposed to deicing salts, which are based on more realistic models of the chloride ingress into concrete, onset of corrosion, corrosion products accumulation and degeneration of stresses in the concrete cover that ultimately lead to internal cracks, surface cracks, spalling and delamination.
The proposed multiobjective decision-making approach and mechanistic service life prediction models enable decision-makers to select so-called Pareto optimal or satisficing strategies for design and management of highway bridge decks, which yield the best balance between the above different and competing objectives, which are direct or indirect measures of social, economic, and environmental sustainability for highway bridges and neighboring communities.
2. Multiobjective decision-making for sustainable design and management of highway bridge decks
Highway bridges and the related network of roads contribute to improving the quality of life of Canadians and the sustainability of neighbouring communities. The failure of these assets can have serious consequences on: (i) Public safety and health as a result of fatalities, injuries, health
5 problems; (ii) Environment quality as a result of greenhouse gas (GHG) emissions, vehicle emissions, consumption of energy and raw materials, pollution of air, water , and/or soil ; and (iii) Economy as a result of disruption of service, including delays in personal mobility and transport of goods by trucks , increased maintenance and users costs, loss or damage to residential areas and commercial activities, etc. Furthermore, climate change can induce additional pressures on highway bridges in terms of increased climatic loads such as increased thermal stresses, wind loads, precipitation, flooding, etc. that can reduce the load bearing
capacity of bridges and affect the services provided by the assets. Such climate change-induced impacts can have serious consequences on public safety, public health, mobility, social equity and economic development.
The approaches to maintenance optimization implemented in the current bridge management systems are based on single objective optimization, and more specifically on the minimization of life cycle maintenance costs, which represents the present value of all the costs incurred throughout the life cycle of a bridge structure, including, the costs of design,
construction, maintenance, repair, rehabilitation, replacement, demolition and, in some instances, the users costs. An approach to the sustainable management of highway bridges can be
formulated as a multi-objective optimization problem as the bridge owner or manager seeks to satisfy implicitly and simultaneously several objectives, such as the minimization of life cycle costs to owners and users, improvement of public safety, security, and serviceability,
improvement of bridge functionality, minimization of environmental impacts, and maximization of economic benefits. .
The use of sustainability as a driving principle for the design and management of infrastructure systems will provide decision-makers with a comprehensive assessment of the impacts of their decisions on three broad criteria or spheres of influence, namely: society, economy and environment, which are referred to as the “three pillars of sustainability”. These three pillars are intrinsically linked and have impacts on decision-making at strategic, tactical and project levels. Owners and managers of roads and bridges are facing challenges, including the preservation of aging and deteriorating assets, responding to increased demands for service and new infrastructure, and limited funds. Furthermore, new pressures and new emerging challenges, such as aging population, population growth in urban centers, protection of the environment, adapting to climate change, and increasing energy costs require the development of
6 new innovative solutions for the design and management of highway bridges that can take into account of all these competing requirements. In the conventional approach to asset management, some aspects of the social and economic pillars are used as the drivers and the focus for asset management at all levels of decision-making. Up to now, the state-of-art approaches to asset management have focused primarily on three objectives, namely: (i) preserving the physical condition of assets; (ii) ensuring acceptable levels of services (e.g. mobility); and (iii) minimizing the life cycle costs.
The construction, use, deterioration, maintenance, rehabilitation, and replacement of highway bridges contribute to the greenhouse gas (GHG) emissions in Canada and require the consumption of large amounts of water, non-renewable raw materials and energy, which all contribute to negative footprints on the environment, including climate change. The road transportation sector contributes approximately 18% of the total GHG emissions in Canada (Environment Canada 2008). It also contributes to the rise in concentration of volatile organic compounds (VOC) and nitrogen oxides (NOx), which in turn contribute to the ground level ozone or smog that is associated with negative impacts on public health.
In existing bridge management approaches, limited consideration has been given to assessing the life cycle impacts on the environment that result from the construction, operation, maintenance, failure, and replacement of highway bridges. Furthermore, there is also a need to assess the life cycle impacts on the environment by the services provided by these assets, such as vehicle emissions, impacts on environment due to traffic growth, congestion, disruption, etc. There is a growing awareness of the importance of protecting the natural environment in an effort to ensure the sustainability of neighbouring communities, as well as to ensure a sustainable development at the local, regional and national levels. The implementation of sustainability principles in the design, operation, maintenance and renewal of engineering assets has become a “need or a necessity” rather than just a “desire” resulting in different efforts at the national, regional and local levels to curb consumption and emissions, protect the environment and improve our efforts towards social equity and social progress. This concept has gained momentum and consensus since the publication of the Brundtland commission report (WCED 1987), in which “sustainable development” was first coined and defined as a “development that
meets the needs of current generation without compromising the ability of future generations to meet their own needs.” This approach is referred to also as the “Triple Bottom Line” abbreviated
7 TBL or 3BL approach to accounting. The TBL approach is very different from the “Financial
Bottom Line” accounting approach and reframes the accounting process from a vehicle for maximizing profits to one focused on coordinating and satisfying stakeholder long term interests by taking into account the social and environmental criteria in addition to financial criteria (Elkington 1994; Felio and Lounis 2008).
It is clear from the above discussion that the existing approaches to decision making have serious limitations as they express all criteria in monetary terms and consider only one criterion at a time, e.g. minimization of owner costs and cannot consider non-commensurate criteria related to as environmental quality and economic development. As result, bridge management should be formulated as a multi-objective optimization problem in which optimal or trade-off solutions that achieve a satisfactory balance between several criteria or objectives, such as minimization of life cycle design and maintenance costs, maximization of public safety, minimization of traffic disruptions, and minimization of environmental impacts. Reliable information on the life cycle impacts of construction; deterioration, failure, rehabilitation and replacement of highway bridge decks on society, economy and environment require a priori reliable predictive models of the physical performance of the decks.
Corrosion-induced deterioration from the use of de-icing salts during the winter months is the main cause of deterioration of highway bridge decks in Canada. Given the complexity and uncertainty of the factors affecting the performance of the bridge decks, it is important to develop robust and reliable mechanistic models that can describe the different key stages within the life cycle of the deck, including: (i) chloride ingress into concrete and contamination of the deck; (ii) depassivation of the reinforcing steel and onset of corrosion; (iii) initiation of internal cracks; (iv) crack propagation to the surface; and (v) spalling and delamination. Any of these stages can be defined as limit states in terms of performance, which may require different protection, inspection, maintenance and rehabilitation strategies. Furthermore, it is imperative to model the uncertainty of the governing parameters in order to obtain realistic estimates of the performance of bridge decks in terms of probabilities of corrosion, cracking, spalling and delamination, which are then used to define practical criteria for end of life of the deck, which define the times at which different inspection and preservation strategies are needed to extend the service life of bridge decks. The life cycle of a bridge should not be confused with the service life of an asset. The life cycle can be defined as the time period over which the cost or
8 environmental impact are assessed, while the service life is the time over which the asset deteriorates and reaches a maximum level of damage or minimum performance level, which is referred to as a limit state, which can indicate unacceptable safety or serviceability of the asset, as shown in Figure1. The service life can also be defined as the time when the service provided by the highway bridge reaches a minimum acceptable level. Bridge deterioration shown on Figure 1 is due cumulative damage (e.g. corrosion) and does not include random shock-induced damage.
The knowledge of the service life of a bridge deck is required before undertaking a life cycle cost analysis and an environmental impact assessment. The prediction of the deterioration or service life of an asset require models that can forecast its future condition taking into account factors that contribute to its degradation as illustrated in Figure 1.
2.1 Optimization Objectives
2.1.1 Minimization of bridge owner’s life cycle costs
Owner’s (or agency) costs are the costs associated with the design, construction, inspection, routine maintenance, repair, rehabilitation, and replacement of highway bridge decks. They consist primarily of the in-place costs of materials and labour for the different actions performed on a bridge deck within its life cycle. These are tangible costs measurable with monetary values (Hawk 2003). The design cost includes the costs of all studies, environmental and other reviews, and consultant contracts prior to solicitation of construction bids for a new bridge deck or major rehabilitation of an existing bridge deck. The construction costs include the administrative and contract costs of the deck and ancillary facilities such as approach slabs. Unit costs and bills of quantities are the most widely used basis for developing construction costs estimates (Hawk 2003). The inspection, maintenance, repair and rehabilitation costs include:
• Costs of routine (visual) inspections of the bridge deck;
• Costs of periodic or special inspections using non-destructive and semi-destructive evaluation (NDE) methods such as the techniques of half-cell potential, radar, chloride content analysis;
9 • Costs of routine maintenance, which include the costs of asphalt overlays with or without membranes, crack sealing, minor patch repairs, deck washing, and maintenance of drainage and deck joints;
• Patch repair and rehabilitation costs refer to the costs of major patch repairs and concrete overlays of decks using latex modified concrete, low-slum dense concrete, or microsilica concrete. These costs include the costs of removal of spalled, delaminated and critically chloride contaminated concrete; and
• Replacement cost includes the cost of demolition and removal in addition to costs similar to the costs discussed above, i.e. costs of design and construction.
Costs occurring at different points in time during the life cycle are converted to their equivalent present value by “discounting” as follows:
t r F P ) 1 ( + =
where P is the present value of cost occurring in (t) years, F is the future cost (expressed in constant dollars) and r is the discount rate. The resulting or total cost of a bridge deck alternative is known as the Present Value Life Cycle Cost (PVLCC) and it is used to compare two or more alternative designs. The PVLCC of a bridge deck is given by:
s MRRU MRRA
PV
PV
PV
C
PVLCC
=
0+
+
−
Re (1b) ( )(
)
(
)
(
)
....
1
1
1
1 2 3 3 2 1+
+
+
+
+
+
=
t t t U or A MRRr
C
r
C
r
C
PV
(1c)where C0 = construction cost, PVMRRA = present value of all maintenance, repair, and
rehabilitation and repairs (MR&R) costs paid by the owner, PVMRRU = present value of all
MR&R cost incurred by users, PVRes = present residual value of the bridge deck at the end of the
analysis period, Cx = cost of a single occurrence of a MR&R activity (agency and/or user cost), r
= discount rate (assumed to be constant within analysis time) and tx = time of activity occurrence,
t is smaller or equal to the analysis period (life cycle). The costs of all occurrences of all defined activities are summed up. The costs of MR&R activities are expressed in today’s dollar value. The discount rate (r) represents an estimate of the average rate of return on private investment, before taxes and after inflation.
10 A reliable estimate of the life cycle cost of a highway bridge deck requires a rigorous prediction of its service life. In As stated before, all possible solutions are compared on the same analysis time regardless of their different predicted service lives. The service life of one alternative may be shorter than the analysis time and, for this case, the rehabilitation and/or replacement activities that are scheduled to maintain the bridge deck above the minimum acceptable performance (Fig. 1) are included in the analysis up to the end of the analysis period.
2.1.2 Minimization of bridge users costs
User costs include the travel delay costs, vehicle-operating costs and accident/crash costs (Hawk 2003, Golabi et al. 1993, Ehlen and Marshall 1996). Users’ costs increase with increasing traffic volume and increasing duration and disruption of the maintenance or rehabilitation activity. The user cost model used is based on the methodology of CALTRANS (Golabi et al. 1993).
(a) Minimization of travel delay costs
Traffic delay costs are those costs associated with traffic disruption due to inspection, maintenance, repair, rehabilitation, and replacement of the bridge deck. For bridges carrying a high volume of traffic, the user costs might be substantially larger than agency costs. Travel delay costs are the costs imposed on bridge users due to temporary closures of bridge lane(s) for a MR&R activity that causes traffic congestion. Delay costs are calculated using:
(
)
(
)
[
truck]
delay auto delay MRR n aC
ADTT
C
ADTT
ADT
t
S
L
S
L
TDC
=
(
−
)
−
+
(2)where TDC = travel delay costs, L = average length of affected roadway for both directions, Sa =
traffic speed during MRR activity, Sn= normal traffic speed, ADT =average daily traffic (number
of vehicle per day, including trucks), ADTT = average daily truck traffic, tMRR= duration of MRR
activity and Cdelay= hourly time value of drivers (automobile or truck).
(b) Minimization of vehicle operating costs
The vehicle operating costs are the accrued costs incurred by vehicle drivers crossing a bridge that is affected by a given MR&R activity and are mainly caused by delay. These costs include accelerated vehicle depreciation, increased vehicle repair costs, increased fuel consumption, and increased tire wear.
11 VOC MRR n a OC
ADT
t
C
S
L
S
L
V
=
(
−
)(
)
(3)where VOC = vehicle operating costs, CVOC = hourly vehicle operating cost.
Delay costs and vehicle operating costs can also be due to poor condition of the driving surface of the bridge deck and not be associated to a particular MR&R activity event. These costs are on-going user costs that start when the bridge deck condition reaches a critical state and usually degrades with time until some repair, rehabilitation or replacement activity takes place.
(c) Minimization of accident costs associated with bridge deck maintenance
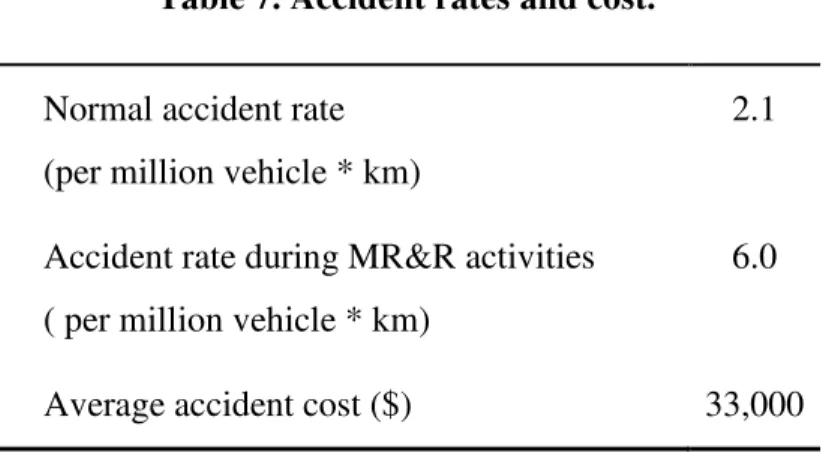
Accident costs are adopted as a measure of social performance as these costs are mainly covered by insurance premiums (material damages) and health services paid in large by the public or society. The considered accident costs are those costs incurred due to an increase in the accident rate during maintenance, repair, rehabilitation and replacement (MR&R) activities on bridge decks. These costs include costs related to injuries and damage to property, as well as the value of statistical life (VOSL) for 0.4% of the total number of accidents that result in fatalities (Statistics Canada 2003). Estimation of VOSL can vary from $160,000 to $33 million (Dionne and Lanoie, 2004). An average accident cost may be estimated using a VOSL of $1.6 million as proposed by Transport Canada (1994). Accident costs may be quite high and depend primarily on the traffic volume and the increase in the accident rate induced by the work on the bridge deck. This cost can be estimated as follows (Ehlen and Marshall 1996, Wall and Smith 1998):
ACC MRR n a
A
)
t
C
A
)(
ADT
(
L
AC
=
−
(4)where AC= accident costs, Aa = accident rate during MR&R activities (in number of
accidents/million vehicles.km), An= normal accident rate (per million vehicles.km) and CACC =
average cost per accident. Statistics collected by the insurance industry and accident rates maintained by the provincial transportation agencies, police departments, and national agencies may be used to extract data on accident rates and costs. Accident costs can be considered as a social burden in itself but may also be more appropriately considered as proxy for other social pressures caused by accidents. These social pressures are less tangible and more difficult to objectively measure (i.e. physical pain and stresses, reduced quality of life, etc.)
12
2.1.3 Minimization of environmental impacts
The quality of the environment has direct and indirect impacts on the health of Canadians and their social well-being, as well as on the economic development and on the overall sustainability of neighbouring communities. Traffic congestion also contributes to an increase in CO2 emissions and other toxic substances (NOx, SOx, VOC) and finally traffic congestion affects people quality of life as nobody enjoys being delayed in their vehicle for extended period of time or be affected by increased air pollution.
A simplified environmental impact assessment is proposed in this paper where the amounts of CO2 emissions and waste production are estimated for all MR&R activities occurring during the life cycle of highway bridge decks. For a more rigorous and complete analysis of the environmental impacts of different management alternatives, the initial construction phase should be included and based on a comprehensive life cycle assessment (LCA) of the project where all significant environmental impacts would be identified, which is outside the scope of this paper.
(a) Minimization of CO2 emissions
Regarding the CO2 emissions, the production of one ton of cement leads to 0.8-1.3 ton of CO2 emissions, depending on plant efficiency. The use of supplementary cementing materials (SCMs) such as silica fume, slag and fly ash to replace part of the cement can have two environmental benefits, namely: (i) reduce the CO2 emission associated with cement production; and (ii) use of industry by-products as construction materials instead of land-filling them. The additional CO2 emissions that are generated through the transportation by trucks of SCMs that are not locally available can be estimated as 0.022 ton of CO2 per ton of SCM over a distance of 1000 km (Bouzoubaâ and Fournier 2003). The estimation of CO2 produced by traffic delayed is based on the assumption that the production of CO2 during this extra travelling time is similar to the production of CO2 of an average car engine at idle estimated at 4.11 x 10⁻³ ton/hour (Government of Canada 2006).
The CO2 released by the production of reinforcing steel is not accounted as it would typically be the same for different bridge deck management strategies as their design is based on the simplified approach of the Canadian Highway Bridge Design Code (CAN/CSA2006), which requires a steel reinforcement ratio of 0.3% for both top and bottom layers in both transverse and longitudinal directions.
13
(b) Minimization of waste materials for landfill
The waste produced (or landfill use) for different design and management strategies includes the volume of waste material produced during the replacement of asphalt overlay, patch repairs, and deck replacement.
2.2 Formulation and solution of multiobjective sustainable bridge management problem
Several approaches have been developed to solve multiobjective optimization problems, including multi-attribute utility theory (Von Neumann and Morgenstern 1947; Keeney and Raiffa 1976), weighted sum approach (Zadeh 1963), compromise programming, constraint approach, and sequential optimization (Pareto 1919, 1971; Koski 1984; Lounis and Cohn 1993, 1995; Frangopol et al. 1993; 2005). In this paper, the goal setting and compromise programming approach are used to solve the multiobjective bridge deck management problem.
In multi-objective (or vector) optimization problems, the notion of optimality is not that obvious because of the presence of multiple, incommensurable and conflicting objectives. In general, there is no single optimal (non-dominated or superior) solution that simultaneously yields a minimum (or maximum) for all objective functions. The Pareto optimality concept has been introduced as the solution to multiobjective optimization problems (Koski 1984; Lounis and Cohn 1993). A management strategy x* is said to be a Pareto optimum if and only if there exists no management strategy in the feasible set of alternatives that may yield an improvement of some criterion without worsening at least one other criterion. The multiobjective sustainable bridge management optimization problem can be mathematically stated as follows:
Find: x* = Optimum (5a)
Such that: f(x) = [ f1(x), f2(x) ………. fn(x)] = minimum (5b)
X ∈ Ω (5c)
Ω ={X ∈ Rn g(x) ≤0} (5d)
where f = vector of n optimization objectives or criteria (e.g. minimization of owner costs, user costs, environmental impacts,); g=(g1,...,gm) vector of m constraints; Ω= subset of feasible solutions that satisfy the constraints g.
The concept of Pareto optimality mentioned above, may be stated mathematically as follows (Pareto 1919; Koski 1984; Lounis and Cohn 1993; Frangopol 1993; 2005):
14
x* is a Pareto optimum if:
fi(x) ≤ fi(x*) for i=1,2,…,m (6a)
with fk(x) < fk(x*) for at least one k (one of the m objectives) (6b)
Figure 2 is a schematic illustration of the conflicting nature of the criteria of minimization of maintenance costs and minimization of normalized probability of failure of bridge deck due to corrosion, where different failure criteria are considered, including onset of corrosion, cracking, spalling or delamination. In general, there are several Pareto optimal solutions (also called non-dominated solutions) for a multi-objective optimization problem as shown in Figure 2. In this figure, dominated solutions are also shown to illustrate the concept of dominance. Once the set of Pareto optima is generated, the “best” solution that achieves the best compromise between all competing objectives is sought. Such a solution is referred to as “satisficing” solution in the multi-objective optimization literature (Koski 1984; Yu 1985; Lounis & Cohn 1993,1995, Frangopol et al. 1993; 2005 ).
In goal setting and compromise programming, the concept of “satisficing” solution is introduced as a solution to a multiobjective optimization problem where decision-makers identify a set S of satisficing solutions such that, whenever the decision of an outcome is an element of S, the decision-maker will be satisfied and is assumed to have reached the optimal solution (Yu 1985). According to Simon (1955), decision-makers do not seek the best possible solutions to problems but operate within what he referred to as “bounded rationality”.
Let the satisficing set S bet a set of only one point x*, i.e. x* is a unique target. When each objective fi, i=1,...,n, is characterized by “less is better”, one can set x*= (x1*,...,xn*), where xi*=inf{fi(x) x ∈ X}. In this case, x* is called an ideal (or utopia) point because it is not attainable (Yu 1985). This ideal solution is defined as the solution that yields minimum (or maximum) values for all criteria. Such a solution does not exist, but is introduced in compromise programming as a target or a goal to get close to, although impossible to reach. It should be noted that, individually, the xi* may be attainable and can be found as solutions to single objective optimization problems as follows:
Find: xi* = Optimum (7a)
Such that: fi(x)= minimum (7b)
x ∈ X (7c)
15 In general, the above problems can be formulated as nonlinear programming problems (Lounis and Cohn 1993), which can be solved by different algorithms (e.g. projected Lagrangian method).
Now given x ∈ X, the “regret” of using x instead of the ideal point x* may be approximated by the distance from the set of satisfying solutions to the so-called “ideal solution”. Lounis and Cohn (1993, 1995) proposed a multi-objective optimality or criticality index, “MCI”, as a criterion for ranking competing alternatives and determining the “compromise solution”. The criterion used in compromise programming is the minimization of the deviation from the ideal solution f* measured by the family of Lp metrics (Yu 1985; Lounis and Cohn 1993, 1995). In this paper, the multi-objective criticality index, “MCI”, is defined as the value of the weighted and normalized deviation from the ideal solution f* measured by the family of Lp metrics:
This family of Lp metrics is a measure of the closeness of the satisficing solution to the ideal solution. The value of the weighting factors wi of the optimization criteria fi (i=1, …, m) depends primarily on the attitude of the decision-maker towards risk in terms of the different objectives. The choice of “p” indicates the importance given to different deviations from the ideal solution. For example, if p=1, all deviations from the ideal solution are considered in direct proportion to their magnitudes, which corresponds to a group utility (Duckstein 1984). However, for p ≥2, a greater influence is given to larger deviations from the ideal solution, and L2 represents the Euclidian metric. For p=∞, the largest deviation is the only one taken into account and is referred to as the Chebyshev metric or minimax criterion, and L∞ corresponds to a purely individual utility (Duckstein 1984; Koski 1984; Lounis and Cohn 1995). In this paper, the Euclidean metric is used to determine the multi-objective criticality index and corresponding compromise solution.
3. Mechanistic models of service life of RC decks in corrosive environments
3.1 Overview of service life of RC structures subjected to chloride attack
In North America, the extensive deterioration of highway bridge deck is mainly caused by chloride-induced corrosion of the reinforcement. The primary source of chlorides derives from
) x ( f min ) x ( f max ) x ( f min ) x ( f w ) x ( MCI p / 1 m 1 i p i i i i p i − − = ∑ = (8)
16 de-icing salts applied to roadways and bridges during winter. Given this predominant deterioration mechanism, most RC bridge deck failures are due to loss of serviceability and functionality and not loss of strength and collapse. As proposed by Tuutti (1982), the service life of concrete structures built in a corrosive environment is modelled as a two-period process and is expressed as follows:
P
t
t
t
S=
i+
(9)The service life (tS) is defined as the time it takes for the concrete deck to degrade to a
condition state that reaches a critical level of deterioration that can be defined as a “limit state”. The corrosion initiation time (ti) is the period during which chlorides penetrate and contaminate
the concrete. The reinforcing steel remains in a passive state for a relatively long period of time. Once the chloride ions reach the reinforcing steel and accumulate beyond the threshold chloride content, the corrosion of steel is initiated. The corrosion propagation (tp) is the period during
which the corrosion products accumulate and induce increasing tensile stresses in the concrete cover. Once the maximum tensile stress reaches the tensile strength of concrete, internal cracks are initiated at the steel/concrete interface as shown in Figure 3(a). After the accumulation of additional corrosion products, the cracks start to propagate. Depending on the design of the deck, the cracks may propagate in three different ways as shown in Figure 3 (Lounis et al. 2006a):
(i) Vertically until they reach the deck surface, thus leading to the formation of longitudinal cracks, as in Figure 3(b);
(ii) At an angle (about 45°) that lead to the spalling of the cover as in Figure 3(c) and; (iii) Horizontally leading to the delamination of the cover as in Figure 3(d).
A new corrosion propagation model that assumes the existence of a porous zone around the steel/concrete interface was proposed in the literature (Molina et al. 1993; Allan and Cherry 1992;Liu and Weyers 1998; Lounis et al. 2006). This model assumes that a specific quantity of the corrosion products accumulate in the so-called “porous zone” around the steel/concrete interface and do not contribute in the stress build-up and damage initiation of the concrete cover (i.e. free expansion zone). The assumption of the porous zone leads to an increase in the corrosion propagation time by an amount ∆tpz, which is proportional to the thickness of the porous zone. Liu and Weyers (1998) proposed a model for the free expansion period by
17 estimating the time needed (∆tpz ) for the corrosion products to fill the assumed porous zone around the steel/concrete interface, which depends on the w/c ratio, degree of consolidation and hydration, aggregate sizes, and type of steel. However, very limited research and experimental investigations were carried out to assess the validity and reliability of this model, which is less conservative than the model assuming no porous zone. Concrete covers with low porosity, such as high performance concrete with low w/c ratio or containing supplementary cementing materials (e.g. fly ash, slag or silica fume) have a limited space available for the accumulation of the diffusing corrosion products (Allan and Cherry 1992).
In the AASHTO Guide (1998, 2002), the condition state description of RC deck slabs refers to the evaluation of the percentage of deck area that is spalled or delaminated. The proposed life cycle performance or service life models can predict the time it takes to reach anyone of the following six serviceability limit states:
(i) critical chloride contamination of the deck;
(ii) depassivation of reinforcing steel and corrosion initiation;
(iii) onset of internal cracking at the interface of rebar /concrete cover; (iv) propagation of internal cracks and onset of surface cracking; (v) onset of spalling; and
(vi) onset of delamination.
3.2 Diffusion-based model of chloride ingress and corrosion initiation in RC decks
Since concrete is a porous medium, chlorides can penetrate into concrete through a number of mechanisms. First, if the concrete is not fully saturated, the salt solution is absorbed into the unfilled spaces by capillary action. As the chlorides migrate into the concrete, some chlorides are absorbed onto and react with the cement hydrates, which slow down the rate of chloride migration. When the surface dries, the salt remains. With successive cycles, there may be a progressive build up of salt at the surface and in the near surface layer until, after few cycles; a limiting value is reached (Bamforth et al. 1994). The time it takes to achieve a stable surface level will, however depend on the severity of exposition. In addition to this early absorption, the chloride ions migrate further into the concrete by diffusion through the pore water, driven by the concentration gradient between the surface and the sub-surface layers. As the chlorides migrate further, so the process of ‘binding’ continues to remove chlorides from the pore water.
18 In concrete which is permanently submerged and saturated, this diffusion process is the only means of transport after the initial wetting. However, even without drying there may be a build-up of chlorides in the pores water to a level above that of the surrounding saline solution, due to a process defined as chloride “condensation”. This is believed to be due to the physical adsorption of chlorides onto the pore surfaces by the electric double layer in cement and can result in chloride concentrations, which are two to four times those of the solutions to which the concrete is exposed. These are commonly referred to as loosely-bound chlorides.
The main transport mechanisms of chlorides into concrete are diffusion and adsorption. However, adsorption occurs in concrete surface layers that are subjected to wetting and drying cycles, and it only affects the exposed concrete surface down to 10-20 mm (Tuutti 182). Beyond this adsorption zone, the diffusion process will dominate Chloride diffusion is a transfer of mass by random motion of free chloride ions in the pore solution, resulting in a net flow from regions of higher to regions of lower concentration. The rate of chloride ingress is proportional to the concentration gradient and the diffusion coefficient of the concrete (Fick’s first law of diffusion). Since in the field, chloride ingress occurs under transient conditions, Fick’s second law of diffusion can be used to predict the time variation of chloride concentration for one-dimensional flow, it can be expressed as a relationship between the diffusion coefficient and the gradients of concentration, by direct analogy with the equation of heat conduction (Crank 1975), as follows:
∂Cx,t ∂t = ∂ ∂x��� ∂Cx,t ∂x � (10) where C (x,t) = chloride concentration at depth x after time t, Cs = chloride concentration at the
deck surface, and Dc = coefficient of diffusion of chloride ions into concrete. Under the
assumptions of a constant diffusion coefficient, constant surface chloride concentration Cs as the boundary condition, and the initial condition specified as C=0 for x>0, t=0, Crank’s solution yields (Crank 1975):
( )
− = t D x erf C t x C c s 2 1 , (11)where erf(.) is the error or (Gauss error) function. The following assumptions are made in modelling the chloride ingress as a Fickian process:
19 • Crank’ solution for a plane sheet assumes dealing with plane isotropic concrete structures,
i.e. one dimensional diffusion.
• Diffusion coefficient and surface chloride concentration are assumed time-invariant. • Initial concentration of chloride in the concrete is negligible.
• Interaction with other ions and with electrical double layer is ignored.
These conditions are not necessarily satisfied, for many reasons. For example, the diffusion coefficient cannot be constant because it is influenced by the following: (i) concrete is not homogenous with some micro-cracks or some shrinkage-induced cracks; (ii) moisture is unlikely to be uniform; (iii) some chlorides are bound by cement hydrates; (iv) Dc is influenced by concentration of chlorides content; and (v) chloride binding changes with time.
Therefore, to minimize the error in assuming time-invariant diffusion coefficient and surface chloride concentration, concrete cores are taken from the concrete structure to determine the “apparent” or “effective” diffusion coefficient and “apparent” surface concentration by the fitting the field data to Fick’s 2nd law of diffusion. At a shallow depth from the slab surface, the chloride concentration reaches a maximum value that can be assumed quasi-constant after an initial exposure time (Weyers et al. 1994). This value is referred to as the "apparent" surface chloride concentration. It is generally obtained from regression analysis as the best fit of Crank's equation to the chloride profiles obtain from field data.
The rate of chloride diffusion in concrete, usually measured by the chloride diffusion coefficient, depends on many other concrete properties (water-to-cement ratio, temperature, cement type, age, moisture, etc.). An apparent value of the chloride diffusion coefficient can be obtained in the field from cored concrete samples of the investigated deck.A regression analysis is performed to best fit the chloride profiles measured from these cores with Crank's equation. The apparent diffusion coefficient thus obtained implicitly includes the effects of the influencing parameters mentioned above and can vary with time, especially during the first 5-10 years after the deck construction or if the environmental conditions change.
The corrosion initiation period ends when the amount of chlorides at the top reinforcing steel reaches the threshold chloride content (Cth). To predict the time of corrosion initiation (ti),
20 depth from the surface) is set equal to the effective concrete cover depth of the reinforcing steel, c. Equation (11) becomes:
The determination of the chloride threshold concentration (Cth) is a very complex problem as it depends on the type of reinforcement, electrochemical environment in concrete, and testing method and consequently, a considerable variation is expected for this parameter. Recent studies of the chloride threshold values showed that, for different types of reinforcement (e.g. carbon steel, stainless steel, galvanized steel) that normally characterizes the chloride threshold there are some variability, which is related to other external variables, such as w/c ratio, humidity, aggregates, chloride binding etc. Glass and Buenfeld (1997) suggested that a threshold value can be expected to fall into a range of 0.03 to 0.07% by concrete weight. Bamforth et al. (1997) reported a variation of Cth from 0.06% to 2.2% for carbon steel (by cement weight).The threshold chloride content typically used in North America is 0.6 kg/m3 to 0.9 kg/m3 or 0.17% to 0.26% of cementitious material weight.
3.3 Modelling corrosion propagation time using Faraday’s Law
The mass of reinforcing steel ms that was consumed over time is related to the amount of current
Icorthat flows through the electrochemical cell (i.e. the anodic and cathodic bars areas and the
pore solution through which the ions are conducted). There is a considerable uncertainty associated with the determination of the actual volume increase due to corrosion and the corresponding composition of corrosion products. It depends on several factors, including chloride concentration, oxygen supply, and moisture. The typical oxides that are formed during the corrosion process have the following relative volume ratios compared to the volume of iron (Fe): FeO=1.7; Fe3O4=2; Fe2O3=2.1; Fe(OH)2 =3.6; Fe(OH)3 = 4.0; and Fe(OH)3 3 H2O=6.15
2 1 2 1 4 − = − s th c i C C erf D c t (12)
21 (Rosenberg et al.1989). The quantitative relationship between the metal reacting ms and the
current is defined by Faraday’s law as follows:
�� = �������� (13a)
where Icor is the corrosion current in amperes (A); t is time in seconds (s), a is the atomic mass of
the ion being dissolved (for Fe, a=55.85g/mol), n is the valency of the reaction that depends on the type of corrosion products formed (e.g. n=2 for Fe(OH)2) and F is Faraday’s constant
F=96,500 Coulomb/mol, where a Coulomb is defined as the amount of electricity represented by 1A flowing for 1s (Uhlig 1963). The corrosion rate (r) can be obtained by dividing ms by the
anodic surface area and time, as follows:
� = ���� ��� (13b)
where icor is the corrosion current density (in A/cm2). This model assumes a constant rate of
accumulation of corrosion products (Bažant 1979; Andrade et al. 1993). Liu and Weyers (1998) proposed a time-decreasing model for the rate of accumulation of corrosion products, which is due to the fact that the diffusion of iron ions is inversely proportional to the oxide layer thickness. A more practical unit of measurement of corrosion rate is the rate of penetration that is equivalent to the rate of diameter loss ∆�̇, which is obtained by dividing d by the density of the metal. Hence, for steel, (n=2), Equation (13b) becomes:
∆�̇ = 0.023���� (13c)
From Eq. (13cd), the total diameter penetration or diameter loss during the corrosion propagation time is given by:
22 In the next section, the increases in the rebar diameter (Δd) related to different stages of corrosion-induced damage will be determined by modelling the system made of “corroding rebar and surrounding concrete cover” as a thick-walled cylinder, as explained below.
3.4 Thick-walled cylinder model of corrosion-induced damage in RC decks
The accumulation of corrosion products over time generates contact pressures between the rebar and the surrounding concrete, which initiate cracks when the tensile stresses in the concrete cover reaches the tensile strength (f’t). The mechanical behaviour of the corroding rebar and
surrounding concrete system and its stress analysis can be simplified by modelling the rebar-concrete cover system as a thick-walled cylinder, which is subjected to the action of uniformly distributed pressure as illustrated in Figure 4(a), assuming that concrete is an homogeneous elastic material (Bažant 1979). The external radius and internal radius of the thick-walled concrete cylinder are defined by the concrete cover depth (c) and rebar diameter (d) as rext= c+ d/2 and rint=d/2.The deformation is assumed symmetrical with respect to the cylinder axis and consists of a radial displacement of all points in the wall of the cylinder. Radial compressive stresses (σr) and tangential tensile stresses (σt) are generated in the concrete cover by the internal
pressure (pi) due to the expansion of the corrosion products, as shown in Figures 4(a) and 4(b).
The stress of interest is the maximum tensile tangential stress, which is obtained at the inner surface of the cylinder, i.e. at the steel-concrete interface, as follows:
(14a)
The internal pressure (pcr) that induces the first internal crack is easily obtained from Eq.
(6a). The maximum radial displacement (ucr) corresponding to the onset of internal cracking is
obtained as follows:
(
)
E d f c d c d u c t cr ' 2 2 2 1 + + − + = ν νwhere Ec and ν are Young’s modulus and poisson’s ratio of concrete.
(
) ( )
(
) ( )
2 2 max 2 2 2 2 2 2 t i c d d p c d d σ = + + + − (14b)23 Hence, this model allows the calculation of the increases in the rebar diameter (Δd) related to different stages of corrosion-induced damage by calculating the radial displacements at the inner surface of the cylinder, as follows (assuming that the external pressure induced by external loads on the structure is small or negligible). Once an internal crack has initiated at the steel/concrete interface, it starts to propagate through the concrete cover as the corrosion products accumulate further and induce time-increasing tangential stresses in the outer tensile concrete rings as shown in Figure 4(b). The ultimate tensile load capacity of the cylinder will be reached when the crack propagates through the entire concrete cover. However, concrete behaviour remains still linear elastic in the outer part where the tangential stresses are still below f’t. The internal
pressure pi acting at the steel/concrete interface is now transferred through the concrete teeth
between cracks to the uncracked part of the cylinder. This internal pressure from the corroding bar on the inner area of the internally cracked ring must be reduced in comparison with the pressure on the inner surface of the uncracked ring (Tepfers 1979; Lounis et al. 2006). The uncracked ring of the concrete cover is then modelled as a thick-walled cylinder in itself and analyzed using equations (6a) and (6b) for determining the maximum tangential stresses and radial displacements for the appropriate cylinders of interest. The increase in diameter (∆d) due to accumulation of corrosion products (or rust) around the rebar is solved for by calculating the radial displacement at the inner surface of the cylinder, as follows:
d d c c d E p d c i + + + = ∆ ) ( 2 1 2 ν
The corrosion propagation times (tp), corresponding to the onset of internal cracking, surface
cracking, and delamination/spalling, respectively, can be determined as a function of the corresponding increase in rebar diameter as follows:
− ∆ = s r r p j S d d t ρ α ρ π 1 2 ) ( (14d)
where S is the rebar spacing; ρr is the density of corrosion products (assumed at 3600 kg/m3 for
Fe(OH)3); ρs is the density of steel (7860 kg/m3); α is the molecular weight ratio of metal iron to
the corrosion product (assumed at 0.52); and jr is the rust production rate per unit area (Bažant
1979), which is related to the corrosion rate of Eq.(13b), as follows:
( )
24 S ) i ( d ) 10 023 . 0 ( St ) d ( d j cor cor 6 p cor r ρ × = ∆ ρ = −
Simplified models for corrosion-induced delamination and spalling of the concrete cover were proposed by Bažant (1979) and Lounis et al. (2006). After the propagation of an internal crack through the entire concrete cover, the stresses generated by the accumulation of corrosion products around the reinforcing bar will be sustained until part of the cover spalls off or delaminates. The corresponding propagation times to onset of spalling and onset of delamination are given by the following equations:
(
)
(
c)
t s r r sp p E f d cd d c c d Sj t ' 2 2 ) ( 2 2 1 1 2 + + + + − = υ ρ α ρ π (14f) c t s r r del p E f d Sd d c c d Sj t ' 2 2 ) ( ( ) ) ( 2 1 1 2 − + + + − = υ ρ α ρ π (14g)3.5 Formulation of limit states of performance RC decks and uncertainty modelling
RC bridge decks may be considered as “failed” if they exceed a particular state, called a limit state, beyond which its performance or use is impaired. A limit state is the border that separates the desired state from “failed” state. The term “failure” is used, in this paper, in its general sense and refers to the violation of any specified performance requirement of the concrete bridge deck at any stage during its service life. Given the focus on corrosion-induced deterioration of RC decks, the limit states considered in this paper refer to excessive local damage (e.g. corrosion and bar diameter loss, cracking, spalling, delamination, loss of strength), which affect the use, durability, appearance and functionality of bridge decks. Furthermore, the limit states of local damage can become serviceability limit states of excessive deformations and vibrations if the deck stiffness is significantly reduced from extensive corrosion-induced spalling and delamination. At the extreme, excessive corrosion and localized damage can significantly reduce the cross-section areas of the rebars, bond and flexural strength, which will affect the ultimate limit states due to loss of load capacity.
25 For RC bridge decks built in corrosive environments, six failure criteria or limit states can be defined for predicting their life cycle performance of RC decks, namely:
(i) Reaching critical levels of chloride contamination of RC decks; (ii) Initiation of corrosion of top mat of reinforcing steel;
(iii) Onset of internal cracking at the steel-concrete interface; (iv) Onset of cracking at the deck surface;
(v) Onset of spalling ; and (vi) Onset of delamination.
The limit states are selected as they can correspond also to the triggering of different types of management actions for RC bridge decks, which can include: (i) visual inspection; (ii) non-destructive evaluation, using half-cell potential, ground penetrating radar, etc.; (iii) protective membrane for the deck; (iv) cathodic protection; (v) patch repair; (vi) deck rehabilitation; (viii) bridge posting; and (ix) deck replacement.
Depending on the variable of interest, the corresponding performance function can be formulated, generally, as the difference between a term that is equivalent to a “resistance” and a term that is equivalent to a “load or load effect”. For example, the term “resistance” can be used to refer to the maximum permissible chloride concentration at the steel level, or chloride threshold level Cth (which defines the resistance to corrosion of a given reinforcing steel type), or resistance of the concrete cover to corrosion-induced cracking, or spalling, or delamination. Similarly, the term “load effect” can be used to refer to the chloride concentration at the steel level, or the corrosion-induced stresses that lead to cracking, spalling, etc.
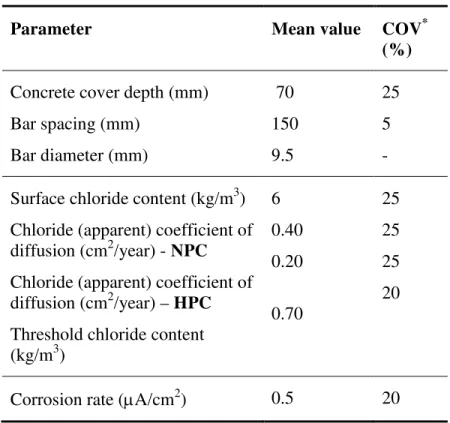
As discussed in the above sections, the performance functions that describe the above failure modes or limit states are complex nonlinear functions of several parameters. Furthermore, considerable uncertainty is associated with the mechanisms and the parameters that govern chloride ingress into concrete, corrosion initiation, corrosion rate, accumulation of corrosion products and corrosion-induced deterioration of reinforced concrete decks. The uncertainty in the models and parameters is taken into account by modeling all governing parameters as random variables. These performance functions depend on several variables (e.g. concrete cover, diffusion coefficient, bar diameter, bar spacing, etc.). We define the generalized performance function of an RC bridge deck as follows:
26 where X= (X1, X2,…,Xn) is the vector of the performance variables of the deck, and the function g(X) defines the performance, and consequently the service life of the deck. The time-dependent performance functions of RC decks can also be formulated as follows:
For t < ti
f
(
X
)
=
t
i−
t
(15b)For t ≥ ti
f
(
X
)
=
t
i+
t
p−
t
(15c)As discussed in the previous sections, the considerable variability and uncertainty of the parameters that govern the chloride ingress into concrete, corrosion initiation, rate of corrosion and accumulation of corrosion products, cracking, spalling and delamination (e.g. concrete cover, chloride threshold, diffusion coefficient, surface chloride concentration, arte of corrosion) require the use of probabilistic models in which all governing parameters are modelled as random variables to provide reliable and meaningful predictions of the life cycle performance of RC bridge decks. The time-dependent probability of failure Pf(t) is the probability that
(Pf=P[f(X)<0]) at a given time. The time-dependent probability of failure, in which failure can
be reaching critical chloride concentration, onset of corrosion, onset of cracking, spalling or delamination, can be formulated as follows:
��(�) = �(�� < �) (16a)
��(�) = �����+��� < �� (16b) The determination of the time-dependent probability of failure is a very complex problem due to the high level of nonlinearity of the performance functions. In this paper, the advanced first-order reliability method is used to determine the probability of failure for the above performance functions. The determination of the probability of failure can be formulated as a nonlinear optimization problem, in which the solution that minimizes the distance from the origin to the failure surface (described by anyone of the above performance functions) is sought. This minimum distance was defined as a measure of the reliability index by Hasofer and Lind (1974). Once the reliability index (β) is determined, the probability of failure can be estimated as follows:
27 In this paper, an iterative numerical algorithm was developed by Lounis and Daigle (2006) to solve the nonlinear optimization problem and determine the reliability index, which was then validated by Monte Carlo simulation. If the random variables are not normal, then the above approach provides only estimates of the probability of failure (Madsen et al. 1986). It should also be pointed out that if the investigated governing parameters exhibit considerable spatial variability within the deck, the use of random fields instead of random variables for their modeling may be required (Stewart 2003; Lounis et al. 2006). The use of random fields, however, requires more input data such as the correlation function and scale of fluctuation, and adds considerable analytical and computational complexity to the analysis. If the variability of the parameters can be assumed to be completely random, i.e. no systematic variability and no spatial correlation, then the use of random variables for modelling the above parameters are adequate (Lounis et al. 2006).
4. Illustrative Example
4.1 Description of bridge deck
To demonstrate the benefits of the proposed life cycle design and sustainable management approach, a typical reinforced concrete bridge deck is used for the analysis as it is the highest risk element for the bridge network from a viewpoint of deterioration and maintenance costs as a large percentage of funds of departments of transportation are allocated for the maintenance and renewal of bridge decks. Any improvements made in the design and management will lead to significant cost savings to the owners and users of highway bridges.
The bridge element under consideration is a 225-mm thick reinforced concrete (RC) slab deck. The slab has a steel reinforcement ratio of 0.3% for both top and bottom mats in both transverse and longitudinal directions, including the main reinforcement and reinforcement for shrinkage, temperature and distribution, and a concrete cover thickness of 75 mm for the top reinforcement, according to the Canadian Highway Bridge Design Code (CAN CSA 2006). The concrete deck has a width of 12.57 m and a length of 47 m between expansion joints, and is carried by simply-supported prestressed concrete girders. The bridge superstructure and substructure are not considered in the analysis. Traffic data are given in Table 2 along with a summary of the above information.