Publisher’s version / Version de l'éditeur:
Langmuir, 31, 25, pp. 7106-7116, 2015-06-08
READ THESE TERMS AND CONDITIONS CAREFULLY BEFORE USING THIS WEBSITE. https://nrc-publications.canada.ca/eng/copyright
Vous avez des questions? Nous pouvons vous aider. Pour communiquer directement avec un auteur, consultez la
première page de la revue dans laquelle son article a été publié afin de trouver ses coordonnées. Si vous n’arrivez pas à les repérer, communiquez avec nous à PublicationsArchive-ArchivesPublications@nrc-cnrc.gc.ca.
Questions? Contact the NRC Publications Archive team at
PublicationsArchive-ArchivesPublications@nrc-cnrc.gc.ca. If you wish to email the authors directly, please see the first page of the publication for their contact information.
NRC Publications Archive
Archives des publications du CNRC
This publication could be one of several versions: author’s original, accepted manuscript or the publisher’s version. / La version de cette publication peut être l’une des suivantes : la version prépublication de l’auteur, la version acceptée du manuscrit ou la version de l’éditeur.
For the publisher’s version, please access the DOI link below./ Pour consulter la version de l’éditeur, utilisez le lien DOI ci-dessous.
https://doi.org/10.1021/acs.langmuir.5b00680
Access and use of this website and the material on it are subject to the Terms and Conditions set forth at
Electric interfacial layer of modified cellulose nanocrystals in aqueous
electrolyte solution : predictions by the molecular theory of solvation
Lyubimova, Olga; Stoyanov, Stanislav R.; Gusarov, Sergey; Kovalenko,
Andriy
https://publications-cnrc.canada.ca/fra/droits
L’accès à ce site Web et l’utilisation de son contenu sont assujettis aux conditions présentées dans le site LISEZ CES CONDITIONS ATTENTIVEMENT AVANT D’UTILISER CE SITE WEB.
NRC Publications Record / Notice d'Archives des publications de CNRC:
https://nrc-publications.canada.ca/eng/view/object/?id=3348f6da-3577-4eaf-b806-30945e589fec https://publications-cnrc.canada.ca/fra/voir/objet/?id=3348f6da-3577-4eaf-b806-30945e589fec
Electric Interfacial Layer of Modified Cellulose Nanocrystals in
Aqueous Electrolyte Solution: Predictions by the Molecular Theory of
Solvation
Olga Lyubimova,
†,‡Stanislav R. Stoyanov,
†,‡,§Sergey Gusarov,
†and Andriy Kovalenko*
,†,‡†
National Institute for Nanotechnology, 11421 Saskatchewan Drive, Edmonton, Alberta T6G 2M9, Canada ‡
Department of Mechanical Engineering, University of Alberta, Edmonton, Alberta T6G 2G8, Canada §
Department of Chemical and Materials Engineering, University of Alberta, Edmonton, Alberta T6G 2V4, Canada
*
S Supporting InformationABSTRACT: The X-ray crystal structure-based models of Iα
cellulose nanocrystals (CNC), both pristine and containing surface sulfate groups with negative charge 0−0.34 e/nm2
produced by sulfuric acid hydrolysis of softwood pulp, feature a highly polarized “crystal-like” charge distribution. We perform sampling using molecular dynamics (MD) of the structural relaxation of neutral pristine and negatively charged sulfated CNC of various lengths in explicit water solvent and then employ the statistical mechanical 3D-RISM-KH molec-ular theory of solvation to evaluate the solvation structure and thermodynamics of the relaxed CNC in ambient aqueous NaCl solution at a concentration of 0.0−0.25 mol/kg. The
MD sampling induces a right-hand twist in CNC and rearranges its initially ordered structure with a macrodipole of high-density charges at the opposite faces into small local spots of alternating charge at each face. This surface charge rearrangement observed for both neutral and charged CNC significantly affects the distribution of ions around CNC in aqueous electrolyte solution. The solvation free energy (SFE) of charged sulfated CNC has a minimum at a particular electrolyte concentration depending on the surface charge density, whereas the SFE of neutral CNC increases linearly with NaCl concentration. The SFE contribution from Na+counterions exhibits behavior similar to the NaCl concentration dependence of the whole SFE. An analysis of the 3D maps
of Na+ density distributions shows that these model CNC particles exhibit the behavior of charged nanocolloids in aqueous
electrolyte solution: an increase in electrolyte concentration shrinks the electric interfacial layer and weakens the effective repulsion between charged CNC particles. The 3D-RISM-KH method readily treats solvent and electrolyte of a given nature and concentration to predict effective interactions between CNC particles in electrolyte solution. We provide CNC structural models and a modeling procedure for studies of effective interactions and the formation of ordered phases of CNC suspensions in electrolyte solution.
■
INTRODUCTIONCellulose is a sustainable, biodegradable, and recyclable material produced from the most abundant renewable resource available today.1 Cellulose nanocrystals (CNC), the smallest building blocks of cellulose that carry its physical properties, are produced by controlled sulfuric acid hydrolysis of a variety of cellulose sources such as wood, crops, and marine products1,2 on a tons per month scale in a sustainable and viable bulk process, unlike other nanomaterials that are typically produced in small amounts and at very high cost.3Upon acid hydrolysis, the surface of CNC particles is modified with the negatively charged acidic sulfate ester (−OSO3−) groups, causing
electrostatic repulsion between these rod-shaped nanocolloidal particles and resulting in stable aqueous CNC suspensions. Achieving good dispersibility of CNC in aqueous or organic solvents is a challenging task. Irreversible particle aggregation often occurs when the nanoparticles are dried. It has been
found that the completely protonated acid form of CNC is not dispersible in water once it has been fully dried.4Recently, the dispersibility of CNC in water has been thoroughly studied, and it has been reported that the dried acid form of CNC can be redispersed in water without the use of additives or chemical modification, provided that it has a residual moisture content above the threshold level of 4% by weight. When a minimum of 94% of H+counterions is exchanged with Na+, the neutral salt
form of dried CNC can be easily dispersed in water, even when fully dried.5
The outstanding mechanical properties of CNC6 make it very attractive as a reinforcing additive in biocomposite materials,7−9 hydrogels,10−12 and foams,13,14 as well as
Received: February 20, 2015 Revised: June 5, 2015 Published: June 8, 2015
specialized security inks.15,16Large-scale application of CNC as a reinforcing filler in composite materials requires modifications to tune up its surface properties, thus enhancing its compatibility with polymer matrices and solubility in nonpolar solvents.17Several methods for CNC surface modification have been developed, including grafting,18,19 polymer self-assembly, and surfactants.20Suspensions of cellulose nanocrystals display a phase separation into clear isotropic and structured chiral nematic phases above a critical concentration,21 and upon drying form iridescent chiral nematic films.22,23 It was found that the phase equilibrium is very sensitive to added electrolyte,21polymer surfactants,24and the nature of counter-ions present in the suspension.4 It was concluded that in aqueous solutions the particle geometry and ionic strength are the most important factors governing phase separation. Apparently, a decrease in the double-layer thickness increases the chiral interactions between the crystallites.21
Molecular dynamics (MD) simulation studies have shown that finite model crystals of both Iα
25
and Iβ cellulose
allomorphs26−29develop an overall right-hand twist as a result of solvation in water. This result is consistent among different force fields, such as the OPLS force field extended for carbohydrates,27 CHARMM,26 and GLYCAM25,28 applied to fibrils or crystals of different size. Matthews et al.26employed the CSFF force field30,31 and MD simulations to study the dynamic behavior of Iβ cellulose crystals and the solvent
organization at the interface between the crystal surfaces and water for cellulose Iβ crystals surrounded by water (TIP3P
model). An expansion of the unit cell and change in the cell angle to almost orthogonal observed during MD relaxation indicate a right-hand twist and a transition of the primary alcohol groups away from the starting TG conformation to GG in every other layer. In this conformation, interlayer hydrogen bonds form to the origin chains above and below. No change in the primary alcohol conformations or hydrogen-bonding patterns in the origin chain layers is observed. In the first hydration layer, a strong localization of the adjacent water is found that extends far into the solution. It is hypothesized that the structured water layers might present a barrier to the approach of cellulase enzymes toward the cellulose surfaces in enzyme-catalyzed hydrolysis and inhibit the escape of soluble products, contributing to the slow rates of hydrolysis observed experimentally.26
In a later report, Matthews et al.28employ MD simulations with CHARMM (C35)32,33and GLYCAM06 force fields34to examine the high-temperature (500 K) behavior of cellulose Iβ.
Due to the formation of a three-dimensional hydrogen bond network different from the two-dimensional hydrogen bond network in the room-temperature crystal structure of cellulose Iβ, both force fields predict structures that are not twisted. This
three-dimensional hydrogen bond network forms concurrently with the disappearance of the twist. Both models converge to a relatively similar high-temperature structure, despite the differences between the force fields. Thorough structural analysis of deformed CNC suggests that the twisting phenomenon arises from hydrogen bond network reorganiza-tion within and between the chains in the fibrils at a high temperature.28In their most recent report, based on extensive room-temperature MD simulations using the above force fields, Matthews et al. conclude that cellulose fibrils diverge from the Iβstructure and even after 800 ns the MD simulations do not
converge.29 Further computational and experimental effort is needed to elucidate the structure of CNC in solution.
Paavilainnen et al.27employed the OPLS force field extended to carbohydrates35 to analyze the twisting of cellulose I
β
nanofibrils in atomistic MD simulations with TIP3 water. Fibrils of two different types of cross sections consisting of 59 and 36 chains with lengths of 40 or 20 glucose residues are simulated at temperatures of 293, 310, and 350 K for up to 140 ns. It is shown that crystalline fibrils twist along the principal axes and the twisting rate depends on temperature. The extent of twisting of different chains depends on the distance of a chain from the middle of the fibril. The cellulose chains are not subject to any significant bending or stretching. On the basis of these MD simulations, hydrogen bonding has been associated with the twisting: the increase in the number of interchain and cellulose−water hydrogen bonds is related to the observed twisting.27The chain reorientation is similar to that reported by Matthews et al.26 Cellulose fibril twisting has also been observed experimentally.36,37
Yui and Hayashi25studied the swelling relaxation behavior of cellulose Iα and IIII crystals using MD simulations with the
solvated finite-crystal models and GLYCAM force field. A distinct right-handed twist was observed for Iα with a greater
amount of twisting compared to Iβ cellulose. Although the
amount of twist decreased with increasing dimensions, the relative changes in twist angle suggest that considerable twist would arise in a crystal model of actual dimensions. Upon heating the native cellulose crystal models, the chain sheets of the Iα model showed a continuous increase in the twist angle,
suggesting weaker intersheet interactions in this alomorph. It was shown that the swollen crystal models of cellulose Iα and
IIII well reproduced the representative structural features
observed in the corresponding crystal structures. The crystal model twist thus characterizes the swelling behavior of the native cellulose crystal models that is related to the insolubility of the crystals.25
Recently, Bu et al. published a detailed investigation of the molecular origins of twisting in cellulose Iβ.
38
On the basis of extensive CHARMM force field analysis, these authors conclude that the main interaction contributing to twisting is hydrogen bonding spanning the glycosidic linkage. The characteristics of the chiral centers in this trans-glycosidic-linkage hydrogen bonding are found to determine the right-handed direction of twisting. Moreover, these authors state that the hypothesis by Hadden et al.39 of cellulose twisting being due to van der Waals forces is highly unlikely and unsupported by the published evidence.38
Modeling of solvation structure and thermodynamics is crucial to understanding the dispersion, self-assembly, and adsorption of molecules on surfaces in solution. A statistical mechanical method of integral equation theory of molecular liquids and solutions capable of predicting solvation effects in realistic complex systems is the three-dimensional reference interaction site model with the Kovalenko-Hirata closure approximation (3D-RISM-KH molecular theory of solva-tion).40−43 In a single formalism, the 3D-RISM-KH theory accounts for both electrostatic and nonpolar effects such as hydrogen bonding and hydrophobic solvation forces over a wide range of thermodynamic conditions and solution composition44 and reproduces various structural and phase transitions in complex associating liquids and mixtures.45,46In particular, the 3D-RISM-KH theory yields the hydration structure and potentials of mean force of ion pairs in electrolyte solution in a range of concentrations from infinite dilution to high concentration, including ionic ordering and
cluster-ing.40−44The 3D-RISM-KH molecular theory of solvation has been employed to predict the effect of trace amounts of water in chloroform solvent on the aggregation of petroleum asphaltenes,47 molecule−surface recognition in solution,48 gelation activity of oligomeric polyelectrolytes in different solvents,49structural water, and ions related to functions of the GroEL chaperonin50 and Gloeobacter ligand-gated ion channel44,49 biomolecular complexes, hydration structure above bacteriorhodopsin,51 solvent-promoted self-assembly and conformations of synthetic organic supramolecular rosette nanotubular architectures,52 association of biomolecules in solution,53 and chemically specific effective interactions of cellulose microfibrils in hemicellulose hydrogel.54
In this article, we combine MD simulation and 3D-RISM-KH to study the solvation structure and thermodynamics of CNC in electrolyte solution. We first analyze the structural changes, charge redistribution, and surface charge effect on the extent of twisting during MD sampling. To our knowledge, this is the first report on molecular-level computational modeling of industrially produced CNC particles with negatively charged acidic sulfate ester groups. The relaxed CNCs are then used in the framework of the 3D-RISM-KH molecular theory of solvation to study the solvation structure and thermodynamics of IαCNC in ambient water and NaCl aqueous solution.
■
MODELING METHODS AND PARAMETERSWe ran MD simulation with an explicit solvation model to sample the structural relaxation of CNC particles. The 3D-RISM-KH molecular theory of solvation40−44 has been employed to predict the solvation structure and thermody-namics of CNC in solution. Overviews of the 3D-RISM-KH theory are presented in the Supporting Information and refs 40−44.
The CNC particle is described in terms of GLYCAM06, a highly consistent and transferable all-atom force field, developed for modeling carbohydrates and glucoconjugates.34 The water is described in the present study with the extended simple point charge (SPC/E) model.55Nonbonded parameters for sodium and chloride ions are taken from Koneshan et al.56 Molecular dynamics calculations were performed with the AMBER11 package.57
CNC Particle Models. Crystalline cellulose exhibits two crystal phases, namely, Iαand Iβ. In the present work, the crystal
structure of cellulose Iα
58
has been used to build the CNC particle, as this is the predominant phase in CNC produced from wood by sulfuric acid hydrolysis determined using cross-polarization magic angle spinning 13C nuclear magnetic
resonance (CP/MAS 13C NMR) spectroscopy.59
In this CP/ MAS13C NMR study, the wood samples exhibit a crystalline
phase spectrum that is consistent with cellulose Iα, but with
broader resonances due to the lower crystallinity of 0.60 for CNC produced by sulfuric acid hydrolysis of wood compared to 0.72−0.74 for CNC produced by sulfuric acid hydrolysis of bacterial cellulose.59 Nishiyama and co-workers have used synchrotron X-ray and neutron fiber diffraction and have provided the most accurate characterization of the Iα
58 lattice structure to date. Crystalline cellulose has a layered structure stabilized by an intralayer hydrogen-bonding network with no hydrogen-bonding interactions between layers. The weak −C− H···O− bonds between cellulose sheets are important in binding these layers together.
Our CNC particle model consists of 34 chains forming a 3-layer cellulose particle with a diameter of 3 nm, as shown in
Figure 1c. The layers are inner (red), intermediate (green), and outer (blue). Every cellulose polymer chain in the crystal
consists of 16 glucosyl residues giving a particle of 8 nm length (CNCl=16) (Figure 1d). The particle is constructed by 8A × 6B
×6C translations of the Iα unit cell (Figure 1a).
The charged CNCq1=16particles were prepared by grafting the
surface cellulose chains with deprotonated sulfate ester groups at the C6 positions (Figure 1b). To estimate the surface charge density of CNCq1=16particles, the particle surface area (S, nm2)
is measured to be 59 nm2 using the van der Waals surface
constructed around the crystal with a probe radius of 1.4 Å. Calculated as the net particle charge (q, e̅) divided by the particle surface area (S, nm2) is the surface charge density in e/
nm2. Every deprotonated sulfate group carries a negative
charge. The CNCq1=16particles with 8, 12, 16, and 20 sulfate
groups have total charges of q = −8, −12, −16, and −20 e that yield surface charge densities of −0.14, −0.20, −0.27, and −0.34 e/nm2, respectively. The estimated surface charge density for particles with 16 and 20 −O−SO3groups is close
to ∼−0.3 e/nm2measured for sulfuric acid-hydrolyzed CNC.60 Twice as long neutral CNCq=01=32and charged CNCq=−321=32 particles
containing 32 glucosyl residues are built to justify the 3D-RISM-KH results’ dependence on the surface charge density.
MD Simulations Setup. Molecular dynamics simulations are performed for four CNC particle models CNCq=0;−161=16 and
CNCq=0;−321=32 . For neutral particles, the simulations are performed
in pure water. For negatively charged sulfated CNC particles, 16 or 32 Na+ are added to the system to achieve overall
neutrality. The initial atomic positions in the unit cell were obtained from the crystallographic unit cell data.58The crystals were created by unit cell translations: 8A × 6B × 6C for CNCq=0;−161=16 or 16A × 6B × 6C for CNCq=0;−321=32 . Every time the
CNC particle under consideration was placed into the center of the simulation box so that the approximate distance from the box walls to the particle was about 2 nm. The rest of the box was filled with water molecules. The system compositions and resulting equilibrated box volume data are gathered in Table 1. Simulations were performed initially under NVT conditions at
T = 298.15 K with temperature regulation by Langevin
dynamics. After temperature relaxation, the subsequent run was carried out under NPT conditions. The initial box dimensions and the equilibrated box volume averaged over the last 2 ns of simulation after density equilibration are presented in Table 1. Figure 1. (A) Iα cellulose unit cell. (B) Surface cellulose chain fragment with a deprotonated sulfate ester group in the C6 position. (C) Cross section of the cellulose nanocrystal containing 34 glucan chains. (D) CNC particle dimensions.
3D-RISM-KH Calculations Setup. The study of thermo-dynamics and the solvation structure of neutral and charged (sulfated) CNC particles is performed in an aqueous solution of sodium chloride of molality ranging from 0.005 to 0.250 mol/kg (Table 2). The solution densities and water and ion
molar fractions were calculated on the basis of the data taken from ref 61. The 3D-RISM-KH equations for CNC particles placed in a rectangular box of size 256.0 Å × 128.0 Å × 128.0 Å were converged on a uniform grid of 512 points × 256 points × 256 points, giving a grid spacing of 0.5 Å. Calculations were carried out at temperature T = 298.15 K. The water dielectric constant of 78.497 was used for both pure water and electrolyte solutions under ambient conditions.
In 3D-RISM-KH, the 3D distribution function (normalized density distribution) of solvent site γ, gγ(r), is related to the
total correlation function hγ(r) as gγ(r) = hγ(r) + 1. A gγ(r)
value of 1.0 corresponds to a bulk solvent distribution far from the solute. When gγ(r) > 1.0, the solvent site density is
enhanced relative to bulk solvent. When gγ(r) < 1.0, the solvent
density is depleted relative to bulk solvent.40−44
■
RESULTS AND DISCUSSIONMolecular Dynamics Sampling: Particle Twisting and Surface Charge Redistribution.The CNC particle created from the ideal Iαcrystal structure, used as an initial structure in
MD sampling and a reference for the extent of the structural changes, has a substantial charge polarization. Layers in the crystal are stacked in such a way that the positively charged groups face the negatively charged groups, giving a crystal-like charge distribution. The (001̅) and (01̅0) faces of the particle expose negatively charged O atoms. The (001) and (010) faces expose positively charged H atoms. The charge polarization is well seen from the 3D density distributions of Na+ and Cl−
electrolyte ions around the nonrelaxed CNC particles built as a square ideal crystal shown in Figure 2. It is clearly seen that positively charged Na+ ions are concentrated around the
particle surfaces exposing negatively charged groups (Figure
2A) while Cl−ions are around the opposite positively charged
side of the CNC particle (Figure 2C).
The 7-ns-long MD sampling of the relaxation of CNC particles in explicit water solvent induced a variety of changes in the particle structure and charge distribution. The ordered arrangement of the atomic charges in the initial ideal crystal structure resulting in a macrodipole of high-density charges of opposite sign at the opposite CNC faces relaxes into a distribution of atomic charges in small local spots of alternating charge over each CNC face. This drastically affects the observed distribution of electrolyte ions around the CNC particle (Figure 2B,D). The faces of the relaxed particle are not polarized any more, and ions are rather evenly distributed in small alternating spots on the CNC surface. The ion distributions are obtained from the 3D-RISM-KH calculations for both the initial and relaxed CNC particles in aqueous NaCl solution at a concentration of 0.03 mol/kg. The above observation suggests that the initial crystal-like charge distribution in the CNC could be one of the driving forces resulting in its twisting, in addition to the hydrogen bonding that spans the glycosidic linkage, as identified by Bu et al.38To look into that, we model neutral and charged CNC particles and explore if the surface charge affects the CNC particles’ twisting behavior. The particle twisting is analyzed in the same way as reported by Yui and Hayashi.25 The twisting deformation of CNC particles during dynamics simulations is evaluated by the deviation from the planarity of the central chain sheet. The scheme, presented in Figure 3A, definesΦ as a torsion angle formed by the virtual bonds connecting the centers of mass of the residues G, analogous to the definition of Yui and Hayashi.25TheΦ values averaged over the last 2 ns of MD with respect to the residue positions and standard deviations are presented in Figure 3B for the CNCq=0;−161=16 and
CNCq=0;−321=32 crystal models. Positive residue positions tend to
give values ofΦ larger than those for negative positions, and the particle length is a primary factor that determines the value of Φ, as reported by Yui and Hayashi.25 We observed no notable effect of surface charge on the extent of twisting (Figure 3B). The CNC particles relaxed as described here have then been used to study the solvation thermodynamics of CNC in pure water and in aqueous electrolyte solution by using the 3D-RISM-KH molecular theory of solvation.
In Figure 4, we present the dependence of the free energy of the CNC particle in its initial structure as well as after 100 ps and 7 ns of MD sampling. The free energy is defined as the total energy of the CNC particle stripped from water and counterions calculated using the GLYCAM06 force field in AMBER11 plus the SFE calculated using 3D-RISM-KH. The results show that the free energy decreases substantially from the initial structure to 100 ps and further upon twisting to 7 ns, indicating that the sampling proceeds spontaneously to yield the twisted structure. It is important to state that in light of the previous MD simulation studies,25,26,28,29the 7 ns sampling of the relaxation of CNC might not have converged yet, and the particle structure may not necessarily represent the real system. Note that the free energy of the system obtained in this calculation is positive because it does not include the large negative free energy of the bulk solvent. However, the latter is a constant, and what matters is the free-energy change with the MD conformational evolution and solvation.
3D-RISM-KH Results for Neutral and Charged CNC Particles in Water and Aqueous Electrolyte Solution. The dispersion of nanocolloidal particles in solution is Table 1. System Setup for MD Simulation and Resulting
Equilibrated Box Volume
CNC particle initial box dimensions, nm × nm × nm number of water molecules number of sodium ions equilibrated box volume, nm3 CNCq=01=16 14.9 × 8.0 × 7.4 24 162 0 817.5 CNCq=−161=16 14.9 × 8.9 × 8.3 30 782 16 1015.5 CNCq=01=32 23.2 × 8.0 × 7.4 36 183 0 1270.5 CNCq=−321=32 23.2 × 8.9 × 8.3 46 428 32 1608.0
Table 2. Aqueous NaCl Solution Density (ρ), Molality (b), Molarity (c), and Debye Screening Length (k−1) Calculated
as k−1(nm) = 0.304/(I(M))1/2,62Where I Is the Ionic
Strength (mol/L) ρ, g/cm3 b, mol/kg c, mol/L k−1, nm 0.997269 0.005 0.00498635 4.3 0.997477 0.010 0.00997477 3.0 0.997890 0.020 0.01995780 2.1 0.998302 0.030 0.02994907 1.8 0.998714 0.040 0.03994855 1.5 0.999124 0.050 0.04995622 1.4 1.001167 0.100 0.10011675 0.96 1.007219 0.250 0.25180485 0.61
determined by the interplay between mean solvation forces on one side and van der Waals and electrostatic interaction potentials between particles on the other side. Charged particles suspended in water or another liquid with a high dielectric constant disperse due to electrostatic repulsion. Charging of the particle surface in liquid can occur by preferential ionic surfactant adsorption, adsorption/desorption of lattice ions, isomorphous substitution in a charge-defective lattice, and most often by the direct dissociation or ionization of surface groups.62,63In the case of CNC particles bearing acidic sulfate ester groups, charging occurs due to the dissociation of H+or Na+ from surface sulfate groups as follows
−OSO H3 → −OSO3−+H+ (1) which leaves a negatively charged surface behind. Regardless of the charging mechanism, the final surface charge of co-ions is balanced by an equal, oppositely charged distribution of counterions. Both the surface charge and its compensating countercharge in solution form an electrical double layer, also called an electrical interfacial layer (EIL).62,63 Structure,
models, and theory of EIL are described in the literature, for example, by Kovacevic et al.64as well as by Israelashvili.62
In the present work, we study the solvation structure and thermodynamics of CNC particles in water and dilute aqueous NaCl electrolyte solutions and obtain the dependence of the solvation free energy on both particle charge and electrolyte concentration which affect the EIL structure around the CNC particles and subsequently its dispersion properties. For negatively charged CNC particles with surface sulfate anions, the dispersion is determined by the ion distribution around the CNC particle surface in contact with the aqueous electrolyte solution. The ions at the surface are, of course, mainly Na+
counterions attracted from the solution bulk to the negatively charged multivalent CNC particle until they almost balance out the negative surface charge. Within the qualitative picture of Manning’s counterion condensation theory, their excess concentration at the surface depends almost entirely on the CNC surface charge density but little on the bulk electrolyte concentration.62
In Figure 5, we present the isosurfaces of the 3D distribution functions at isovalue g(r) = 3.0 as well as their planar sections Figure 2.Planar sections (in the color bar scheme), across and along the particle, of the 3D distribution function of Na+around the neutral CNC particle: (A) before and (B) after 7 ns of MD sampling. Isosurfaces of the 3D distribution functions of Na+(in yellow) and Cl−(in gray) ions at an isovalue of 3.0 around the neutral CNC particle: (C) before and (D) after 7 ns of MD sampling.
(with values ranging between 0.0 and 3.0) for all of the components of the aqueous NaCl solution: Na+ and Cl−ions
and Ow and Hw water interaction sites. The 3D distribution
isosurfaces of Na+ions (shown in yellow) surround the particle
and are localized near the negatively charged sulfate groups, whereas the 3D distribution function of Cl− ions (shown in
gray) has pronounced depletion areas around the whole CNCq=−161=16 particle with the large negative charge and
particularly near its negatively charged sulfate groups. The 3D distribution functions of water Ow and Hw interaction sites
reflect the orientation of water molecules driven by the negative partial charge of Ow and positive partial charge of Hw. The
planar section shows water structuring at the CNC particle surface which decays into the uniform water distribution at a distance from the surface.
In Figure 6, we show the change in the SFE with charging of the CNC particle with respect to the SFE of the neutral one,
μ μ μ
Δsolv(CNC )q = solv(CNC )q − solv(CNCq=0) (2)
where subscript q refers to the charge of the CNC particle and μsolv(CNCq=0) is the SFE of the neutral particle. Calculations
were performed for the CNC particle in pure water (Figure 6A) and in aqueous NaCl solution at concentration 0.250 mol/kg (Figure 6B). The SFE change becomes more negative and therefore more favorable for CNC particles of higher surface charge density, as seen in Figure 6A,B.
Changes in SFE with electrolyte concentration are very important but rather small compared to the range of SFE values calculated for all of the particles in all of the solutions. To present the dependence of SFE on electrolyte concentration more informatively, we calculated its difference with respect to the SFE of the CNC particle with a particular charge in the 0.250 mol/kg NaCl solution, μsolv(CNCq=0)b=0.25
μ μ μ
Δ (CNC )q b = (CNC )q b − (CNC )q b=
solv solv solv 0.25 (3)
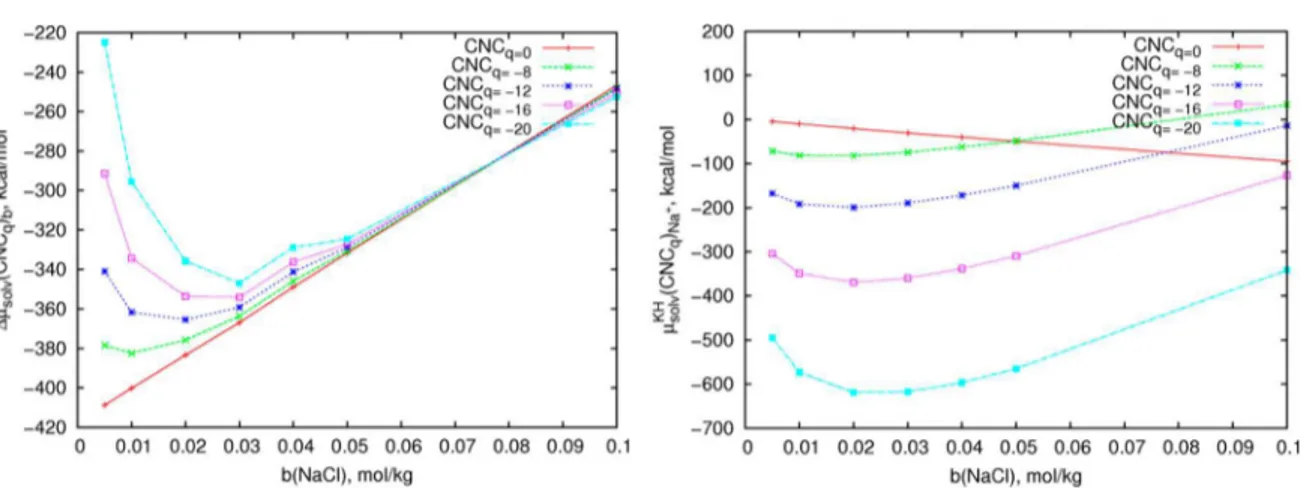
where subscript b refers to the NaCl concentration in mol/kg. In Figure 7A, each curve corresponds to the SFE of the CNC particle of a particular charge with respect to μsolv(CNCq)b=0.25.
Unlike Figure 6, the curve order does not reflect the SFE charge dependence but shows the SFE dependence on the Figure 3.(A) Schematic representation of the twisting angle (Φ) in the CNC central sheet. Φ is a torsion angle between the virtual bonds connecting the centers of mass of the residues (G) defined as follows:Φ+8= G(a;+8) − G(b,c;+8) − G(b,c;−8) − G(d;−8); Φ+7= G(a;+7) − G(b,c;+7) − G(b,c;−7) − G(d;−7);...Φ−8= G(a;−8) − G(b,c;−8) − G(b,c;+8) − G(d;+8).
25(B) Central sheet twisting angle for neutral and
charged particles with 16- and 32-residue chains.
Figure 4.Free energy of the CNCqparticles with charge q in aqueous
NaCl solutions of molality b (mol/kg) in the initial structure as well as after 100 ps and 7 ns of MD sampling. The free energy is the total energy of the CNC particle stripped from water and counterions calculated using the GLYCAM06 force field in AMBER11 plus the SFE calculated using 3D-RISM-KH.
NaCl solution molality ranging from 0.050 to 0.100 mol/kg. The curves of the SFE of a sulfated CNC particle with a specific charge against electrolyte concentration have minima, whereas
the SFE of the neutral CNC particle linearly increases with NaCl concentration (red line for CNCq=0in Figure 7A). The
position and depth of the SFE minimum for charged CNC particles depend on the surface charge density. The SFE minima shift from 0.010 mol/kg NaCl for CNCq=−81=16 to 0.030
mol/kg NaCl for CNCq=−201=16 . We attribute these minima
observed for charged particles to the most favorable conditions of solvation of a single sulfated CNCq particle in electrolyte
solution, also expressed as the most effective solvation. The 3D-RISM-KH theory allows us to decompose the total SFE into the partial contributions from the water Ow and Hw
interaction sites and from Na+ and Cl− ions. This analysis
shows that the contribution μsolv(CNCq)Na+from Na+correlates
to the total SFE behavior with the NaCl concentration (Figure 7B). Increasing the NaCl concentration lowers the μsolv(CNCq)Na+ down to a minimum at a particular NaCl
concentration which is better defined for highly charged CNC particles. Further increases in the NaCl concentration result in increasing values of μsolv(CNCq)Na+ (Figure 7B). The Na+
contributions to the SFE (Figure 7B) correlate to the total SFE trend (Figure 7A). In solution with the NaCl concentration corresponding to the SFE minimum, the number of Na+ions attracted to the electric interfacial layer around the
CNC particle suffices to balance out the CNC particle surface charge. An increase in the electrolyte concentration shrinks the electric interfacial layer and therefore decreases the range and strength of the Debye-screened effective electrostatic repulsion between charged CNC particles.
This effect is visualized in Figure 8 for the planar sections of the 3D maps of the Na+ distribution function g
Na+(r) around
the CNCq=−161=16 particle in the solutions of different ionic
strengths. The layer of gNa+(r) >1 considerably shrinks with
increases in the electrolyte concentration. A grid of distances from the particle surface is added to visualize the Debye screening length in the aqueous NaCl solutions for each of the ionic strengths under consideration (Table 2). It is seen that the Na+ density enhancement g
Na+(r) >1 falls off within the
Debye length separation from the CNC surface. For the shortest Debye screening length of 9.6 Å in the 0.250 mol/kg NaCl aqueous solution, noticeable enhancements (maxima) of
gNa+(r) over the bulk value fall into the 10 Å distance from the
CNC particle surface. The 0.01 mol/kg NaCl aqueous solution with low ionic strength has a considerably larger Debye screening length of 30 Å, and the distribution function gNa+(r)
Figure 5.Planar section, across the particle, of the 3D distribution functions of Na+and Cl−ions and water oxygen and hydrogen (parts A−D, respectively) around the particle with chain length l = 16 and charge q = −16 in a 0.030 mol/kg NaCl aqueous solution. CNC particle after 7 ns of MD sampling. Shown also are the isosurfaces of the 3D distribution functions at isovalue 3.0, colored according to the section color scheme bar.
Figure 6.Change in the solvation free energyΔμsolvwith particle charge q for CNC particles in pure water (left panel) and in aqueous NaCl solution at concentrations of 0.005−0.250 mol/kg (right panel), compared to μsolvof neutral CNC particles in pure water.
turns out to be relatively high within the 30 Å separation from the CNC particle surface but quickly falls off to the bulk value beyond that layer. Notice that although with a decrease in solution ionic strength the distribution function gNa+(r) in the
electric interfacial layer increases, the number density of Na+
ions given by cgNa+(r) drops due to the decrease in molarity c.
On the other hand, the electric interfacial layer thickness increases proportionally to the Debye screening length and so is inversely proportional to the square root of the decreasing ionic strength I or molarity c. As a result, the excess number of Na+counterions over the whole electrical interfacial layer stays
almost the same to neutralize the CNC particle charge.
■
CONCLUSIONSWe found that MD relaxation of neutral and charged CNC particles in explicit water solvent induces many changes in the structure and charge distribution of the particles. The macrodipole charge polarization across the unrelaxed particle with the opposite surface charge density on its faces due to the localization of like atomic surface charges on each of the faces disappears upon the relaxation and turns into a mesh of quickly
alternating local atomic surface charges. This significantly affects the distribution of screening ions around the CNC in electrolyte solution and decreases the system free energy, the latter comprising the CNC solvation free energy and the interaction potential between CNC chains (including hydrogen bonds). A comparison of the twisting degree for neutral and charged CNC shows that the surface charge does not noticeably affect the degree of twisting.
For the Iα CNC particles with the relaxed surface charge
distribution obtained with 7 ns MD sampling, we further explored its solvation thermodynamics by using the 3D-RISM-KH molecular theory of solvation for the relaxed CNC particles in pure ambient water and in aqueous NaCl electrolyte solutions of concentration ranging from 0.01 to 0.25 mol/kg. We found that the SFE of the charged sulfated CNC particles has a minimum for a particular electrolyte concentration depending on the particle surface charge density, whereas the solvation free energy of the neutral particle increases linearly with NaCl concentration. The contribution of Na+ions to the
solvation free energy exhibits behavior similar to the NaCl concentration dependence of the whole solvation free energy. This behavior is yet to be explored by experimental researchers for CNC particles with different charges, either by controlling acid group protonation or by using CNC particles stabilized in solution using different charged surface groups, e.g., carboxylate groups. It is worth noting that the depth of the minima shown in Figure 7 is rather low compared to the total SFE shown in Figure 6 and would require highly accurate measurements to verify. The study of Zhong et al.65 reports on the colloidal stability of CNC in aqueous electrolyte solutions but does not address the effect of surface charge. An analysis of the 3D maps of the Na+ distribution functions showed that the model
particles developed in the present work reproduce the behavior of charged colloid particles in electrolyte solutions: at higher ionic strength, the electric interfacial layer shrinks and the effective repulsion between charged but Debye-screened CNC particles becomes short-ranged and weaker. The dependence of the interfacial electric layer structure/thickness on electrolyte concentration plays an important role in the mechanisms of phase transitions in CNC suspensions, as the weakening of the effective repulsion between charged CNC particles with compression of the interfacial electric layer at higher ionic strength affects their phase equilibrium and chiral ordering.21
This theoretical modeling approach provides CNC particle models and simulation procedures for the future study of CNC Figure 7.(Left) DifferenceΔμsolv(CNCq)bof the solvation free energy of CNCqparticles with charge q in an aqueous NaCl solution of molarity b
(mol/kg) compared to that in pure water. (Right) Contribution of Na+ions’ μ
solv(CNCq)Na+to the solvation free energy.
Figure 8. Compression of the electric interfacial layer around a charged CNC16 particle with the NaCl concentration increase from 0.01 to 0.25 mol/kg. Planar section of the 3D distribution function
interactions and ordered phase formation in electrolyte solutions. In this model, the nature and concentration of electrolytes can be readily tuned, and their effect on the strength of interparticle effective interactions can be identified. The 3D-RISM-KH molecular theory of solvation yields the solvation thermodynamics by statistical mechanical sampling of equilibrium arrangements of solvent and ions around CNC particles, which is extremely challenging for molecular simulations.
The 3D-RISM-KH method predicts molecular recognition interactions in solution48 and could help improve the compatibilization of CNC with matrix polymers so as to enhance the CNC loading levels in composites, hydrogels, and foams. For example, insights from modeling into the mechanism of action of cationization agents17 could help further enhance the dispersion, gelation, and rheological properties of modified CNC. Furthermore, structure relaxation sampling followed by 3D-RISM-KH calculations can accurately predict the degree and type of CNC surface modifications necessary to achieve dispersion in polymer solutions while preserving the desired crystallinity and mechanical properties. A multiscale computational modeling platform that enables such predictions from the first principles is being developed, with the aim of rationally designing advanced materials.66
■
ASSOCIATED CONTENT*
S Supporting InformationOverview of the 3D-RISM-KH molecular theory of solvation and its applications. The Supporting Information is available free of charge on the ACS Publications website at DOI: 10.1021/acs.langmuir.5b00680.
■
AUTHOR INFORMATIONCorresponding Author
*E-mail: andriy.kovalenko@nrc-cnrc.gc.ca. Notes
The authors declare no competing financial interest.
■
ACKNOWLEDGMENTSThis work was supported by ArboraNano − Business-led Canadian Forest NanoProducts Network, Alberta Innovates Bio Solutions (AIBio), NanoAccelerator Program at Alberta Innovates Technology Futures (AITF), University of Alberta, and National Institute for Nanotechnology (NINT). We are grateful to Dr. Ted Szabo, Director of Forest Products Innovation at AIBio, Steve Price, Executive Director of the Advancing the Bioeconomy Sector at AIBio, Dr. Ron Crotogino, President and CEO of ArboraNano, Dr. Nicole Poirier, Scientific Director of ArboraNano, Dr. Robert Jost, team leader of Cellulose and Hemicellulose Processing at AITF, and Prof. Yaman Boluk, Nanofibre Chair in Forest Products at the University of Alberta and Research Officer at NINT. We acknowledge Dr. Nikolay Blinov for postprocessing the MD results during peer review. We thank Dr. Javier Cuervo for discussions in the initial stage of the project. S.R.S. thanks Dr. John M. Villegas for fruitful discussions. The high-performance computing resources were provided by WestGrid − Compute/ Calcul Canada national advanced computing platform and by NINT’s High Performance Computing Facility.
■
REFERENCES(1) Habibi, Y.; Lucia, L. A.; Rojas, O. J. Cellulose Nanocrystals: Chemistry, Self-assembly, and Applications. Chem. Rev. 2010, 110, 3479−3500.
(2) Moon, R. J.; Martini, A.; Nairn, J.; Simonsen, J.; Youngblood, J. Cellulose Nanomaterials Review: Structure, Properties and Nano-composites. Chem. Soc. Rev. 2011, 40, 3941−3994.
(3) Postek, M. T.; Vladar, A.; Dagata, J.; Farkas, N.; Ming, B. Cellulose Nanocrystals the Next Big Nano-thing? Proc. SPIE 2008,
7042, 70420D.
(4) Dong, X. M.; Gray, D. G. Effect of Counterions on Ordered Phase Formation in Suspensions of Charged Rodlike Cellulose Crystallites. Langmuir 1997, 13, 2404−2409.
(5) Beck, S.; Bouchard, J.; Berry, R. Dispersibility in Water of Dried Nanocrystalline Cellulose. Biomacromolecules 2012, 13, 1486−1494.
(6) Lahiji, R. R.; Xu, X.; Reifenberger, R.; Raman, A.; Rudie, A.; Moon, R. J. Atomic Force Microscopy Characterization of Cellulose Nanocrystals. Langmuir 2010, 26, 4480−4488 and references therin.. (7) Siqueira, G.; Bras, J.; Dufresne, A. Cellulosic Bionanocomposites: A Review of Preparation, Properties and Applications. Polymers 2010,
2, 728−765.
(8) Khan, R. A.; Beck, S.; Dussault, D.; Salmieri, S.; Bouchard, J.; Lacroix, M. Mechanical and Barrier Properties of Nanocrystalline Cellulose Reinforced Poly(caprolactone) Composites: Effect of Gamma Radiation. J. Appl. Polym. Sci. 2013, 129, 3038−3046.
(9) Zainuddin, S. Y. Z.; Ahmad, I.; Kargarzadeh, H.; Abdullah, I.; Dufresne, A. Potential of using multiscale kenaf fibers as reinforcing filler in cassava starch-kenaf biocomposites. Carbohydr. Polym. 2013,
92, 2299−2305.
(10) Abitbol, T.; Johnstone, T.; Quinn, T. M.; Gray, D. G. Reinforcement with Cellulose Nanocrystals of Poly(vinyl alcohol) Hydrogels Prepared by Cyclic Freezing and Thawing. Soft Matter 2011, 7, 2373−2379.
(11) Kelly, J. A.; Shukaliak, A. M.; Cheung, C. C. Y.; Shopsowitz, K. E.; Hamad, W. Y.; MacLachlan, M. J. Responsive Photonic Hydrogels Based on Nanocrystalline Cellulose. Angew. Chem., Int. Ed. 2013, 52, 8912−8916.
(12) Lin, N.; Dufresne, A. Supramolecular Hydrogels from In Situ Host−Guest Inclusion between Chemically Modified Cellulose Nanocrystals and Cyclodextrin. Biomacromolecules 2013, 14, 871−880. (13) Wik, V. M.; Aranguren, M. I.; Mosiewicki, M. A. Castor Oil-based Polyurethanes Containing Cellulose Nanocrystals. Polymer Eng.
Sci. 2011, 51, 1389−1396.
(14) Holt, B. L.; Stoyanov, S. D.; Pelan, E.; Paunov, V. N. Novel Anisotropic Materials from Functionalised Colloidal Cellulose and Cellulose Derivatives. J. Mater. Chem. 2010, 20, 10058−10070.
(15) Zhang, Y. P.; Chodavarapu, V. P.; Kirk, A. G.; Andrews, M. P. Nanocrystalline Cellulose for Covert Optical Encryption. J.
Nano-photon. 2012, 6, 063516.
(16) Picard, G.; Simon, D.; Kadiri, Y.; LeBreux, J. D.; Ghozayel, F. Cellulose Nanocrystal Iridescence: A New Model. Langmuir 2012, 28, 14799−14807.
(17) Hasani, M.; Cranston, E. D.; Estman, G.; Gray, D. G. Cationic Surface Functionalization of Cellulose Nanocrystals. Soft Matter 2008,
4, 2238−2244.
(18) Araki, J.; Wada, M.; Kuga, S. Steric Stabilization of a Cellulose Microcrystal Suspension by Poly(ethylene glycol) Grafting. Langmuir 2001, 17, 21−27.
(19) Montanari, S.; Roumani, M.; Heux, L.; Vignon, M. R. Topochemistry of Carboxylated Cellulose Nanocrystals Resulting from TEMPO-Mediated Oxidation. Macromolecules 2005, 38, 1665− 1671.
(20) Gousse, C.; Chanzy, H.; Excoffier, G.; Soubeyrand, L.; Fleury, E. Stable Suspensions of Partially Silylated Cellulose Whiskers Dispersed in Organic Solvents. Polymer 2002, 43, 2645−2651.
(21) Dong, X. M.; Kimura, T.; Revol, J. F.; Gray, D. G. Effects of Ionic Strength on the Isotropic−Chiral Nematic Phase Transition of Suspensions of Cellulose Crystallites. Langmuir 1996, 12, 2076−2082.
(22) Beck, S.; Bouchard, J.; Berry, R. Controlling the Reflection Wavelength of Iridescent Solid Films of Nanocrystalline Cellulose.
Biomacromolecules 2011, 12, 167−172.
(23) Shopsowitz, K. E.; Hamad, W. Y.; MacLachlan, M. J. Flexible and Iridescent Chiral Nematic Mesoporous Organosilica Films. J. Am.
Chem. Soc. 2012, 134, 867−870.
(24) Boluk, Y.; Zhao, L.; Incani, V. Dispersions of Nanocrystalline Cellulose in Aqueous Polymer Solutions: Structure Formation of Colloidal Rods. Langmuir 2012, 28, 6114−6123.
(25) Yui, T.; Hayashi, S. Molecular Dynamics Simulations of Solvated Crystal Models of Cellulose Iα and IIII. Biomacromolecules 2007, 8, 817−824.
(26) Matthews, J. F.; Skopec, C. E.; Mason, P. E.; Zuccato, P.; Torget, R. W.; Sugiyama, J.; Himmel, M. E.; Brady, J. W. Computer Simulation Studies of Microcrystalline Cellulose Iβ. Carbohydr. Res. 2006, 341, 138−152.
(27) Paavilainen, S.; Rog, T.; Vattulainen, I. Analysis of Twisting of Cellulose Nanofibrils in Atomistic Molecular Dynamics Simulations. J.
Phys. Chem. B 2011, 115, 3747−3755.
(28) Matthews, J. F.; Bergenstråhle, M.; Beckham, G. T.; Himmel, M. E.; Nimlos, M. R.; Brady, J. W.; Crowley, M. F. High-Temperature Behavior of Cellulose I. J. Phys. Chem. B 2011, 115, 2155−2166.
(29) Matthews, J. F.; Beckham, G. T.; Bergenstråhle-Wohlert, M.; Brady, J. W.; Himmel, M. E.; Crowley, M. F. Comparison of Cellulose Iβ Simulations with Three Carbohydrate Force Fields. J. Chem. Theory
Comput. 2012, 8, 735−748.
(30) Palma, R.; Zuccato, P.; Himmel, M. E.; Liang, G.; Brady, J. W. In
Glycosyl Hydrolases in Biomass Conversion; Himmel, M. E., Ed.;
American Chemical Society: Washington, DC, 2000; pp 112−130. (31) Kuttel, M.; Brady, J. W.; Naidoo, K. J. Carbohydrate Solution Simulations: Producing a Force Field with Experimentally Consistent Primary Alcohol Rotational Frequencies and Populations. J. Comput.
Chem. 2002, 23, 1236−1243.
(32) Guvench, O.; Greene, S. N.; Kamath, G.; Brady, J. W.; Venable, R. M.; Pastor, R. W.; Mackerell, A. D. Additive Empirical Force Field for Hexopyranose Monosaccharides. J. Comput. Chem. 2008, 29, 2543−2564.
(33) Guvench, O.; Hatcher, E.; Venable, R.; Pastor, R. W.; Mackerell, A. D. CHARMM Additive All-Atom Force Field for Glycosidic Linkages between Hexopyranoses. J. Chem. Theory Comput. 2009, 5, 2353.
(34) Kirschner, K. N.; Yongye, A. B.; Tschampel, S. M.; Gonza ́lez-Outeiriño, J.; Daniels, C. R.; Foley, B. L.; Woods, R. J. GLYCAM06: A Generalizable Biomolecular Force Field. Carbohydrates. J. Comput.
Chem. 2008, 29, 622−655.
(35) Damm, W.; Frontera, A.; Tirado-Rives, J.; Jorgensen, W. L. OPLS All-atom Force Field for Carbohydrates. J. Comput. Chem. 1997,
18, 1955.
(36) Elazzouzi-Hafraoui, S.; Nishiyama, Y.; Putaux, J.; Heux, L.; Dubreuil, F.; Rochas, C. The Shape and Size Distribution of Crystalline Nanoparticles Prepared by Acid Hydrolysis of Native Cellulose. Biomacromolecules 2008, 9, 57−65.
(37) Hanley, S.; Revol, J.; Godbout, L.; Gray, D. Atomic Force Microscopy and Transmission Electron Microscopy of Cellulose from Micrasterias Denticulata; Evidence for a Chiral Helical Microfibril Twist. Cellulose 1997, 4, 209−220.
(38) Bu, L.; Himmel, M. E.; Crowley, M. F. The Molecular Origins of Twist in Cellulose I-beta. Carbohydr. Polym. 2015, 125, 146−152.
(39) Hadden, J. A.; French, A. D.; Woods, R. J. Unraveling Cellulose Microfibrils: A Twisted Tale. Biopolymers 2013, 99, 746−756.
(40) Kovalenko, A. Three-Dimensional RISM Theory for Molecular Liquids and Solid-Liquid Interfaces. In Molecular Theory of Solvation:
Understanding Chemical Reactivity; Hirata, F., Ed.; Kluwer Academic
Publishers: Dordrecht, The Netherlands, 2003; pp 169−275. (41) Kovalenko, A.; Hirata, F. Potentials of Mean Force of Simple Ions in Ambient Aqueous Solution. I: Three-dimensional Reference Interaction Site Model Approach. J. Chem. Phys. 2000, 112, 10391− 10402.
(42) Kovalenko, A.; Hirata, F. Potentials of Mean Force of Simple Ions in Ambient Aqueous Solution. II: Solvation Structure from the Three-dimensional Reference Interaction Site Model Approach, and Comparison with Simulations. J. Chem. Phys. 2000, 112, 10403− 10417.
(43) Gusarov, S.; Pujari, B. S.; Kovalenko, A. Efficient Treatment of Solvation Shells in 3D Molecular Theory of Solvation. J. Comput.
Chem. 2012, 33, 1478−1494.
(44) Kovalenko, A. Multiscale Modeling of Solvation in Chemical and Biological Nanosystems and in Nanoporous Materials. Pure Appl.
Chem. 2013, 85, 159−199.
(45) Yoshida, K.; Yamaguchi, T.; Kovalenko, A.; Hirata, F. Structure of tert-Butyl Alcohol−Water Mixtures Studied by the RISM Theory. J.
Phys. Chem. B 2002, 106, 5042−5049.
(46) Kovalenko, A.; Hirata, F. Towards a Molecular Theory for the van der Waals-Maxwell Description of Fluid Phase Transitions. J.
Theor. Comput. Chem. 2002, 1, 381−486.
(47) Costa, L. M.; Hayaki, S.; Stoyanov, S. R.; Gusarov, S.; Tan, X.; Gray, M. R.; Stryker, J. M.; Tykwinski, R.; Carneiro, J. W. M.; Sato, H.; Seidl, P. R.; Kovalenko, A. 3D-RISM-KH Molecular Theory of Solvation and Density Functional Theory Investigation of the Role of Water in the Aggregation of Model Asphaltenes. Phys. Chem. Chem.
Phys. 2012, 14, 3922−3934.
(48) Huang, W.-J.; Dedzo, G. K.; Stoyanov, S. R.; Lyubimova, O.; Gusarov, S.; Singh, S.; Lao, H.; Kovalenko, A.; Detellier, C. Molecule-Surface Recognition between Heterocyclic Aromatic Compounds and Kaolinite in Toluene Investigated by Molecular Theory of Solvation and Thermodynamic and Kinetic Experiments. J. Phys. Chem. C 2014,
118, 23821−23834.
(49) Kovalenko, A.; Kobryn, A. E.; Gusarov, S.; Lyubimova, O.; Liu, X.; Blinov, N.; Yoshida, M. Molecular Theory of Solvation for Supramolecules and Soft Matter Structures: Application to Ligand Binding, Ion Channels, and Oligomeric Polyelectrolyte Gelators. Soft
Matter 2012, 8, 1508−1520.
(50) Stumpe, M. C.; Blinov, N.; Wishart, D.; Kovalenko, A.; Pande, V. S. Calculation of Local Water Densities in Biological Systems - A Comparison of Molecular Dynamics Simulations and the 3D-RISM Molecular Theory of Solvation. J. Phys. Chem. B 2011, 115, 319−328. (51) Kimura, K.; Ido, I.; Oyabu, N.; Kobayashi, K.; Hirata, Y.; Imai, T.; Yamada, H. Visualizing Water Molecule Distribution by Atomic Force Microscopy. J. Chem. Phys. 2010, 132, 194705.
(52) Johnson, R. S.; Yamazaki, T.; Kovalenko, A.; Fenniri, H. Molecular Basis for Water-Promoted Supramolecular Chirality Inversion in Helical Rosette Nanotubes. J. Am. Chem. Soc. 2007,
129, 5735−5743.
(53) Yamazaki, T.; Kovalenko, A. Spatial Decomposition Analysis of the Thermodynamics of Cyclodextrin Complexation. J. Chem. Theory
Comput. 2009, 5, 1723−1730.
(54) Silveira, R. L.; Stoyanov, S. R.; Gusarov, S.; Skaf, M. S.; Kovalenko, A. Plant Biomass Recalcitrance: Effect of Hemicellulose Composition on Nanoscale Forces that Control Cell Wall Strength. J.
Am. Chem. Soc. 2013, 135, 19048−19051.
(55) Berendsen, H. J. C.; Grigera, J. R.; Straatsma, T. P. The Missing Term in Effective Pair Potentials. J. Phys. Chem. 1987, 91, 6269−6271. (56) Koneshan, S.; Rasaiah, J. C.; Lynden-Bell, R. M.; Lee, S. H. Solvent Structure, Dynamics, and Ion Mobility in Aqueous Solutions at 25°C. J. Phys. Chem. B 1998, 102, 4193−4204.
(57) Case, D. A.; Darden, T. A.; Cheatham, T. E., III; Simmerling, C. L.; Wang, J.; Duke, R. E.; Luo, R.; Walker, R. C.; Zhang, W.; Merz, K. M.; Roberts, B.; Wang, B.; Hayik, S.; Roitberg, A.; Seabra, G.; Kolossváry, I.; Wong, K. F.; Paesani, F.; Vanicek, J.; Liu, J.; Wu, X.; Brozell, S. R.; Steinbrecher, T.; Gohlke, H.; Cai, Q.; Ye, X.; Wang, J.; Hsieh, M.-J.; Cui, G.; Roe, D. R.; Mathews, D. H.; Seetin, M. G.; Sagui, C.; Babin, V.; Luchko, T.; Gusarov, S.; Kovalenko, A.; Kollman, P. A.
AMBER 11; University of California: San Francisco, 2010.
(58) Nishiyama, Y.; Sugiyama, J.; Chanzy, H.; Langan, P. Crystal Structure and Hydrogen Bonding System in Cellulose Iα from Synchrotron X-ray and Neutron Fiber Diffraction. J. Am. Chem. Soc. 2003, 125, 14300−14306.
(59) Sacui, I. A.; Nieuwendaal, R. C.; Burnett, D. J.; Stranick, S. J.; Jorfi, M.; Weder, C.; Foster, E. J.; Olsson, R. T.; Gilman, J. W. Comparison of the Properties of Cellulose Nanocrystals and Cellulose Nanofibrils Isolated from Bacteria, Tunicate, and Wood Processed Using Acid, Enzymatic, Mechanical, and Oxidative Methods. ACS
Appl. Mater. Interface 2014, 6, 6127−6138.
(60) Jiang, F.; Esker, A. R.; Roman, M. Acid-catalyzed and Solvolytic Desulfation of H2SO4-hydrolyzed Cellulose Nanocrystals. Langmuir 2010, 26, 17919−17925.
(61) Rogers, P. S. Z.; Pitzer, K. S. Volumetric Properties of Aqueous Sodium Chloride Solutions. J. Phys. Chem. Ref. Data 1982, 11, 15−81. (62) Israelachvili, J. N. Intermolecular and Surface Forces; Academic Press, 1985.
(63) Delgado, A. V.; Arroyo, F. J. Electrokinetic Phenomena and Their Experimental Determination: An Overview. In Interfacial
Electrokinetics and Electrophoresis; Delgado, A. V., Ed.; Marcel Dekker:
New York, 2002; pp 1−54.
(64) Kovacevic, D.; Cop. A.; Kallay, N. Evaluation and Usage of Electrostatic Potentials in the Interfacial Layer. In Interfacial
Electrokinetics and Electrophoresis; Delgado, A. V., Ed.; Marcel Dekker:
New York, 2002; pp 99−121.
(65) Zhong, L.; Fu, S.; Peng, X.; Zhan, H.; Sun, R. Colloidal Stability of Negatively Charged Cellulose Nanocrystalline in Aqueous Systems.
Carbohydr. Polym. 2012, 90, 644−649.
(66) Stoyanov, S. R.; Kovalenko, A. Multiscale Computational Modeling: From Heavy Petroleum to Biomass Valorization. GSTF J.