Publisher’s version / Version de l'éditeur:
Proceedings of the ASME Turbo Expo 2011, 2011
READ THESE TERMS AND CONDITIONS CAREFULLY BEFORE USING THIS WEBSITE.
https://nrc-publications.canada.ca/eng/copyright
Vous avez des questions? Nous pouvons vous aider. Pour communiquer directement avec un auteur, consultez la première page de la revue dans laquelle son article a été publié afin de trouver ses coordonnées. Si vous n’arrivez pas à les repérer, communiquez avec nous à [email protected].
Questions? Contact the NRC Publications Archive team at
[email protected]. If you wish to email the authors directly, please see the first page of the publication for their contact information.
NRC Publications Archive
Archives des publications du CNRC
This publication could be one of several versions: author’s original, accepted manuscript or the publisher’s version. / La version de cette publication peut être l’une des suivantes : la version prépublication de l’auteur, la version acceptée du manuscrit ou la version de l’éditeur.
For the publisher’s version, please access the DOI link below./ Pour consulter la version de l’éditeur, utilisez le lien DOI ci-dessous.
https://doi.org/10.1115/GT2011-45132
Access and use of this website and the material on it are subject to the Terms and Conditions set forth at
Altitude performance of a turbojet with alternate fuels
Davison, Craig R.; Chishty, Wajid A.
https://publications-cnrc.canada.ca/fra/droits
L’accès à ce site Web et l’utilisation de son contenu sont assujettis aux conditions présentées dans le site LISEZ CES CONDITIONS ATTENTIVEMENT AVANT D’UTILISER CE SITE WEB.
NRC Publications Record / Notice d'Archives des publications de CNRC:
https://nrc-publications.canada.ca/eng/view/object/?id=87cc88b3-4b70-4a89-b923-addd0e9b02f8 https://publications-cnrc.canada.ca/fra/voir/objet/?id=87cc88b3-4b70-4a89-b923-addd0e9b02f8ALTITUDE PERFORMANCE OF A TURBOJET WITH ALTERNATE FUELS
Craig R. Davison Wajid A. Chishty
Gas Turbine Laboratory Institute for Aerospace Research National Research Council Canada
Ottawa, Ontario, Canada ABSTRACT
To enhance energy security and reduce the environmental impact of aviation, alternate fuels derived from various non-petroleum based sources are being developed. Currently alternate fuels are produced to match the properties of existing jet fuels allowing the new fuels to be used in current fleets concurrently with traditional jet fuel. The alternate fuels must, therefore, perform as well as the traditional fuels through the entire operating envelope.
This paper provides the results of performance testing in an altitude chamber up to 11,300 m (35,000 feet) with a simulated forward speed up to Mach 0.75. The test engine was an instrumented 1.15 kN thrust turbojet burning conventional Jet A-1 as a baseline; a semi-synthetic blend of camelina based hydro processed renewable jet and JP8; a blend of 50% Fischer-Tropsch synthetic paraffinic kerosene and 50% JP8; and a 100% Fischer-Tropsch synthetic paraffinic kerosene. Both steady state and transient performance are presented.
The theoretical effect of the alternate fuels for a simple idealized Brayton cycle is also presented. The work was conducted as part of on-going efforts by departments within the Government of Canada to systematically assess alternative aviation fuels.
INTRODUCTION
To reduce detrimental effects on the environment and decrease dependence on crude oil, alternate fuels for gas turbines have become topics of great interest in recent years. The environmental effect of an alternate fuel requires a detailed study on the complete life cycle of the fuel and the resulting emissions from the engine. No attempt is made in this study to assess the overall environmental impact of the fuels based on the life cycle. Neither is it the objective of this paper to present the resulting emissions from the alternate fuels. Emissions results for this program are presented in a companion paper [1].
Alternate fuels improve energy independence by allowing countries with limited oil reserves to utilize coal or feedstock based fuels. While this reduces dependence on external sources of oil, it can have detrimental environmental effects and negatively impact food supplies and prices. While other fuel sources, such as algae, are being developed that will reduce the problems associated with the current feedstock sources of fuel it is not the objective of this paper to examine either the utility or ethics of alternate fuel sources at either an environmental or societal level.
This paper reports on the performance of alternate fuels in a small turbojet engine at altitude and with forward velocities that would be encountered in normal operation of commercial aircraft. The object was to determine if a detrimental effect on engine operation should be expected if a switch to an alternate fuel is made.
It is well known that increasing the hydrogen to carbon ratio in a fuel improves the efficiency of the energy extraction from the combustion products. This occurs because the combustion gases from the different fuels have different compositions of species with varying specific heats and ratios of specific heats as shown in table 1. Higher values of both specific heat and the ratio of specific heats, result in greater energy extraction during the expansion stage for a given mass flow, inlet temperature and pressure ratio.
Higher hydrogen to carbon ratio implies lower carbon content in the fuel, and results in less CO2 and more H2O in the
combustion products, which in turn results in higher specific heat and ratio of specific heat. The ideal work extraction through an expansion for each gas is also shown in table 1. The H2O is more than double that of the CO2, which has the lowest
extraction rate of the four gasses. Although the potential for dramatic change is present it is not seen due to the small differences between fuels and the large dilution with air found in gas turbines.
Proceedings of ASME Turbo Expo 2011 GT2011 June 6-10, 2011, Vancouver, British Columbia, Canada
Table 1: Properties of combustion products at 527°C [2, 3] with work extracted for ideal expansion with pressure ratio of 4 and inlet temperature of 527°C
N2 O2 H2O CO2
Cp (kJ/kg-K) 1.121 1.054 2.152 1.169
1.360 1.327 1.273 1.193
Work (kJ/kg) 275 244 443 188
Bester and Yates reported Fischer-Tropsch fuels providing a significant improvement in the performance of a turbo-shaft engine at ground level. They attributed the improved performance to improved combustion product properties, improved combustion efficiency and reduced fluid friction losses [4]. This study looks at a simpler turbojet engine and considers the effects of altitude on the overall performance.
Nomenclature
A Area
C Velocity
Cp Constant pressure specific heat
CI Confidence interval D Diameter
EGT Exhaust gas temperature F Thrust
FAR Fuel to air ratio FHV Heating value LHV Lower heating value Ma Mach number
Mass flow N Rotational speed PLA Power lever angle PR Pressure ratio p Pressure
R Gas constant (Universal gas constant/Molecular weight)
SFC Specific fuel consumption T Temperature
Ratio of specific heats Subscripts
1-6 Station numbers Amb Ambient o Total conditions c Corrected parameter
D Design or reference condition
G Gross
PROCEDURE
Test Engine and Installation
The test engine was a Microturbo TRS-18-046-1. This is a simple turbojet comprising of a single stage radial compressor and a single stage axial turbine. Its rated thrust is 1.15 kN (260 lbs). Although simple, it is a fully functional gas turbine with applications in UAVs, drones, missiles and light aircraft [5]. The size allows it to be operated in a small altitude
chamber that is relatively inexpensive to operate. This permits cost effective research to identify areas for future work applicable to diverse propulsion systems.
Small engines are an adequate model of larger versions. Davison and Birk provide a comparison of a very small turbojet, with a thrust of 95 N (21.4 lbs), to larger engines and concluded that it well represented the behavior of the larger engine in terms of performance changes across the range of engine power [6]. As the TRS-18 has a thrust an order of magnitude larger it would be expected to compare more favorably to larger engines.
This TRS-18 has the following operating envelope [5]: Forward Speed: 0 to 0.9 Mach
Altitude: 0 to 10,000 m (0 to 32,800 feet) Temperature: -30 to 50°C (-22 to 122°F)
Figure 1 shows the thermodynamic schematic of the TRS-18 engine and the relevant station numbers used in this paper. Station 1 is inside the test cell inlet plenum installed to generate the required total pressure increase at the engine inlet to simulate the aircraft forward velocity. Figure 2 shows the bellmouth installed at the engine inlet to determine mass flow and the inlet plenum installed in the altitude chamber.
The bill of materials engine control system was used with no modifications made for any of the fuels. At idle the control system determines the pump speed, which sets the volumetric fuel flow, based on the static pressure at station 2. The fuel flow is linked to the power lever angle position (PLA) independent of altitude. Therefore, the engine is unresponsive to the PLA until the angle corresponding to idle fuel flow is exceeded. Cmp Turb Comb Noz Inlet 1 2 3 4 6 5 Fuel
Figure 2: TRS-18 installed in altitude test chamber
Measured Parameters
The standard instrumentation on this engine consisted of: 1. Static pressure at the compressor inlet
2. Exhaust gas temperature 3. Rotational speed
These were augmented for this test series with the following measurements:
1. Total pressure in inlet plenum 2. Total pressure at compressor inlet
3. Total and static pressure at compressor discharge 4. Total temperature at compressor discharge 5. Total temperature at combustor midpoint 6. Total pressure at turbine inlet
7. Total temperature at turbine inlet 8. Total pressure at turbine discharge 9. Total temperature at turbine discharge
10. Total and static pressure at propelling nozzle exit 11. Total temperature at propelling nozzle exit 12. Emissions at propelling nozzle exit
At all stations internal to the engine the flow area blockage due to the probes was less than 2%, to maintain an insignificant effect on the flow [7]. The emissions measurement, however, required a 6.4 mm (0.25 inch) diameter sampling tube running across the exit of the propelling nozzle. This resulted in a 7.6% flow blockage which was expected to degrade the engine performance consistently, but the primary objective was to compare the performance of the fuels, and so this was an acceptable compromise. The exit of the propelling nozzle is shown in figure 3. The emissions sampling tube can be seen running down the middle of the exit through the extension to the exit built to support the probes.
Figure 3: Propelling nozzle exit (station 6) showing emissions sampling and pressure and temeprature probes Test Conditions
The National Research Council Canada (NRC) altitude chamber simulates operations up to 14,000 m (46,000 feet) at temperatures down to -50 C (-58 F) with conditioned air flow up to 3 kg/s (6.6 lb/s). This covers the entire operating range of the TRS-18 engine and allowed operation beyond its rated conditions.
Performance tests were conducted from 1,500 m (5,000 feet) to 11,300 m (37,000 feet). At each altitude steady state points were recorded from idle to the exhaust gas temperature (EGT) limit for the engine. The ambient conditions at each test altitude are given in table 2. The engine rotational speeds achieved at each altitude are given in table 3. In addition to the steady state points, engine slams, which accelerated the engine from idle to the max EGT, were performed at 3,000 m and 6,100 m. For this maneuver the PLA movement was completed in less than 0.6 s. Engine starts were also performed at 3,000 m.
Table 2: Operating conditions including ambient conditions, rotational speed and ram pressure above ambient with equivalent forward Mach number
Pressure Altitude (m) Inlet Temp. (°C) Idle Speed (kRPM) Max. Speed (kRPM) Ram Pressure (kPa) Equiv. Mach 1,481±73 7±1 26.91±0.06 40.9±0.2 7.1±1.2 0.34 3,051±60 -5±1 27.7±0.7 41.0±0.2 8.9±0.7 0.42 6,137±95 -25±2 32.9±0.6 40.7±0.3 9.3±0.6 0.52 9,136±73 -30±2 36.2±0.4 38.8±1.1 9.6±0.4 0.64 11,268±23 -31±1 38.1±0.3 38.1±0.3 9.9±0.2 0.75 Inlet Plenum Inlet Bellmouth Emissions sampling probe Temperature and
pitot-static probes Exhaust extension
Table 3: Engine operating speeds obtained at altitude Altitude (m, (feet)) Engine Speeds (kRPM)
1,500 (5,000) Idle, 31, 35, 37, 39, 41, EGT Limit 3,000 (10,000) Idle, 31, 35, 37, 39, 41, EGT Limit 6,100 (20,000) Idle, 37, 39, 41, EGT Limit
9,100 (30,000) Idle, 41, EGT limit (Except Jet A-1) 11,300 (37,000) Idle
Test Fuels
Each of the four test fuels was run at each altitude condition. The test fuels were: conventional Jet A-1, to use as a baseline; a semi-synthetic blend of camelina based hydro processed renewable jet fuel and JP8 (JP8-HRJ8); a blend of 50% Fischer-Tropsch synthetic paraffinic kerosene and 50% JP8 (JP8-FT); and a 100% Fischer-Tropsch synthetic paraffinic kerosene (FT-IPK).
Details of the fuels are given in table 4. The hydrogen to carbon ratio increases from the Jet A-1 through the blended fuels to a maximum for the pure FT-IPK. The elevated flash point for the Jet A-1 fuel is also noteworthy as this can affect the combustion stability. Also given is the order the fuels were tested in the altitude facility. Due to limited time in the facility tests were not repeated to determine if the engine operating point had changed during the program.
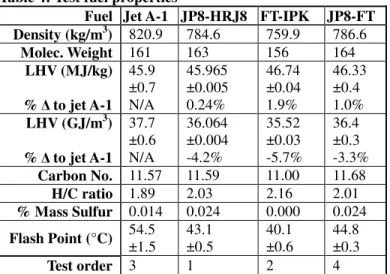
Table 4: Test fuel properties
Fuel Jet A-1 JP8-HRJ8 FT-IPK JP8-FT Density (kg/m3) 820.9 784.6 759.9 786.6 Molec. Weight 161 163 156 164 LHV (MJ/kg) % to jet A-1 45.9 ±0.7 N/A 45.965 ±0.005 0.24% 46.74 ±0.04 1.9% 46.33 ±0.4 1.0% LHV (GJ/m3) % to jet A-1 37.7 ±0.6 N/A 36.064 ±0.004 -4.2% 35.52 ±0.03 -5.7% 36.4 ±0.3 -3.3% Carbon No. 11.57 11.59 11.00 11.68 H/C ratio 1.89 2.03 2.16 2.01 % Mass Sulfur 0.014 0.024 0.000 0.024 Flash Point (°C) 54.5 ±1.5 43.1 ±0.5 40.1 ±0.6 44.8 ±0.3 Test order 3 1 2 4 Note: Two samples of each fuel were tested if a significant difference was observed in the results the range is noted by the addition of a ± value.
Data Analysis
All parameter corrections included the gas properties: specific heat, ratio of specific heats and ideal gas constant were appropriate. This corrected for variations in the gas composition due to the difference in fuel composition in the hot section. The corrections were derived from the conventional dimensionless parameters. The parameters were corrected back to the following reference conditions:
Compressor Inlet: pD=101.325 kPa, Td=15°C, Standard
atmosphere gas composition
Turbine Inlet: pD=300 kPa, Td=1000°C, Standard
atmosphere gas composition
Equation 1 is the dimensionless parameter for mass flow [8]. The standard correction factor ignores the diameter, ratio of specific heats and ideal gas constant and, by assuming the same dimensionless operating point as at design or reference conditions, equation 2 results. The diameter can be ignored since it is constant for a given engine and inter-engine differences usually destroy the assumptions of similarity on which the corrections are based. The gas constant and specific heat are also ignored, as they change little. If the same fuel is being burnt for a given fuel to air ratio (FAR) the gas constant will be the same and the specific heat will vary slightly depending on the temperature.
When comparing different fuels the composition of the combustion products can be different for the same FAR. This results in a different ideal gas constant and ratio of specific heats. To account for this the diameter is still ignored but the ratio of specific heats and ideal gas constant are retained, resulting in equation 3. The inlet gas composition assumed a standard atmosphere and added the measured water content. In the hot section the composition was determined by assuming complete combustion of the fuel. The molecular formula of each fuel was derived from the data in table 4. The carbon number provided the average number of carbon atoms in the fuel molecule and the H/C ratio gives the number of hydrogen atoms per carbon atom. Finally the sulfur content is readily derived from the % mass sulfur.
(1)
(2)
(3)
To obtain the steady state operating point a 30 second sample (9.5 Hz sampling rate) was averaged. The sample was chosen from a time period at least 2 minutes long starting after the engine and facility had been brought to the required operating point and allowed to settle. The 30 second sample with the greatest likelihood of slope of the linear least squares fit of EGT being zero was selected.
Due to time constraints an accurate thrust bed calibration was not available for this engine and the gross thrust was calculated from engine mass flows and exit conditions. Unaltered this engine operates with a subsonic propelling nozzle but the added blockage caused the exit flow to be
choked at high power settings. In the subsonic condition the exit velocity (C6) was calculated using the ambient static
pressure and in the choked condition using po6. The gross
thrust was calculated with equation 4. This result was then used for the calculation of specific fuel consumption (SFC).
!
" #
$
# % (4)The SFC value, which uses the fuel mass flow and the thrust from equation4, is corrected as per equation 5.
!
!
&'&' ! ( ! )) ) ) ) ) (5) Error AnalysisNRC uncertainty estimates for the key corrected parameters in sea level tests (SLT) are: SFC- 0.9%, Thrust- 0.6%, Fuel flow – 0.7%, Airflow- 0.7%, Pressure ratio- 0.3%, temperature ratio- 0.9%, and rotor speed-0.4%. These values are considered conservative in assessing the run-to-run variations relevant for the comparison of fuels in the same installation.
Confidence intervals for measured values at steady state were based on the standard deviation of the transient data used to obtain the average steady state point and, therefore, only included sources of error resulting in variation during the test point. Bias and some instrument errors, for example a zero offset, will not be represented. As the steady state sample sizes were large, nearly 300 points, a Gaussian distribution was assumed in the analysis. For calculated values the error on the measured parameters was combined using the standard technique provided in many textbooks [9].
The North Atlantic Treaty Organisation (NATO) performed a comparison of altitude test facilities and reported the following total uncertainties at 1,700 m [10]:
SFC ±0.6 to 1.8% Airflow ±0.4 to 0.8% Net Thrust ±0.4 to 1.2%
The calculated thrust in this TRS-18 test series has a higher error than that reported above and, therefore, the SFC will also have a greater uncertainty than the NATO tests. Ignoring errors in pressure and temperature measurements and observing that thrust is a function of airflow squared the SFC uncertainty should be 2 times the NATO airflow uncertainty plus the NATO uncertainty in SFC not due to the thrust measurement, or ±1.2 to 2.9%. The NATO report also notes that the uncertainty increases with altitude increasing to just over 3% for net thrust and SFC at 11,600 m and that ground level test cells generally have lower uncertainties than altitude facilities.
THEORETICAL ANALYSIS
To determine expected changes in engine operation a simple model of a TRS-18 was produced. It was modeled as a near ideal system with no pressure losses, and the compressor and turbine operating at 80% isentropic efficiency. The combustion efficiency was assumed to be 100%. The gas properties of the combustion products were calculated using the correlations of Bucker et al. [11] with gas composition determined as described in the Data Analysis section above.
The pressure ratio (PR) and inlet air mass flow were assumed constant between fuels. This was a valid assumption as the small changes in fuel mass flow and turbine inlet temperature between fuels would be unlikely to significantly shift the compressor operating point. The work extracted from the turbine was equivalent to the work consumed by the
Table 5: Results of Engine Operation Simulation
Fuel To1
(°C) po1
(kPa) (kg/s) PR
% Difference from Jet A-1 for alternate fuels (Alt – Jet A-1) FAR (kg/kg) T04 (°C) Thrust (N) SFC (kg/N-hr) SFCc (kg/N-hr) 4 Cp4 (kJ/kg-K) R4 (kJ/kg-K) Jet A-1 15 101.3 1.95 3.9 0.01440 768.1 1043.3 0.0969 0.1006 1.3228 1.1760 0.2870 15 101.3 1.10 2.0 0.00697 396.7 242.5 0.1138 0.1180 1.3628 1.0781 0.2870 -31 30.0 0.63 3.9 0.01139 591.0 300.3 0.0860 0.0974 1.3394 1.1327 0.2870 -31 30.0 0.36 2.0 0.00576 290.7 71.5 0.1030 0.1166 1.3759 1.0507 0.2870 JP8-HRJ8 15 101.3 1.95 3.9 -0.30% -0.093% -0.015% -0.28% -0.045% 0.001% 0.085% 0.088% 15 101.3 1.10 2.0 -0.28% -0.041% -0.003% -0.28% -0.036% 0.001% 0.040% 0.043% -31 30.0 0.63 3.9 -0.29% -0.073% -0.011% -0.28% -0.041% 0.002% 0.064% 0.070% -31 30.0 0.36 2.0 -0.28% -0.034% -0.002% -0.28% -0.036% 0.0003% 0.035% 0.035% FT-IPK 15 101.3 1.95 3.9 -2.1% -0.20% -0.11% -2.0% -0.12% 0.015% 0.12% 0.17% 15 101.3 1.10 2.0 -2.0% -0.071% -0.019% -2.0% -0.063% 0.006% 0.063% 0.081% -31 30.0 0.63 3.9 -2.1% -0.15% -0.076% -2.0% -0.095% 0.013% 0.093% 0.13% -31 30.0 0.36 2.0 -2.0% -0.059% -0.016% -2.0% -0.060% 0.004% 0.055% 0.067% JP8-FT 15 101.3 1.95 3.9 -1.1% -0.094% -0.058% -1.1% -0.058% 0.008% 0.050% 0.075% 15 101.3 1.10 2.0 -1.1% -0.031% -0.011% -1.1% -0.028% 0.003% 0.027% 0.037% -31 30.0 0.63 3.9 -1.1% -0.070% -0.041% -1.1% -0.045% 0.007% 0.039% 0.060% -31 30.0 0.36 2.0 -1.1% -0.026% -0.008% -1.1% -0.026% 0.002% 0.024% 0.030%
compressor and the thrust calculated based on the exit mass flow, exhaust gas temperature, ambient pressure and nozzle exit area. The energy required for the compression and expansion processes was calculated from the enthalpy, entropy and pressure at the inlet; the exit pressure; and the isentropic efficiency for the actual gas composition in each case.
High and low power settings at sea level and 9,100 m were simulated. The same PR was used at both altitudes and the corrected compressor mass flow was kept constant. The results are presented in table 5. The Jet A-1 results are the calculated values and the remaining fuels show the percent difference from the Jet A-1 result. The largest changes are in SFC and FAR. All the alternate fuels show a reduction in the uncorrected values that almost entirely corresponds to the increased heating value of the fuel as can be seen by comparing the lower heating value (LHV) percentage change for LHV (-0.2, 2 and 1%) in table 4 to the FAR and SFC in table 5 (changes 0.3, 2 and 1% uncorrected and 0.04, 0.08 and -0.04% corrected).
The corrected SFC does show a decrease for the alternate fuels, but it is very small. This is due to the change in combustion product properties. The specific heat for the alternate fuels is slightly higher than for Jet A-1 resulting in better energy extraction. A close correlation can be seen between the variation in corrected SFC and specific heat. The FT-IPK was 100% synthetic and it had about double the variation in corrected SFC of the blended fuels, which contained 50% JP8. This increase in efficiency results in a slight drop in the turbine inlet temperature (TIT) for constant airflow and pressure ratio. The resulting reduction in EGT and exhaust mass flow causes a decrease in thrust.
A correspondence in specific heat and ideal gas constant is also evident. Under the ideal gas assumption this corresponding change results in a reduced change in the ratio of specific heats. The change in specific heat between the FT-IPK and Jet A-1 was similar to that reported by Bester and Yates at the same FAR. It should also be noted that this simulation did not use the specific heat or ratio of specific heats in the calculation but used the enthalpy and entropy at each state, but nevertheless they do serve to demonstrate the changes observed.
RESULTS
Steady State
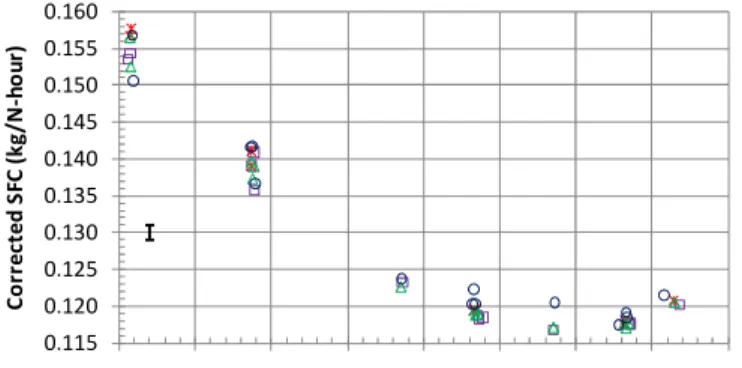
The corrected SFCs at each altitude are presented in figures 4 through 9. Figure 6 includes error bars showing the 95% confidence interval. As the graphs are easier to read without the error bars they were not shown on the remaining plots. A line is shown to the left of each plot showing a 0.002 kg/N-hour span, about ± 1%. As the graphs have different y-scales this provides a frame of reference for comparison. It also approximates the full span of a typical error bar, about ± 0.7%. Further discussions of SFC refer to corrected SFC.
The minimum SFC is found near 38 kRPM at each altitude. As the altitude increases the minimum SFC decreases.
Greater variation in SFC is seen at the lower power levels. In particular figure 4, at the lowest two speeds the SFC variation is ± 2.5%. The FT-IPK repeat points at the lowest speed fall near the extremes of the span, indicating that the variations seen in the SFC are within the test to test variation at this operating point.
One possible explanation for the discrepancy is a change in engine operation as the tests performed prior to the FT-IPK, the JP8-HRJ8 fall near the upper FT-IPK points and the subsequent tests, Jet A-1 and JP8-FT, fall near the lower FT-IPK point. As previously mentioned time limitations prevented repeating the power hooks to determine if the engine operation had changed. To determine the average change in SFC a least squares second order polynomial fit was applied to each of the fuels to assess the relationships in figures 4 to 8. To ensure that no extrapolation was included the curves were integrated between speeds present in the data sets being compared and the average value extracted. For example, at 3,000 m the average was taken between 30 kRPM and 42 kRPM. Some operating points were repeated for particular fuels to allow for additional emissions measurements. These were removed from the data set used to obtain the average to prevent biasing towards those points. All the points, however, are shown in the figures. Each of the alternate fuel SFCs had the Jet A-1 result subtracted from it. Where enough distinct points existed to perform a bootstrap analysis, this technique was used to generate the 95% confidence interval [12].
The results are presented in table 6. In addition to individual altitudes, the combined results for all altitudes are also presented. High power operation at all altitudes was also compared as this is the most useful operating range of the engine, and, therefore the most relevant. For this all data below 37.6 kRPM were discarded and the average value was taken from 38.5 kRPM to 43.5 kRPM.
The largest data sets, containing results for all altitudes, show little change in SFC between fuels. The estimated value at high power has a greater SFC for all the alternate fuels, but the confidence interval spans the zero point in all cases. Across the entire power range the JP8-FT and JP8-HRJ8 show an improvement in SFC, but it is insignificant when the confidence interval is taken into account. The FT-IPK shows a worse SFC but again the confidence interval spans the zero point. Looking at the full range of altitudes collectively it appears that there is no significant change in SFC between fuels.
Comparing across altitudes the SFC is consistently higher for the alternate fuels, although each fuel has one altitude which is an exception. For the JP8-FT and the JP8-HRJ8 the exception occurs at 3,000 m. These two fuels would be expected to behave very similarly as they are both a blend of 50% JP8 and 50% synthetic kerosene. Table 4 shows that the physical properties of the two fuels are very similar. The FT-IPK showed an increase in SFC for all altitudes except for 9,100 m.
Figure 9 zooms in on the high power region at 3,000 m showing the top three speeds for each fuel. It includes the 95%
error bars and the quadratic least squares curve fit to the entire Jet A-1 data set at this altitude. The curve demonstrates the similarity of the SFCs in this region. Results for all fuels fall on either side of the curve and visually the curve appears to have been fit to the JP-HRJ8 points. The curve passes through almost all of the error bars with only two being missed, both for the JP8-FT, with one point above and the other below.
Variations in corrected speed at idle were observed between the fuels, about 1.4% (SLT uncertainty of 0.4%). This is demonstrated in figure 8 which shows only the idle points at 11,300 m. The variation is due to the differences in the fuel heating value (FHV) by volume. At idle the fuel pump delivers a fixed volume of fuel based on the inlet pressure. For a given volume of fuel the speed then corresponds to the volumetric energy content of the fuel. The FT-IPK has the lowest and corresponded to the lowest idle speed, followed by JP8-HRJ8 and JP8-FT with very similar energy contents. The speeds are reversed from what would be expected based on the energy content and this appears to be the result of small differences in the inlet pressure changing the volumetric flow rate. Finally, the Jet A-1 has the highest energy content and idle speed.
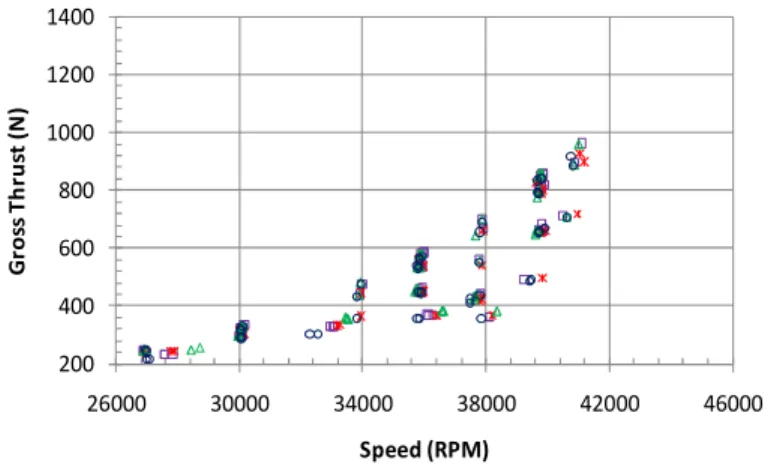
Figure 10 shows the corrected EGT for all operating points. It generally collapses well within a scatter of ±1.7% (SLT uncertainty of 0.9%) and it appears that the idle speed at 1,500 m is near the minimum EGT point as it starts to trend back up at the very low corrected speed. By contrast the corrected thrust does not collapse as well. The altitude has a greater effect on the thrust. This can be seen in figure 11 where at the higher speeds, which cover a larger range of altitude the variation is much more significant. For comparison figure 12 shows the uncorrected thrust with speed and the scatter is much larger. However, no difference due to fuel type was evident.
Table 6: Average corrected SFC difference from Jet A-1 and corresponding 95% confidence intervals as percent of Jet A-1 result
Data Set
JP8-FT JP8-HRJ8 FT-IPK Est. CI Est. CI Est. CI 1,500 m 0.4 N/A 0.9 N/A 1.3 N/A
3,000 m -0.5 -0.9 -0.1 -1.1 -1.3 -0.9 0.6 0.2 1.5 6,100 m 0.6 0.2 1.3 0.4 -0.1 1.2 1.7 1.3 2.5
9,100 m 0.1 N/A 0.7 N/A -0.8 N/A
All -0.1 -1.5 1.3 -0.2 -1.7 1.1 0.6 -0.9 1.8 All high power 0.3 -1.0 1.8 0.3 -1.5 2.2 0.5 -1.7 2.1
Figure 4: Corrected SFC with corrected speed at 1,500 m
Figure 5: Corrected SFC with corrected speed at 3,000 m
Figure 6: Corrected SFC with corrected speed at 6,100 m including error bars for 95% confidence interval
Figure 7: Corrected SFC with corrected speed at 9,100 m
Figure 8: Corrected SFC with corrected speed at 11,300 m
Figure 9: Corrected SFC with corrected speed at 3,000 m for top three speeds including error bars for 95% confidence interval
Figure 10: Corrected EGT (To6) with corrected speed at all
altitudes
Figure 11: Corrected gross thrust (FG) with corrected speed
at all altitudes
Transient
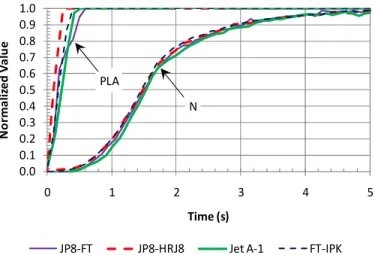
Slams were performed at 3,000 m and 6,100 m. The slam manoeuvre involved moving the PLA from idle to maximum EGT setting in less than 0.6 seconds. At 3,000 m the PLA position moves from 11% at idle to 79% at maximum EGT. At 6,100 m it moves from 37% to 76%. Figure 13 shows the shaft speed and PLA normalised so that for each fuel 0 represents the average idle speed and 1 the average final speed at 3,000 m. On the time scale 0 represents the start of the manoeuvre. The JP8-FT lags slightly behind the others, about 5% in speed but only temporarily. The PLA was controlled by a human operator resulting in some test to test variation. For the Jet A-1 the PLA shows a hesitation 40% of the way to maximum but this does not have significant effect on the acceleration rate, having met the 0.6 s criteria.
Figure 14 shows the same acceleration but plots the corrected fuel flow with corrected speed. The fuel flow for the JP8-FT is slightly higher than for the other fuels. This contrasts to the slightly lower speed seen in figure 13. It appears the control system is compensating for the lower speed by increasing the fuel flow. All the energy is apparently not being extracted from the JP8-FT fuel during the acceleration, possibly due to combustion efficiency, but once the manoeuvre is completed the difference disappears.
The operating point where the control system reduces the acceleration rate can be identified and is indicated in figures 13 and 14 by the arrow head identifying the set of lines for N. The speed starts to level off and the fuel flow rate is decreased at the same point for each fuel. At this point the control system brings the FT-JP8 fuel flow back in line with the other fuels as the rotational speed catches up.
At 6,100 m, as seen in figure 15, the fuels all respond the same within the experimental error. The FT-JP8 has a slight lag in the PLA movement near 70% and close inspection of the speed shows a corresponding reduction in acceleration at this point. The effect on engine operation, however, is insignificant. At this altitude the Jet A-1 fuel result appears to accelerate more slowly than the alternate fuel results.
This may be indicative of greater combustion stability with the alternate fuels as at 9,100 m: the Jet A-1 flamed out while accelerating to the maximum steady state operating point but the alternate fuels all achieved the point near 43 kRPM (see data points on figure 7). This could be related to the elevated flash point of the Jet A-1 fuel. As shown in table 4 the flash point for Jet A-1 is 10°C above the alternate fuels. The boiling point distribution for the Jet A-1 is also elevated above the alternate fuels. It has been shown that the combustor lean stability operation correlates to those fuel properties [13].
Figure 16 presents the corrected fuel flow rate for each fuel at 6,100 m. Again the reduction in rate of acceleration by the control system can be identified and is indicated by the arrow indicating the set of curves for N. All the fuels except for the HRJ8 respond at the same point. The difference in the JP8-HRJ8 is caused by a higher final set point which moved the control system response up as well.
Figure 13: Slam from idle to maximum EGT setting showing normalized shaft speed (N) and PLA at 3,000 m
Figure 14: Slam from idle to maximum EGT setting showing corrected fuel flow and normalised PLA with corrected engine speed at 3,000 m
Figure 15: Slam from idle to maximum EGT setting showing normalized shaft speed (N) and PLA at 6,100 m
! " # $ % !
Figure 16: Slam from idle to maximum EGT setting showing corrected fuel flow and normalised PLA with corrected engine speed at 6,100 m
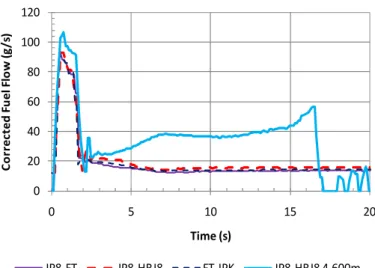
The engine was started at 3,000 m to compare the alternate fuels altitude re-light ability. This was close to the maximum altitude where the engine could be started with the modifications made to the engine tailpipe for emissions monitoring. Figure 17 shows that initially all the alternate fuels respond the same but small variations appear at higher speeds. The most notable occurrence is the JP8-HRJ8 settling out at a higher speed than the other fuels. This is contrary to speeds seen at idle previously and to the energy content of the fuel. Figure 18 provides the corrected fuel flow rates and shows the increased speed for the JP8-HRJ8 corresponds to an increased fuel flow. None of the fuels had difficulty starting at 3,000 m.
A failed start for the JP8-HRJ8 fuel at 4,600 m is also included in figures 17 through 19. The rotational speed does not initially approach the idle speed and figure 18 shows that during the first 2s of start up the fuel flow is similar with a large peak rapidly decreasing. At 3,000 m the fuel flow continues to decreases slightly, but at 4,600 m it continues to increase in an attempt to increase the speed. Eventually, near 15s, the speed does start to climb but the start was aborted due to excessive EGT. It is possible the engine would have successfully started if allowed to operate for long enough. However, the start was considered as “hung”.
Figure 20 presents the internal temperatures during the successful start at 3,000 m and contrasts with figure 21 which shows the failed start at 4,600 m for the JP8-HRJ8 fuel. Comparing the TIT to the turbine PR in figure 19, shows the To4 for the successful start peaking prior to the PR. For the
failed case the PR is still rapidly climbing as is the To4,
indicating that the steady operation was not imminent and engine damage was a possibility due to the elevated TIT.
Initially both cases show To5 exceeding all the other
stations. This may be due to spatial positioning of the thermocouples or combustion continuing beyond the combustor. Early in the start up process the temperature drop across the turbine would be low due to the very low PR. As the PR increases so does the energy extraction and the To5
decreases. In the successful start the temperatures level out as expected. Station 3.5 is the hottest before full dilution takes place in the combustion chamber, followed by To4 prior to the
turbine.
After energy extraction To5 is lower but To6 shows a slight
increase, likely due to complete mixing of the gases by the nozzle exit. To5 thermocouples varied in their circumferential
position but had constant radial locations which could result in a biased reading if a radial temperature profile exists.
In the failed case the temperatures level out 200°C cooler, prior to 10s, than in the successful case, but had a greater fuel input. It appears that a quantity of un-combusted fuel was passing through the engine. After 10s station 3.5 remained at a nearly constant temperature indicating no increase in combustion in the first half of the combustion chamber. To4
does start to increase, but not as rapidly as To5 which in turn is
not as rapid as To6. This indicates that some form of
combustion was continuing through the turbine and into the exhaust nozzle. When the run was aborted the temperature was increasing nearly 500°C across the turbine and another 200°C through the propelling nozzle.
Figure 17: Corrected rotational speed for engine starts with alternate fuels at 3,000 m and 4,600 m for JP8-HRJ8
"#
$
%
!"
CONCLUSIONS AND FUTURE WORK
The alternate fuels did not produce a significant change in engine performance at altitude. Rapid acceleration and re-lights were also not significantly affected by the alternate fuels. The Jet A-1 fuel was unable to reach the maximum EGT setting at 9,100 m while the alternate fuels were able to reach this operating point possibly indicating enhanced performance of the alternate fuels, consistent with their flash point properties.
Repeat tests of the fuels at altitude should be performed to verify the greater operating range of the alternate fuels and investigate variations with altitude change. Ground level tests will be performed with reduced uncertainty in the performance parameters to determine if a difference in SFC exists. Model prediction capabilities will be improved to validate and tune altitude simulations.
ACKNOWLEDGEMENTS
Environment Canada is gratefully acknowledged for performing the emissions monitoring during the test series. The authors thank National Research Council Canada, Environment Canada (PERD Particles and Related Program – Project C11.007D) and Department of National Defence for sponsoring the project. The United States Air Force is also acknowledged for generously providing the JP8-HRJ8 fuel blend.
Figure 18: Corrected fuel flow for engine starts with alternate fuels at 3,000 m and 4,600 m for JP8-HRJ8
Figure 19: Corrected turbine pressure ratio for engine starts with alternate fuels at 3,000 m and 4,600 m for JP8-HRJ8
Figure 20: Internal stagnation temperatures for engine start at 3,000 m with JP8-HRJ8
Figure 21: Internal stagnation temperatures for failed engine start at 4,600 m with JP8-HRJ8
% # $ & $ # $ ! ! ! ! ! ! ! ! %&' & () (*!) +
REFERENCES
[1] Chishty, W. A.; Davison, C. R.; Bird, J.; Chan, T.; Cuddihy, K.; McCurdy, M.; Barton, P.; Krasteva, A. and Poitras, P., "Emissions Assessment of Alternative Aviation Fuel at Simulated Altitudes," 2011, GT2011-45133, ASME Turbo Expo 2011, 6-14 June, 2011, Vancouver, Canada.
[2] Moran, M. J. and Shapiro, H. N., Fundamentals of Engineering Thermodynamics, Third ed., John Wiley & Sons, Inc. 1996.
[3] Incropera, F. P. and DeWitt, D. P., Introduction to Heat Transfer, 3rd ed., John Wiley & Sons, Toronto, 1996. [4] Bester, N. and Yates, A., "Assessment of the Operational
Perfromance of Fischer-Tropsch Synthetic-Paraffinic Kerosene in a T63 Gas Turbine Compared to Conventional Jet A-1 Fuel," 2010, GT2009-60333, ASME Turbo Expo 2009, 8-12 June, 2009, Orlando, FL.
[5] "Aviation Gas Turbine Forcast," Forcast International, Newton, CT, Oct. 2009.
[6] Davison, C. R. and Birk, A. M., "Set up and Operational Experience with a Micro-Turbine Engine for Research and Education," 2004, GT2004-53377, ASME Turbo Expo 2004, 14-17 June, 2004, Vienna, Austria.
[7] AGARD, "Recommended Practices for Measurement of Gas Path Pressures and Temperatures for Performance Assessment of Aircraft Turbine Engines and Components," AGARD, AGARD-AR-245, Neuilly sur Seine, June 1990, 160p.
[8] Walsh, P. P. and Fletcher, P., Gas Turbine Performance, 2nd ed., Blackwell Science Ltd. & ASME, Fairfield, NJ, 2004.
[9] Holman, J. P., Experimental Methods for Engineers, Fifth ed., McGraw-Hill Inc. 1989.
[10] Ashwood, P. F., "The Uniform Engine Test Programme," AGARD, AGARD-AR-248, Neuilly sur Seine, Feb. 1990, 144p.
[11] Bucker, D., Span, R., and Wagner, W., "Thermodynamic Property Models for Moist Air and Combustion Gases," Journal of Engineering for Gas Turbines and Power, Vol. 125, No. 1, 2003, pp. 374-384.
[12] Davison, A. C. and Hinkley, D. V., Bootstrap Methods and their Applications, Cambridge University Press, Cambridge, U.K., 1997.
[13] Moses, C. A. and Roets, P. N. J., "Properties, Characteristics and Combustion Performance of Sasol Fully Synthetic Jet Fuel," 2008, GT2008-50545, Turbo Expo 2008: Power for Land, Sea and Air, 9-13 June, 2008, Berlin, Germany.