HAL Id: hal-01706427
https://hal-normandie-univ.archives-ouvertes.fr/hal-01706427
Submitted on 20 Jul 2018
HAL is a multi-disciplinary open access
archive for the deposit and dissemination of
sci-entific research documents, whether they are
pub-lished or not. The documents may come from
teaching and research institutions in France or
abroad, or from public or private research centers.
L’archive ouverte pluridisciplinaire HAL, est
destinée au dépôt et à la diffusion de documents
scientifiques de niveau recherche, publiés ou non,
émanant des établissements d’enseignement et de
recherche français ou étrangers, des laboratoires
publics ou privés.
Identification of Potential Gene Markers and Insights
into the Pathophysiology of Pheochromocytoma
Malignancy
Erwan Thouennon, Abdel Elkahloun, Johann Guillemot, Anne-Paule
Gimenez-Roqueplo, Jérôme Bertherat, Alice Pierre, Hafida Ghzili, Luca
Grumolato, Mihaela Muresan, Marc Klein, et al.
To cite this version:
Erwan Thouennon, Abdel Elkahloun, Johann Guillemot, Anne-Paule Gimenez-Roqueplo, Jérôme
Bertherat, et al.. Identification of Potential Gene Markers and Insights into the Pathophysiology
of Pheochromocytoma Malignancy. Journal of Clinical Endocrinology and Metabolism, Endocrine
Society, 2007, 92 (12), pp.4865 - 4872. �10.1210/jc.2007-1253�. �hal-01706427�
Identification
of Potential Gene Markers and
Insights
into the Pathophysiology of
Pheochromocytoma
Malignancy
Erwan
Thoue¨nnon, Abdel G. Elkahloun, Johann Guillemot, Anne-Paule Gimenez-Roqueplo,
Je´rˆome
Bertherat, Alice Pierre, Hafida Ghzili, Luca Grumolato, Mihaela Muresan, Marc Klein,
Herve´
Lefebvre, L’Houcine Ouafik, Hubert Vaudry, Pierre-Franc¸ois Plouin, Laurent Yon, and
Youssef
Anouar
Institut National de la Sante´ et de la Recherche Me´dicale U413 (E.T., J.G., A.P., H.G., L.G., H.L., H.V., L.Y., Y.A.), Laboratory of Cellular and Molecular Neuroendocrinology, European Institute for Peptide Research (Institut Fe´d´eratif de Recherche Multidisciplinaires sur les Peptides 23), University of Rouen, 76821 Mont-Saint-Aignan, France; Genome Technology Branch (A.G.E.), National Human Genome Research Institute, National Institutes of Health, Bethesda, Maryland 20892; Department of Genetics (A.-P.G.-R.), Hoˆpital Europe´en Georges Pompidou, 75015 Paris, France;
Department of Endocrinology (J.B.), Institut National de la Sante´ et de la Recherche Me´dicale U567, Institut Cochin, 75014 Paris, France; Department of Endocrinology (M.M., M.K.), Hoˆpital de Brabois, 54511 Nancy, France; Equipe Mixte Institut National de la Sante´ et de la Recherche Me´dicale EMI 0359 (L.O.), Laboratory of Experimental Cancerology, Universite´ de la Mediterrane´e, Aix-Marseille II, 13015 Marseille, France; and Hypertension Unit (P.-F.P.), Hoˆpital Europe´en Georges Pompidou, AP-HP, University of Paris-5, 75015 Paris, France
Context: Pheochromocytomas are catecholamine-producing tumors
that are generally benign but that can also present as or develop into malignancy. Occurrence of malignant pheochromocytomas can only be asserted by imaging of metastatic lesions.
Objectives: We conducted a gene expression profiling of benign and
ma-lignant tumors to identify a gene signature that would allow us to discrim-inate benign from malignant pheochromocytomas and to gain a better un-derstanding of tumorigenic pathways associated with malignancy.
Design: A total of 36 patients with pheochromocytoma was studied
retro-spectively. There were 18 (nine benign and nine malignant) tumors used for gene expression profiling on pangenomic oligonucleotide microarrays.
Results: We identified and validated a set of predictor genes that
could accurately distinguish the two tumor subtypes through
unsu-pervised clustering. Most of the differentially expressed genes were down-regulated in malignant tumors, and several of these genes en-coded neuroendocrine factors involved in prominent characteristics of chromaffin cell biology. In particular, the expression of two key pro-cessing enzymes of trophic peptides, peptidylglycine ␣-amidating monooxygenase and glutaminyl-peptide cyclotransferase, was re-duced in malignant pheochromocytomas.
Conclusion: The gene expression profiling of benign and malignant
pheochromocytomas clearly identified a set of genes that could be used as a prognostic multi-marker and revealed that the expression of several genes encoding neuroendocrine proteins was reduced in ma-lignant compared with benign tumors.
P
HEOCHROMOCYTOMAS ARE
CATECHOLAMINE-producing tumors that occur from chromaffin cells of
adrenal medulla or extra-adrenal locations, leading to
par-oxysmal or persistent hypertension in most patients. They
are mainly sporadic tumors but familial forms resulting from
mutations of the oncogene RET or the oncosuppressors von
Hippel-Lindau (VHL), neurofibromatosis 1 (NF1), and
suc-cinate dehydrogenase subunits are increasingly recognized
(1– 4). Familial pheochromocytomas represent
approxi-mately 25% of cases, and are observed as part of multiple
endocrine neoplasia type 2, VHL and NF1 syndromes, and
as paraganglioma tumors (5). Measurement of the
concen-trations of plasma free metanephrines or urinary fractionated
metanephrines represents the test of choice for the diagnosis
of pheochromocytomas (6).
Pheochromocytoma generally occurs as a benign tumor, but
10–25% of cases are malignant at the first surgery or at recurrence,
with metastasis development at lymph node, bone, liver, or lung
(7). Unlike benign tumors that can be diagnosed and surgically
treated, there is currently no method to identify, predict, or cure
malignant pheochromocytomas. Malignancy of
pheochromocy-toma can be diagnosed only after metastasis appearance.
There-fore, malignancy development and the underlying molecular
pathways remain poorly understood.
being worst, to one, best) over all samples in the study was required to be at least 0.5 (8). Second, the normalized ratio to reference RNA was required to be above two or less than 0.5 in three or more experiments. The averaged duplicate ratios were log transformed, and a T-statistic/ F-statistic algorithm was applied. The resulting data were analyzed by generation of a weighted list of genes followed by 10,000 random per-mutation analysis, as described elsewhere (9). The tools and statistical methods used for this particular analysis are available at http://arrayanalysis.nih.gov/.
Real-time PCR
PCR amplification was performed using the SYBR Green I Master Mix Buffer (Applied Biosystems, Courtaboeuf, France) in an ABI PRISM 7000 Sequence Detector (Applied Biosystems). PCR results were analyzed using the qBase program (10).
Statistical analysis
Statistical analyses were performed using the nonparametric Mann-Whitney U test. Data were analyzed using the Prism program (Graph-Pad Software, Inc., San Diego, CA).
Results
Gene expression profiling of benign and malignant pheochromocytomas
An unsupervised hierarchical clustering of hybridization
data yielded a four-branch dendrogram: two branches for
malignant tumors and two branches for the benign tumors.
There was only one benign tumor (sample no. 6) that
clus-tered with malignant ones (Fig. 1A). Interestingly, the four
hereditary cases included in the present analysis exhibited a
significant aggregation among the malignant tumors. We
performed a T-statistic/F-statistic discriminative gene
selec-tion followed by a supervised clustering method to identify
the genes that best differentiate between the malignant and
benign tumors. Analysis of hybridization data revealed
about 100 genes (Fig. 1B) showing a statistically significant
differential expression between benign and malignant
pheo-chromocytomas (P
⬍ 0.001, Student’s t test). The
differen-tially expressed genes were functionally categorized on the
basis of known or inferred biological function of their protein
product using gene ontology. Table 1 summarizes the
func-tional clustering of the identified genes. Among these, about
a third had unknown function, and, more importantly, only
16 were up-regulated in malignant pheochromocytomas.
Validation of microarray analysis
To confirm the results obtained by microarray analysis, we
used real-time PCR to determine the mRNA levels of
glu-taminyl-peptide cyclotransferase (QPCT), peptidylglycine
␣-amidating monooxygenase (PAM), neuropeptide Y (NPY),
and calcium/calmodulin-dependent protein kinase II
(CAMKIIN
␣) in a collection of tumors comprising the
sam-ples used for microarray analysis, and an additional three
malignant and 11 benign pheochromocytomas with different
characteristics. Differential expression between malignant
and benign pheochromocytomas was confirmed for the four
genes: P
⫽ 0.0078 for QPCT; P ⫽ 0.0245 for PAM; P ⫽ 0.0292
for NPY; and P
⫽ 0.0302 for CAMKIIN␣ (Fig. 2).
Discussion
Among the main clinical challenges presented by
pheo-chromocytomas, malignancy remains the most problematic
Here, we used pangenomic human oligonucleotide arrays
to
profile the gene expression of benign and malignant
pheo-chromocytomas, to identify a set of genes that could
distin-guish
the two types of tumors on the one hand, and to gain
insights into the mechanisms underlying the occurrence of
malignancy
on the other hand.
Materials and Methods
Tumor samples
Tumor specimens were collected during surgery (ⱕ15 min after the operation) from patients with pheochromocytoma and immediately fro-zen in liquid nitrogen. Nine benign and nine malignant tumors, clas-sified based on the absence or presence of metastatic lesions, were used for microarray analysis. The average duration of the follow-up of the patients with benign tumors was 41 ⫾ 28 months (range 1– 84). Tumors used for microarray analysis were collected in two Hospital Centers of the COritco and MEdullo-surre´nales Tumeurs Endocrines (COMETE) network (COMETE-2 network, PHRC AOM 02068), according to stan-dardized guidelines of tumor collection established by contributing teams of the network. Of these tumors, 14 (nine benign and five ma-lignant) were without evidence of a hereditary disease, i.e. sporadic tumors, whereas three malignant tumors had an succinate dehydroge-nase B mutation, and one malignant tumor had a VHL mutation. Pheo-chromocytoma genetic testing has been performed as previously de-scribed (1). Among the benign tumors, seven were located in the adrenal, and two were at an extra-adrenal site. Among the malignant tumors, five were located in the adrenal, three at an extra-adrenal site, and one was located at both the adrenal and an extra-adrenal site. Malignant tumors used in microarray analysis were from the primary tumoral site. An additional five malignant (three familial, one sporadic, and one not genotyped) and 13 benign (three multiple endocrine neoplasia type 2, two NF1, one sporadic, and seven not genotyped) tumors were used for quantitative PCR analysis. These tumor samples were provided by the Rouen (Hoˆpital C. Nicolle, Rouen, France), the Nancy (Hoˆpital de Brabois, Nancy, France), and the Lausanne (Hoˆpital Vaudois, Lausanne, Switzerland) University Hospital Centers.
RNA extraction
Total RNA was extracted using the Tri-Reagent (Sigma-Aldrich, Saint Quentin Fallavier, France), further purified on RNeasy mini Spin Col-umns (QIAGEN, Courtaboeuf, France), and analyzed on a denaturing agarose gel.
Microarray processing and data analysis
The oligo microarray chips were generated from 34,580 longmer probes set obtained from the QIAGEN Human Genome Oligo Set ver-sion 3.0 (QIAGEN, Valencia, CA). The set corresponds to approximately 25,400 Unigene nonredundant human genes and covers 85% of the human genome. The gene description and annotation of these oligonu-cleotides were based on the Ensembl database (Cambridge, UK) dated from December 2006. The details of the whole protocol can be accessed through the web site: http://research.nhgri.nih.gov/nhgri_cores/ microarray.html. Briefly, fluorescence-labeled cDNA from each tumoral sample was hybridized to a microarray slide concomitantly with fluo-rescence-labeled reference cDNA prepared from normal human adrenal medulla (BD Biosciences Clontech, Palo Alto, CA). Each tumoral RNA was used in two independent labeling and hybridization experiments. Microarrays were subsequently scanned with a laser confocal scanner (Agilent Technologies, Palo Alto, CA), and the fluorescence intensities were measured in the spots and their surrounding areas. The values were filtered through quality control variables, analyzed, and quantified using the DEARRAY IPLab image processing package (Scanalytics, Fair-fax, VA). A dye bias analysis was performed on the reference and six tumoral samples when sufficient RNA was available. All the protocols are Minimum Information About a Microarray Experiment compliant. The data were subjected to a set of filtering criteria, statistical analysis, and gene selection based on a difference in P value as described else-where (3). First, the average spot quality score (which ranges from zero,
FIG. 1. A, Unsupervised hierarchical
clustering of benign (B) and malignant (M) pheochromocytoma samples based on gene expression profiling. B, Super-vised hierarchical clustering of pheo-chromocytomas (columns) and genes identified by microarray analysis (rows) on the basis of their expression profile. Dendrograms of tumoral samples (above the matrix) and genes (at the left of the matrix) represent similarities in gene expression profiles. Genes with a relatively higher level of expression in benign compared with malignant tu-mors are shown in green, and those with a lower level are shown in red according to the color scale at the bottom. Only genes exhibiting a differential expres-sion with P⬍ 0.001 were included in this analysis. The name of each gene is indicated at the right of the matrix [not applicable (NA) indicates expressed se-quence tags (ESTs) with no functional annotation]. The number of each tumor is indicated above the matrix. Malig-nant tumors correspond to the first nine columns, and benign ones correspond to the last nine columns as grouped by the clustering method described in Materi-als and Methods.
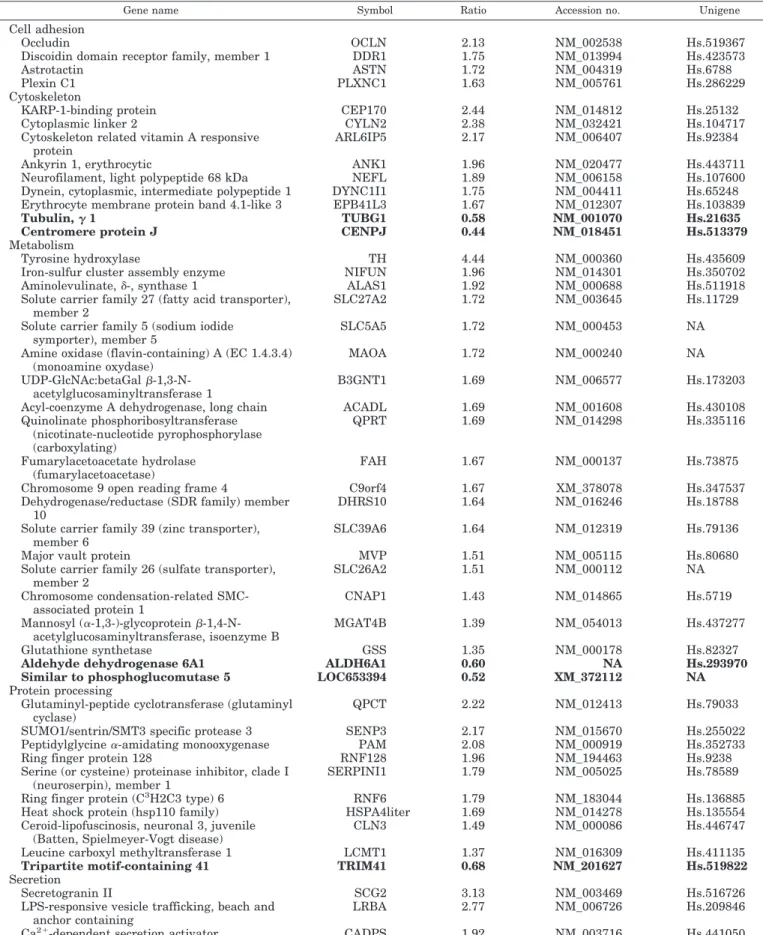
TABLE 1. Ratios of gene expression in benign vs. malignant pheochromocytomas for differentially expressed genes
Gene name Symbol Ratio Accession no. Unigene
Cell adhesion
Occludin OCLN 2.13 NM_002538 Hs.519367
Discoidin domain receptor family, member 1 DDR1 1.75 NM_013994 Hs.423573
Astrotactin ASTN 1.72 NM_004319 Hs.6788
Plexin C1 PLXNC1 1.63 NM_005761 Hs.286229
Cytoskeleton
KARP-1-binding protein CEP170 2.44 NM_014812 Hs.25132
Cytoplasmic linker 2 CYLN2 2.38 NM_032421 Hs.104717
Cytoskeleton related vitamin A responsive protein
ARL6IP5 2.17 NM_006407 Hs.92384
Ankyrin 1, erythrocytic ANK1 1.96 NM_020477 Hs.443711
Neurofilament, light polypeptide 68 kDa NEFL 1.89 NM_006158 Hs.107600
Dynein, cytoplasmic, intermediate polypeptide 1 DYNC1I1 1.75 NM_004411 Hs.65248
Erythrocyte membrane protein band 4.1-like 3 EPB41L3 1.67 NM_012307 Hs.103839
Tubulin,␥ 1 TUBG1 0.58 NM_001070 Hs.21635 Centromere protein J CENPJ 0.44 NM_018451 Hs.513379
Metabolism
Tyrosine hydroxylase TH 4.44 NM_000360 Hs.435609
Iron-sulfur cluster assembly enzyme NIFUN 1.96 NM_014301 Hs.350702
Aminolevulinate,␦-, synthase 1 ALAS1 1.92 NM_000688 Hs.511918
Solute carrier family 27 (fatty acid transporter), member 2
SLC27A2 1.72 NM_003645 Hs.11729
Solute carrier family 5 (sodium iodide symporter), member 5
SLC5A5 1.72 NM_000453 NA
Amine oxidase (flavin-containing) A (EC 1.4.3.4) (monoamine oxydase)
MAOA 1.72 NM_000240 NA
UDP-GlcNAc:betaGal -1,3-N-acetylglucosaminyltransferase 1
B3GNT1 1.69 NM_006577 Hs.173203
Acyl-coenzyme A dehydrogenase, long chain ACADL 1.69 NM_001608 Hs.430108
Quinolinate phosphoribosyltransferase (nicotinate-nucleotide pyrophosphorylase (carboxylating) QPRT 1.69 NM_014298 Hs.335116 Fumarylacetoacetate hydrolase (fumarylacetoacetase) FAH 1.67 NM_000137 Hs.73875
Chromosome 9 open reading frame 4 C9orf4 1.67 XM_378078 Hs.347537
Dehydrogenase/reductase (SDR family) member 10
DHRS10 1.64 NM_016246 Hs.18788
Solute carrier family 39 (zinc transporter), member 6
SLC39A6 1.64 NM_012319 Hs.79136
Major vault protein MVP 1.51 NM_005115 Hs.80680
Solute carrier family 26 (sulfate transporter), member 2 SLC26A2 1.51 NM_000112 NA Chromosome condensation-related SMC-associated protein 1 CNAP1 1.43 NM_014865 Hs.5719 Mannosyl (␣-1,3-)-glycoprotein -1,4-N-acetylglucosaminyltransferase, isoenzyme B MGAT4B 1.39 NM_054013 Hs.437277 Glutathione synthetase GSS 1.35 NM_000178 Hs.82327
Aldehyde dehydrogenase 6A1 ALDH6A1 0.60 NA Hs.293970 Similar to phosphoglucomutase 5 LOC653394 0.52 XM_372112 NA
Protein processing
Glutaminyl-peptide cyclotransferase (glutaminyl cyclase)
QPCT 2.22 NM_012413 Hs.79033
SUMO1/sentrin/SMT3 specific protease 3 SENP3 2.17 NM_015670 Hs.255022
Peptidylglycine␣-amidating monooxygenase PAM 2.08 NM_000919 Hs.352733
Ring finger protein 128 RNF128 1.96 NM_194463 Hs.9238
Serine (or cysteine) proteinase inhibitor, clade I (neuroserpin), member 1
SERPINI1 1.79 NM_005025 Hs.78589
Ring finger protein (C3H2C3 type) 6 RNF6 1.79 NM_183044 Hs.136885
Heat shock protein (hsp110 family) HSPA4liter 1.69 NM_014278 Hs.135554
Ceroid-lipofuscinosis, neuronal 3, juvenile (Batten, Spielmeyer-Vogt disease)
CLN3 1.49 NM_000086 Hs.446747
Leucine carboxyl methyltransferase 1 LCMT1 1.37 NM_016309 Hs.411135
Tripartite motif-containing 41 TRIM41 0.68 NM_201627 Hs.519822
Secretion
Secretogranin II SCG2 3.13 NM_003469 Hs.516726
LPS-responsive vesicle trafficking, beach and anchor containing
LRBA 2.77 NM_006726 Hs.209846
TABLE 1. Continued
Gene name Symbol Ratio Accession no. Unigene
G protein-coupled receptor-associated sorting protein
GASP 1.92 XM_377032 Hs.113082
Synaptotagmin-like 3 SYTL3 1.75 XM_087804 Hs.436977
Synaptosomal-associated protein 25 SNAP25 1.60 NM_130811 Hs.167317
Pleckstrin and Sec7 domain containing 3 PSD3 1.42 NM_015310 Hs.521426
Mal, T-cell differentiation protein 2 MAL2 1.35 NM_052886 Hs.76550
Signaling
Protein tyrosine phosphatase, receptor type, O PTPRO 2.77 NM_030671 Hs.160871
Dickkopf homolog 3 (Xenopus laevis) DKK3 2.77 NM_013253 Hs.130865
IL13 receptor,␣ 2 IL13RA2 2.63 NM_000640 Hs.336046
Protein phosphatase 1A (formerly 2C), magnesium-dependent,␣ isoform
PPM1A 2.56 NM_177951 Hs.130036
Neuropeptide Y NPY 2.38 NM_000905 Hs.1832
IL1, IL1B 2.08 NM_000576 Hs.126256
Leukocyte cell-derived chemotaxin 2 LECT2 2.04 NM_002302 Hs.512580
Membrane protein, palmitoylated 2 (MAGUK p55 subfamily member 2)
MPP2 2.27 NM_005374 Hs.436326
Calcium/calmodulin-dependent protein kinase II CAMK2N1 1.92 NM_018584 Hs.197922
Sphingomyelin phosphodiesterase 1, acid lysosomal (acid sphingomyelinase)
SMPD1 1.75 NM_000543 Hs.77813
Protein kinase C,⑀ PRKCE 1.75 NM_005400 Hs.155281
Target of Myb protein 1 TOM1 1.72 O60784 Hs.474705
DAZ interacting protein 1 DZIP1 1.69 NA Hs.60177
Ankyrin repeat and SOCS box-containing 4 (ASB4), transcript variant 2
ASB4 1.67 NM_145872 Hs.413226
Period homolog 2 (Drosophila) PER2 1.59 NM_022817 Hs.410692
HIV TAT specific factor 1 HTATSF1 1.52 NM_014500 Hs.204475
Low-density lipoprotein receptor (familial hypercholesterolemia)
LDLR 1.49 NM_000527 Hs.213289
Ankyrin repeat and SOCS box-containing 13 ASB13 1.47 NM_024701 Hs.300063
IL2 receptor,␥ (severe combined immunodeficiency)
IL2RG 0.63 NM_000206 Hs.84 Hairy/enhancer-of-split related with YRPW
motif 1
HEY1 0.59 NM_012258 Hs.234434 Immediate early response 3 IER3 0.59 NA Hs.591785 Colony stimulating factor 2
(granulocyte-macrophage)
CSF2 0.56 NM_000758 Hs.1349 Zinc finger protein 496 ZNF496 0.51 NA Hs.22051
Unknown
MYCBP associated protein MYCBPAP 3.33 NM_032133 Hs.398196
Hypothetical protein FLJ10178 FLJ10178 2.94 NA Hs.274267
␦-Notch-like EGF repeat-containing transmembrane
DNER 2.44 NM_139072 Hs.234074
KIAA1946 KIAA1946 2.17 NP_803237 Hs.172792
Similar to hypothetical protein FLJ20234 NA 2.13 BC008091 NA
Chromosome 14 open reading frame 1 C14orf1 2.13 NM_007176 Hs.15106
TPR domain containing STI2 STI2 2.08 NA Hs.376300
Similar to KIAA1110 protein LOC400855 2.04 XM_375928 NA
DKFZP564O123 protein CHMP2B 1.92 NM_014043 Hs.11449
Fibronectin type III domain containing 3 FNDC3A 1.92 NM_014923 Hs.103329
DKFZp761K2024 protein NA 1.89 AL161983 Hs.21415
Ectonucleotide
pyrophosphatase/phosphodiesterase 4 (putative function)
ENPP4 1.89 XM_376503 Hs.54037
Brain expressed X-linked 2 BEX2 1.85 NM_032621 Hs.398989
Interferon-induced protein with tetratricopeptide repeats 1
IFIT-1 1.85 NA Hs.20315
DKFZP434F2021 protein C3orf17 1.85 NM_015412 Hs.377974
Nuclear receptor interacting protein 2 NRIP2 1.82 NM_031474 NA
Loss of heterozygosity, 11, chromosomal region 2, gene A
LOH11CR2A 1.82 NM_014622 Hs.152944
Cyclin-dependent kinase-like 3 CDKL3 1.79 NM_016508 Hs.105818
Likely ortholog of mouse hypoxia induced gene 1 HIGD1A 1.75 NM_014056 Hs.7917
Olfactory receptor, family 6, subfamily W, member 1 pseudogene
OR6W1P 1.75 NR_002140 NA
Zinc finger, FYVE domain containing 28 ZFYVE28 1.72 NA Hs.292056
Potassium channel tetramerization domain containing 9
KCTD9 1.72 AA_H68518 Hs.72071
Myotubular myopathy 1 MTM1 1.69 NM_000252 Hs.386205
aspect of this disease because of a lack of a reliable diagnostic
tools or an effective therapeutic treatment. Gene expression
profiling appeared as an attractive approach to gain insights
into malignancy of this disease. Therefore, several studies
have been initiated to compare the transcriptomes of benign
and malignant pheochromocytomas using different tumor
collections (11, 12). Analysis of our series of tumors using
pangenomic microarrays revealed that the differential
ex-pression of a set of approximately 100 genes may distinguish
the two tumor types.
Several observations indicate the validity of the
microar-ray results obtained. First, differential expression was
con-firmed by quantitative PCR for a selection of genes. Second,
unsupervised clustering clearly distinguished the two types
of tumors based on differential gene expression and
aggre-gated the malignant hereditary cases. Third, although we
included mainly sporadic tumors in our initial analysis, the
genes selected for validation were found to be differentially
expressed in a larger sample collection (31 tumors), further
adding a measure of confidence in the data presented here.
One of the most important findings of the present study is
that the expression of the 100-gene set could discriminate
benign and malignant pheochromocytomas, as revealed by
unsupervised clustering of microarray data, while blinded to
clinical information. This result indicates that gene
expres-sion profiling of pheochromocytoma may represent a
po-tentially useful test to evaluate the prognosis of tumors at the
primary site and before metastasis occurrence, and to guide
preventive treatment in the case of malignant neoplasms.
The case of patient no. 6 is very interesting because this
benign tumor was classified by unsupervised clustering
among malignant, but close to benign, tumors. This finding
suggests that this tumor may have a potential malignant
genotype/phenotype and, therefore, that microarray
analy-sis may allow a more accurate classification of
pheochromo-cytoma subtypes. Unsupervised clustering also revealed two
groups of benign tumors that segregated separately. Because
only sporadic benign tumors have been included in the
present study, this segregation is not due to any known
hereditary disease. The reason for this separate clustering of
benign tumors remains to be identified.
A high number (
⬎80%) of differentially expressed genes
was underexpressed in malignant pheochromocytomas.
Among these, several encode neuroendocrine factors
in-volved in prominent characteristics of chromaffin cell
biol-ogy such as catecholamine metabolism, e.g.
fumarylacetoac-etate hydrolase and monoamine oxidase, hormone secretion,
like synaptotagmin-like 3 and secretogranin II, and peptide
processing, such as QPCT and PAM. The synthesis and
re-lease of biologically active peptides are some of the most
important features of the neuroendocrine phenotype, and
adrenochromaffin cells are known to produce a wide range
of such peptides (13). The present study revealed lower
ex-pression of three key genes encoding peptide processing and
activation factors, i.e. PAM, QPCT and neuroserpin, in
ma-lignant pheochromocytomas. The instrumental role of PAM
in the amidation and, therefore, the activity of peptides
reg-ulating adrenal medulla and pheochromocytoma cells, such
as NPY, is well known (14). Interestingly, increased
expres-sion of PAM and target peptides has been linked to
neu-roendocrine differentiation in human prostate cancer (15).
The expression of the enzyme responsible for cyclization of
N-terminal glutaminyl residues in peptides, QPCT, is also
down-regulated in malignant tumors, further indicating that
malignant transformation of pheochromocytoma is
associ-ated with reduced bioactive peptide processing compared
TABLE 1. ContinuedGene name Symbol Ratio Accession no. Unigene
Chromosome 9 open reading frame 5 C9orf5 1.64 NM_032012 Hs.418097
Hypothetical protein LOC169834 LOC169834 1.64 XM_095965 NA
Immediate early response 3 interacting protein 1 IER3IP1 1.64 NM_016097 Hs.406542
Chromosome 15 open reading frame 30 poly (ADP-ribose) polymerase family, member 16
PARP16 1.61 NM_017851 Hs.30634
Sperm-associated antigen 1 SPAG1 1.59 NM_172218 Hs.408747
RUN domain containing 1 RUNDC1 1.56 NM_173079 Hs.218182
Hypothetical protein FLJ32954 FAM82A 1.56 NA Hs.9905
Likely ortholog of chicken chondrocyte protein with a poly-proline region
MTFR1 1.56 NM_014637 Hs.170198
Family with sequence similarity 3, member A FAM3A 1.47 NM_021806 Hs.289108
KIAA0476 KIAA0476 0.69 XM_375806 Hs.6684 S-adenosylhomocysteine hydrolase-like 1 AHCYL1 0.61 NM_006621 Hs.485365 L1 element L1.39 p40 and putative p150
genes
NA 0.61 U93574 NA Similar to histone H2B.n (H2B/n) (H2B.2) H2B.2 0.58 XM_373001 NA T-complex 11 (mouse) TCP11 0.54 NM_018679 Hs.435371 Hypothetical protein FLJ20574 FLJ20574 0.54 NA Hs.123427
The functional clustering, the name, symbol, ratio of their expression in benign and malignant tumors, GenBank accession no., and Unigene cluster are indicated for each gene. Genes overexpressed in malignant tumors are indicated in bold with a ratio lower than one. The ratios were calculated from values of gene expression in benign and malignant tumors reported to the reference values measured in normal adrenal medulla. Only gene expression differences exhibiting a statistical significance at P⬍ 0.001 (Student’s t test) are presented. DAZ, Deleted in azoospermia; EGF, epidermal growth factor; FAM, family with sequence similarity; FYVE, Fab1-YOTB/ZK632.12-Vac1-EEA1; KARP-1, Ku86 autoantigen related protein-1; LPS, lipopolysaccharide; MAGUK, membrane-associated guanylate kinases; MYCBP, c-myc binding protein; NA, not ap-plicable; RUN, RPIP8-UNC-14-NESCA; SMC, structural maintenance of chromosomes; SMT, S-adenosyl-methionine-sterol-C-methyltrans-ferase; SOCS, suppressor of cytokine signalling; SUMO, small ubiquitin-related modifier; TAT, transactivating regulatory protein; TPR, tetratricopeptide repeat.
with benign tumors. Finally, the transcripts of neuroserpin,
a serine-protease inhibitor whose expression is associated
with neuroendocrine differentiation (16), were also less
abundant in malignant pheochromocytomas.
Besides, the expression of characteristic cytoskeleton
genes is altered in malignant compared with benign
pheo-chromocytomas. For instance, the
␥-tubulin gene, which
en-codes a constituent of centrosomes overexpressed in
differ-ent cancers (17), was more highly expressed in malignant
pheochromocytomas. Conversely, the expression of
astro-tactin and plexin C1, which are involved in cell adhesion (18,
19), was down-regulated in malignant tumors. Finally, the
gene expression of occludin, a major component of tight
junctions (20), was also repressed in malignant tumors,
sug-gesting a possible diminution of cell-to-cell contacts and an
increased permeability in malignant pheochromocytomas.
In conclusion, we have made use of a pangenomic
mi-croarray to identify a gene set that may represent a valuable
prognostic classifier of pheochromocytomas. This work
pro-vides leads for new diagnostic and prognostic markers, and
potential therapeutic strategies. The findings have also
pro-vided insights into the biology of pheochromocytomas,
showing that numerous genes encoding neuroendocrine
proteins were less expressed in malignant compared with
benign tumors.
Acknowledgments
Received June 5, 2007. Accepted September 10, 2007.
Address all correspondence and requests for reprints to: Dr. Y. Anouar, Institut National de la Sante´ et de la Recherche Me´dicale U413, Laboratory of Cellular and Molecular Neuroendocrinology, Institut Fe´de´ratif de
Re-cherche Multidisciplinaires sur les Peptides 23, University of Rouen, 76821 Mont-Saint-Aignan, France. E-mail: [email protected].
This work was supported by Institut National de la Sante´ et de la Recherche Me´dicale (U413), Conseil Re´gional de Haute-Normandie, Fe´de´ration des Maladies Orphelines, Ligue de Recherche Contre le Can-cer de Haute-Normandie, Association pour la Recherche sur le CanCan-cer, and the grant PHRC AOM 02068 from Institut National de la Sante´ et de la Recherche Me´dicale and Ministe`re De´le´gue´ a` la Recherche et aux Nouvelles Technologies for the COMETE Network.
Disclosure Statement: The authors have nothing to disclose.
References
1. Amar L, Bertherat J, Baudin E, Ajzenberg C, Bressac-de Paillerets B, Chabre
O, Chamontin B, Delemer B, Giraud S, Murat A, Niccoli-Sire P, Richard S, Rohmer V, Sadoul JL, Strompf L, Schlumberger M, Bertagna X, Plouin PF, Jeunemaitre X, Gimenez-Roqueplo AP2005 Genetic testing in pheochromo-cytoma or functional paraganglioma. J Clin Oncol 23:8812– 8818
2. Neumann HP, Bausch B, McWhinney SR, Bender BU, Gimm O, Franke G,
Schipper J, Klisch J, Altehoefer C, Zerres K, Januszewicz A, Eng C, Smith WM, Munk R, Manz T, Glaesker S, Apel TW, Treier M, Reineke M, Walz MK, Hoang-Vu C, Brauckhoff M, Klein-Franke A, Klose P, Schmidt H, Maier-Woelfle M, Peczkowska M, Szmigielski C, Eng C2002 Germ-line mutations in nonsyndromic pheochromocytoma. N Engl J Med 346:1459 –1466 3. Eisenhofer G, Huynh TT, Pacak K, Brouwers FM, Walther MM, Linehan
WM, Munson PJ, Mannelli M, Goldstein DS, Elkahloun AG2004 Distinct gene expression profiles in norepinephrine- and epinephrine-producing hereditary and sporadic pheochromocytomas: activation of hypoxia-driven angiogenic pathways in von Hippel-Lindau syndrome. Endocr Relat Cancer 11:897–911
4. Woodward ER, Maher ER 2006 Von Hippel-Lindau disease and endocrine tumour susceptibility. Endocr Relat Cancer 13:415– 425
5. Koch CA, Pacak K, Chrousos GP 2002 The molecular pathogenesis of hered-itary and sporadic adrenocortical and adrenomedullary tumors. J Clin Endo-crinol Metab 87:5367–5384
6. Lenders JW, Eisenhofer G, Mannelli M, Pacak K 2005 Phaeochromocytoma. Lancet 366:665– 675
7. Manger WM 2006 Diagnosis and management of pheochromocytoma–recent advances and current concepts. Kidney Int 70(Suppl 1):S30 –S35
8. Chen Y, Kamat V, Dougherty ER, Bittner ML, Meltzer PS, Trent JM 2002
FIG. 2. Comparative quantitation of QPCT, PAM, NPY, and CAMKIIN␣ gene expression in malignant vs. benign pheochromocytomas. A statistical analysis was performed on 11 ma-lignant and 20 benign pheochromocytomas. Results show differential expression of all genes in malignant vs. benign tumors. mRNA levels were determined by quantitative real-time PCR as described in Materials and Methods.
Ratio statistics of gene expression levels and applications to microarray data analysis. Bioinformatics 18:1207–1215
9. Allander SV, Nupponen NN, Ringner M, Hostetter G, Maher GW,
Gold-berger N, Chen Y, Carpten J, Elkahloun AG, Meltzer PS2001 Gastrointes-tinal stromal tumors with KIT mutations exhibit a remarkably homogeneous gene expression profile. Cancer Res 61:8624 – 8628
10. Vandesompele J, De Preter K, Pattyn F, Poppe B, Van Roy N, De Paepe A,
Speleman F2002 Accurate normalization of real-time quantitative RT-PCR data by geometric averaging of multiple internal control genes. Genome Biol 3:RESEARCH0034
11. Anouar Y, Yon L, Guillemot J, Thouennon E, Barbier L, Gimenez-Roqueplo
AP, Bertherat J, Lefebvre H, Klein M, Muresan M, Grouzmann E, Plouin PF, Vaudry H, Elkahloun AG2006 Development of novel tools for the diagnosis and prognosis of pheochromocytoma using peptide marker immunoassay and gene expression profiling approaches. Ann NY Acad Sci 1073:533–540 12. Brouwers FM, Elkahloun AG, Munson PJ, Eisenhofer G, Barb J, Linehan
WM, Lenders JW, De Krijger R, Mannelli M, Udelsman R, Ocal IT, Shulkin BL, Bornstein SR, Breza J, Ksinantova L, Pacak K2006 Gene expression profiling of benign and malignant pheochromocytoma. Ann NY Acad Sci 1073:541–556
13. Ait-Ali D, Turquier V, Grumolato L, Yon L, Jourdain M, Alexandre D, Eiden
L, Vaudry H, Anouar Y2004 The proinflammatory cytokines tumor necrosis factor-␣ and interleukin-1 stimulate neuropeptide gene transcription and se-cretion in adrenochromaffin cells via activation of extracellularly regulated
kinase 1/2 and p38 protein kinases, and activator protein-1 transcription factors. Mol Endocrinol 18:1721–1739
14. Eipper BA, Milgram SL, Husten EJ, Yun HY, Mains RE 1993 Peptidylglycine ␣-amidating monooxygenase: a multifunctional protein with catalytic, pro-cessing, and routing domains. Protein Sci 2:489 – 497
15. Rocchi P, Boudouresque F, Zamora AJ, Muracciole X, Lechevallier E, Martin
PM, Ouafik L2001 Expression of adrenomedullin and peptide amidation activity in human prostate cancer and in human prostate cancer cell lines. Cancer Res 61:1196 –1206
16. de Groot DM, Martens GJ 2005 Expression of neuroserpin is linked to neu-roendocrine cell activation. Endocrinology 146:3791–3799
17. Kronenwett U, Huwendiek S, Castro J, Ried T, Auer G 2005 Characterization of breast fine-needle aspiration biopsies by centrosome aberrations and genomic instability. Br J Cancer 92:389 –395
18. Zheng C, Heintz N, Hatten ME 1996 CNS gene encoding astrotactin, which supports neuronal migration along glial fibers. Science 272:417– 419 19. Tamagnone L, Artigiani S, Chen H, He Z, Ming GI, Song H, Chedotal A,
Winberg ML, Goodman CS, Poo M, Tessier-Lavigne M, Comoglio PM
1999 Plexins are a large family of receptors for transmembrane, secreted, and GPI-anchored semaphorins in vertebrates. Cell [Erratum (2001) 104: following 320] 99:71– 80
20. Li Y, Fanning AS, Anderson JM, Lavie A 2005 Structure of the conserved cytoplasmic C-terminal domain of occludin: identification of the ZO-1 binding surface. J Mol Biol 352:151–164