Analysis of realistic ultrawideband indoor communication
channels by using an efficient ray-tracing based method
The MIT Faculty has made this article openly available.
Please share
how this access benefits you. Your story matters.
Citation
Tiberi, G. et al. “Analysis of Realistic Ultrawideband Indoor
Communication Channels by Using an Efficient Ray-Tracing Based
Method.” Antennas and Propagation, IEEE Transactions on 57.3
(2009): 777-785. © 2009 IEEE
As Published
http://dx.doi.org/10.1109/TAP.2009.2013432
Publisher
Institute of Electrical and Electronics Engineers
Version
Final published version
Citable link
http://hdl.handle.net/1721.1/53582
Terms of Use
Article is made available in accordance with the publisher's
policy and may be subject to US copyright law. Please refer to the
publisher's site for terms of use.
Analysis of Realistic Ultrawideband Indoor
Communication Channels by Using an
Efficient Ray-Tracing Based Method
Gianluigi Tiberi, Stefano Bertini, Wasim Q. Malik, Senior Member, IEEE,
Agostino Monorchio, Senior Member, IEEE, David J. Edwards, and Giuliano Manara, Fellow, IEEE
Abstract—A fundamental step in ultrawideband (UWB) com-munication system design involves the characterization of the in-door propagation channel. In this paper, we show that the UWB propagation channel parameters can be accurately predicted by employing ray tracing (RT) simulation carried out at various fre-quencies over the signal bandwidth. It is important to note that the determination of the rays reaching a given location is made only once, as the RT algorithm is independent of frequency. A par-allel ray approximation (PRA) is used to significantly improve the computational efficiency of the RT based method. Moreover the accuracy of the approximation is verified through a measurement campaign.
Index Terms—Angle of arrival (AoA), indoor propagation, par-allel rays, ray-tracing, ultrawideband (UWB) channel.
I. INTRODUCTION
U
LTRAWIDEBAND (UWB) technology is an ideal can-didate for short-range and broadband indoor wireless communication systems. Its application gives rise to special radio propagation scenarios and conditions not fully investi-gated. In particular, a fundamental step in UWB communication systems involves the characterization of the indoor propagation channel. The frequency selectivity of the propagation process introduces fundamental differences between UWB channels and conventional (narrowband) channels. Various channel modeling techniques can be used to describe the UWB channel [1]: it is possible to use statistical modeling based on frequency or time domain measurement campaigns or to use deterministic modeling based on simulations. To date, ray tracing (RT) based approaches have been widely used to characterize theManuscript received March 17, 2008; revised July 19, 2008. Current version published March 27, 2009. This work was supported in part by the Fondazione Cassa di Risparmio di Pisa. This work was presented in part at the IEEE Int.
Conf. on Ultrawideband, Singapore, Sep. 24–26, 2007.
G. Tiberi, S. Bertini, A. Monorchio, and G. Manara are with the Department of Information Engineering, University of Pisa, I-56122 Pisa, Italy (e-mail: [email protected]; [email protected]; [email protected]; [email protected]).
W. Q. Malik is with the Department of Brain and Cognitive Sciences, Massa-chusetts Institute of Technology, Cambridge, MA 02139 USA, and also with the Department of Anesthesia and Critical Care, Massachusetts General Hospital, Harvard Medical School, Harvard University, Boston, MA 02114 USA (e-mail: [email protected]).
D. J. Edwards is with the Department of Engineering Science, University of Oxford, Oxford OX1 3PJ, U.K. (e-mail: [email protected]).
Color versions of one or more of the figures in this paper are available online at http://ieeexplore.ieee.org.
Digital Object Identifier 10.1109/TAP.2009.2013432
indoor channel for both narrowband and wideband systems. The technique has been extended to UWB channels [2] by the superposition of RT for individual frequency components [3]–[6]. An alternative time-domain approach, based on the addition of the impulse responses of individual rays, was presented in [7]. However, RT based techniques, although accurate, are computationally intensive. In order to provide an accurate site-planning assessment and to extract the statistics of the channel, RT simulations must be performed for a large amount of points, and this leads to unacceptably large compu-tational times. Therefore, a major aim of RT based approaches is the reduction of the computational cost, which is linearly proportional to the number of spatial points where the RT is performed.
In this paper, we propose a novel and efficient procedure to extract the UWB propagation channel parameters that employs an RT simulation carried out at various frequencies. In partic-ular, the determination of the rays reaching a given location, which represents the most time-consuming part of the RT al-gorithm, is made only once at the beginning of the procedure. Moreover, an approach based on the parallel ray approxima-tion (PRA) is introduced and successfully used to further reduce the computational cost: it allows us to obtain the frequency re-sponses on a spatial grid of points by employing the RT sim-ulation on a coarser spatial grid, through the assumption that points located nearby are reached by the same number of rays having same amplitudes but different phases. The accuracy and validity of the aforementioned assumption are verified through the analysis of the error, a feature not available in conventional parallel ray based approaches. A measurement campaign has been conducted to validate the propagation simulator. The ex-cellent agreement between simulation results and measured data proves that the RT based tool can be used for accurate and re-liable site-planning in UWB systems. As an alternative, it can also be employed for developing statistical propagation models. In this context, it has to be pointed out that, in contrast to mea-surements, RT allows detailed signal and environment specifi-cation; therefore it can facilitate more comprehensive and flex-ible UWB channel characterization, as for instance the impact of the frequency on the statistics of the channel, with the addi-tional benefits of efficiency and convenience.
The paper is organized as follows: Section II provides the RT based analysis, highlighting the parallel ray approximation and its accuracy check, whereas in Section III the measurement cam-paign is described. Numerical results and comparisons are given in Section IV, and in Section V some conclusion are drawn.
778 IEEE TRANSACTIONS ON ANTENNAS AND PROPAGATION, VOL. 57, NO. 3, MARCH 2009
II. RT BASEDANALYSIS
A. Formulation
The radio channel experienced at a receiver’s location in a given environment is modelled as a time-in-variant linear filter with location-dependent impulse response . The impulse response provides the characterization of the propagation channel and contains all the information neces-sary to analyze any type of transmission over that channel [8].
If we transmit a signal , the signal received at a given
loca-tion can be expressed as . In
wire-less communications, the signal arriving at the receiver usually consists of several multipath components, each one resulting from the interaction between the transmitted signal and the sur-rounding environment. Thus, the channel frequency response , i.e., the Fourier transform (FT) of , can be seen as a superposition of these contributions, one for each ar-riving path. Each contribution is assumed to have constant am-plitude and linear phase variation over the signal bandwidth [9]; in particular, the linear phase variation is determined by the dis-tance a multipath component propagates, whereas the variation due to the interactions with the surrounding environment is ne-glected. However, the former assumption causes a loss of accu-racy as the signal bandwidth grows, since the multipath compo-nents behavior is actually determined by frequency-dependent phenomena occurring in the environment, such as reflection, transmission and scattering. Therefore, since UWB communi-cation systems span very large bandwidths, typically up to sev-eral gigahertz, the transfer function of the channel is frequency-selective. The calculation of the frequency response is a key point for UWB channel modeling. In this section the fre-quency response will be derived through a RT procedure, while in the next section it will be derived through measurements. It should be pointed out that, if the channel is considered to be inclusive of the antenna pair, the angular-frequency distortion introduced by the UWB antennas has to be taken into account too.
B. Calculation of the Frequency Response Through RT
Let us consider now a transmitted signal , whose spec-trum is sampled over the band at the frequencies . The samples of the spectrum of the received signal are thus expressed as
(1) From (1), the samples of the channel’s frequency response can be obtained by taking the ratio of the received signal to the transmitted signal . Then, an inverse discrete Fourier transform (IDFT) provides the sampled version of
(2) Note that . In our approach, the samples of the frequency response can be determined by employing a RT simulator [9], where the signal source is a set of dipoles
transmitting continuous wave (CW) carriers at the frequencies .
The RT tool “EMvironment 3.0” used in this study is an efficient fully three-dimensional (3-D) simulator based upon a combination of binary space partition and image theory derived from Computer Graphics, and was developed at the Microwave and Radiation Laboratory of the University of Pisa, Italy [10]. Firstly, the ray paths are identified; then complex vector electromagnetic field components are evaluated in terms of plane waves undergoing multiple phenomena of reflection, transmission and diffraction. The reflected field is evaluated through geometrical optics (GO), where the number of rays depends on the maximum order of the bouncing allowed, which is set a priori. Moreover, first-order diffractions from the edges are evaluated through heuristic uniform geometrical theory of diffraction (UTD) dyadic diffraction coefficients, valid for discontinuities in impedance surfaces. Transmissions through walls and objects are evaluated by resorting to a multilayered media description [11].
Apparently, the procedure described above can be rather CPU expensive, depending on the number of frequency samples. However, it is worth noting that the most time-consuming part of the RT algorithm is the determination of the rays reaching a given location, and this need be made only once at the begin-ning of the procedure. The low-complexity calculation of the received signal is then repeated times.
C. Parallel Ray Approximation
For providing an accurate site-planning for realistic indoor environments and for extracting the statistics of the channel, the frequency response has to be calculated for a large amount of points. The computational cost of RT-based tools is linearly proportional to the number of spatial points where it is per-formed; therefore it would be desirable to avoid, when pos-sible, this brute-force procedure [12]. In this subsection, an ap-proach based on the parallel ray approximation is introduced: it allows us to obtain the frequency responses on the spatial grid of points by employing the RT simulation on a coarser spatial grid, through the assumption that points located nearby are reached by the same number of rays with the same amplitudes but dif-ferent phases.
In this respect, let us consider a location and let us as-sume that the RT procedure has been performed for , so that
and therefore are known. Denoting by the number of rays reaching , it holds
(3)
where are the frequency responses which refer to the -ray, respectively. If is located near , and is not in a transition from a lit to a shadow region, it is reasonable to assume that the variations of number and magnitude of multi-path components reaching with respect to are negligible [12], [13]. Therefore, the multipath components reaching can be simply obtained by a proper phase shift of the multipath components reaching . Denoting by the position of the
transmitter, the parallel ray approximation can be used when the following condition holds:
(4) (5) where represents the wavelength at the lowest frequency. Consequently, phase shifts are calculated by evaluating the path length differences obtained by projecting the distances
on the unit vectors , which define the multipath com-ponents. Therefore, it holds
(6)
Then, an inverse DFT (IDFT) will provide the sampled version of
(7)
The proposed procedure allows the calculation of , avoiding a new RT simulation. Moreover, it is worth mentioning that the procedure is site-specific since it uses site-specific in-formation contained in the unit vectors of the multipath components reaching , while in other, more conventional, approaches the phase shifts are usually considered uniformly distributed random variables [13]. The parallel ray approxi-mation can be used when (4) and (5) are satisfied. In order to investigate the accuracy of the parallel ray approximation, let
us indicate with and the frequency
and impulse response of (7), i.e., analytically synthesized through parallel ray approximation, and with and the frequency and impulse response calculated by performing a RT simulation for . It holds
(8) The following mean square error can be calculated
(9)
An accurate approximation, i.e., ,
implies a low error. The error in (9) depends on ; since is obtained from , i.e., by using the re-sults of the RT performed at , it can be expected that a region around exists where the error increases with the distance between and . Therefore, by setting a threshold , it is possible to calculate a distance for which it holds
(10) The distance represents the limit within which the parallel ray approximation can be applied having guaranteed the required
level of accuracy; it can be determined numerically as shown in Section IV.
It is worth mentioning that the parallel ray approximation modifies the spatial correlation between two points; in fact, given and , the spatial correlation is
(11) when the RT is employed for both points, while it is
(12) when the RT is employed for only. It can be shown that for small distances , (11), and (12) provide very similar values, although a slight increase of the spatial correlation is expected when using (12).
Finally, it should be clearly pointed out that (9), (11) and (12) involve integrals of continuous functions. Since the impulse re-sponses used in this context are sampled functions, the integrals are replaces by summations. Note that the time step, i.e., the time resolution, is related to the signal bandwidth, , whereas the impulse response span is related to the frequency step. In this paper, we assume a time resolution of 0.1 ns and an impulse re-sponse span of 60 ns.
III. MEASUREMENTSPROCEDURE
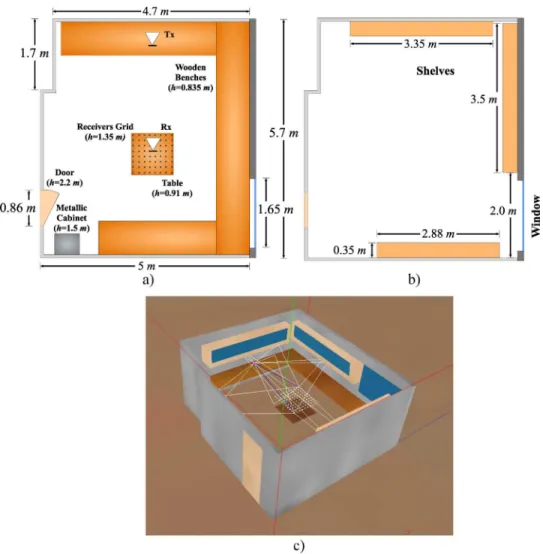
Frequency-domain UWB channel measurements were con-ducted in a typical indoor environment that consisted of a laboratory of the Communications Research Group at the University of Oxford, with block walls, concrete floors and ceiling, a large glass window, a wooden door, metallic and wooden furniture (benches, tables, shelves), as shown in Fig. 1(a) and (b). A vector network analyzer (VNA) arrangement was used to sound the channel at dis-crete frequency in the UWB band , where
and [14]. The measurement bandwidth was thus and the resolution of the measurement was . The system was calibrated prior to the measurement to remove frequency-dependent attenuation and phase distortion.
Discone antennas, vertically polarized and omnidirectional in the azimuth plane, were used to conduct the measurement [15]. The location of the transmitting antenna was fixed, while the receiver antenna was stationed atop a computer-controlled horizontal position grid with dimensions 0.5 m 0.5 m and 1 cm 1 cm of resolution, leading to a 50 50 measure-ment points grid; both the line of sight (LoS) and the not line of sight (NLoS) cases were considered. In particular, an absorbing plane was positioned between the transmitting antenna and the receivers grid for creating NLoS conditions. It was verified that the grid was entirely in LoS (or, alternatively, entirely in NLoS), to guarantee the consistency of the channel modeling exercise. A careful adjustment was done for both antennas to be exactly at the same height and in vertical position to avoid any polariza-tion mismatch. For each receiver locapolariza-tion, the discrete complex frequency transfer function was recorded; it is worth mentioning that the measured frequency transfer function includes the effect of the antennas within the channel [15], [16].
780 IEEE TRANSACTIONS ON ANTENNAS AND PROPAGATION, VOL. 57, NO. 3, MARCH 2009
Fig. 1. (a) A plan view of the measurement environment, LoS case: the room is5:7 m 2 5 m 2 2:6 m, the transmitter (Tx) and the receivers are located at the same height of 1.35 m. Additional scenario information: the transmitter is positioned 2.38 m and 0.7 m from the walls, respectively; the separation distance between the transmitter and the centre of the grid is 2.5 m; the dimensions of the metallic cabinet are0:5 m 2 0:6 m 2 1:5 m; the depth of the benches is 0.8 m; the 1.65 m2 1.15 m widow is at a height of 1.1 m from the floor. All the other dimensions can be derived directly from the figure, since it is a scale drawing. (b) Three wooden shelves with the front part made of glass are displaced along the three walls; the shelves are placed at a height of 1.5 m from the floor, and have a height of 0.75 m. All the other dimensions can be derived directly from the figure, since it is a scale drawing. (c) Pictorial view of the RT reconstructed scenario (ceiling not shown), LoS case; the transmitter and the receivers (white dots grid) are also shown.
IV. NUMERICALRESULTS
A. Scenario Reconstruction
The scenario has been reconstructed in the RT simulator [Fig. 1(c)]. Particular care has been used for including windows, doors and furniture with appropriate electrical properties, as summarized in Table I. Additional scenario information can be found in caption to Fig. 1. We have assumed in this study that the electrical properties do not depend appreciably on the frequency within the band of interest; however a pronounced variation of the electrical properties with frequency can be easily taken into account using this technique. A spatial grid of 50 50 points was placed over the same 0.5 m 0.5 m area which was used for the measurements. The number of bouncing rays has been set to 4 for the LoS case and to 5 for NLoS case after a detailed investigation of the convergence of the simulation results. Moreover, the frequency dependent radiation pattern of a discone antenna has been applied at both the transmitter and the receiver, individually [15]. Note that this can be easily done since in the RT simulation both the angle of departure (AoD) and the angle of arrival (AoA) are known.
For each point, the frequency response can be determined by employing the RT simulator [17], where the signal source is a set of dipoles transmitting continuous wave (CW) carriers at the same frequencies employed by the VNA. The NLoS case has been created by reproducing the measurement procedure, i.e., by positioning an absorbing plane between the transmitting antenna and the receivers.
B. Validation of the Parallel Ray Approximation
In order to avoid the brute-force ray tracing for deriving all the 50 50 frequency responses, the parallel ray approximation is used. The first step concerns the determination of the distance defined in Section II. To this purpose, a point
of the 50 50 spatial grid is chosen; the frequency response is calculated for LoS case by employing the RT; the impulse response is derived through an IDFT, re-moving the propagation delay. Next, we calculate the impulse responses analytically synthesized through parallel ray approximation, for moving along the -axes of the grid. Then, the impulse responses are obtained by performing RT simulations for the same points ,
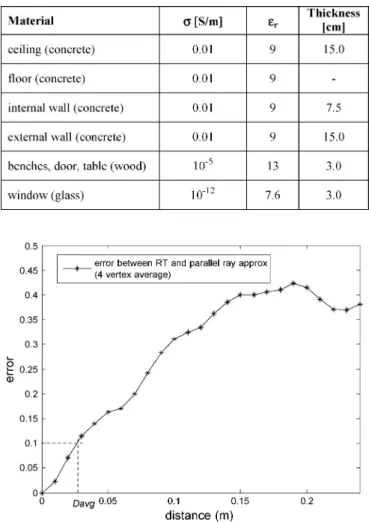
TABLE I
PROPERTIES OF THEMATERIALSEMPLOYED INSIMULATIONS
Fig. 2. Mean square error between the impulse responses analytically synthe-sized through the parallel ray approximation fromu RT data and the impulse responses calculated by performing new RT simulations; the abscissa denotes the distance betweenu and u . In particular, the curve refers to an average of the errors calculated by picking the four vertex, separately, and moving along both the axes of the grid.
and the error between and is calculated as given in (9). Finally, by setting a threshold , it is possible to define a limit for the distance within which the parallel ray approximation can be applied having guaranteed the required level of accuracy. Obviously, different choices of or will lead to different curves of the error and therefore to dif-ferent values for . In order to determine a value for to be used all over the grid, the following procedure is adopted: the errors are calculated by picking the four vertex, separately, and moving along both the axes of the grid; then, an average of the errors is obtained and used for calculating an average distance, . Note that the determination of is made only once at the beginning of the RT analysis. In Fig. 2 the four vertex av-erage error is plotted; by setting the threshold , we get . We note that, in terms of wavelengths, this
value is , where represents the
wave-length at the lowest (highest) frequency.
The parallel ray approximation permits a dramatic reduction in the computational cost of the RT-based tool, since it allows us to obtain the frequency responses on a spatial grid by employing
Fig. 3. The RT is performed atu , then, for each point whose distance from u is less than D , the parallel ray approximation is adopted. Note that the parameterD , determines the points where the RT has to be performed (points marked with crosses).
the RT simulation on a coarser spatial grid. In particular, refer-ring to the scenario given in Section IV-A where a spatial grid of 50 50 points is defined, the 50 50 frequency responses have been calculated by employing the RT simulation on a spa-tial grid of 10 10 points only. Fig. 3 gives a pictorial view of the aforementioned procedure: the RT is employed at the point of the spatial grid; then, for each point whose distance from is less than , the parallel ray approximation is adopted, using the results of the RT performed at . Note that the pa-rameter determines the points where the RT has to be per-formed (points marked with crosses in Fig. 3).
The conventional approach based on the Fresnel distance re-lationship states that the parallel ray approximation can be used within a region whose largest dimension is equal to
to obtain a phase error less than . In our context, we obtain . Note that
imposes a much more limiting condition on the use of the par-allel rays approximation, and guarantees the required level of accuracy (i.e. a mean square error on the impulse response of less than 0.1).
The computational time for the RT simulation depends on the complexity of the reconstructed scenario, the number of bouncing included and the number of spatial points; for the RT simulation described in this paper, the total computational time is approximately 12 hours (2.4 GHz Pentium IV with 1 GB RAM). Note that this computational time is obtained when the afore-mentioned parallel ray approximation is adopted, while it grows up to 32 hours for the conventional RT procedure (see Table II). The parallel ray approximation permits a time saving of approximately 62%; moreover, the time saving can be even increased by setting a higher level for the error threshold . It is worth pointing out that a further efficiency improvement deals with a reduction of the number of frequency samples where the field is computed. This reduction can be achieved by splitting the UWB into several bands, computing the field at the central frequencies of such bands and assuming that, for each band, each multipath contribution has constant amplitude and
782 IEEE TRANSACTIONS ON ANTENNAS AND PROPAGATION, VOL. 57, NO. 3, MARCH 2009
TABLE II
COMPUTATIONALTIMECOMPARISON
linear phase variation. In particular, the phase variation is deter-mined both by the distance a multipath component propagates and by the interaction with the surrounding environment, where the latter is assumed to show a linear phase variation too. The determination of such bands appears non-trivial and will be the subject of further research.
Finally, it should be noted that other approaches for modeling indoor propagation channels of wide-band communication sys-tems are usually based on FDTD methods. However, although they are rigorous and also applicable to complex inhomoge-neous dielectric structures, they turn out to be much more time-and CPU-consuming.
C. Power Delay Profile Analysis
Next, from each of the 50 50 frequency responses, the im-pulse response has been derived through IDFT; the propagation delay has been removed, and a spatial average has been calcu-lated to obtain the power delay profile (PDP). The RT derived PDP has been compared with the measured PDP. In particular, the measured frequency responses have been processed in the following way: for each point of the measurement grid the im-pulse response has been derived through IDFT; the propagation delay has been removed from it; a spatial average has been per-formed to obtain the measured PDP.
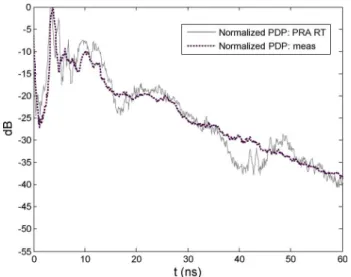
In Fig. 4, the measured normalized PDP (dotted line) and the normalized PDP calculated through the PRA RT procedure (gray continuous line) are plotted for the LoS case: the two curves show a good agreement. A check on the correlation co-efficient between the two curves has been performed, leading to a value of 0.85. Some differences can be observed in the 40 ns region: these differences are apparent only for higher order con-tributions (from 3rd order and above) and they are presumably due to an imperfect reconstruction of the scenario in terms of furniture and dielectric properties of the materials. Indeed, it can be shown that the RT derived PDP is sensitive to these sce-nario features, while it is robust towards the reconstruction of the scenario in terms of its dimensions. Fig. 5 refers to the NLoS case; also in this case a good match between the curves can be observed.
D. Statistical Characterization of the Channel Parameters
The results presented in the previous subsection show that RT simulators can be effectively employed to characterize the UWB channel with good accuracy. In this subsection, delays and AoAs will be analyzed with the purpose of showing the ca-pability of the RT based procedure for deriving statistical UWB propagation models. A similar approach can be applied for sta-tistical modeling of others quantities such as AoDs or time of arrivals (ToAs).
Fig. 4. Comparison of the PDPs, LoS case (measured and simulated). The ab-scissa denotes the time exceeding that of the first arrived ray.
Fig. 5. Comparison of the PDPs, NLoS case (measured and simulated). The abscissa denotes the time exceeding that of the first arrived ray.
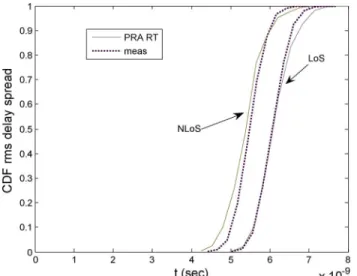
Fig. 6 shows the cumulative distribution function (CDF) of the delay spread for both LoS and NLoS cases. The dotted lines have been obtained by constructing the CFD after calcu-lating the delay spread from the measurements when using a 25 dB threshold for the impulse responses. The gray contin-uous lines have been obtained by constructing the CFD after calculating the delay spread from the simulated data when using the same 25 dB threshold for the impulse responses. The curves compare very well. Moreover, by using the RT pro-cedure, the impact of the antenna characteristics can be easily highlighted; in fact, if the frequency dependent radiation pattern of one discone antenna is not applied at both the transmitter and the receiver, the pure channel characteristics, i.e. without an-tennas effects, can be investigated. This shows the capability of RT for facilitating comprehensive channel characterization, with the additional benefit of efficiency and convenience.
Turning now to the AoA, let us consider again the location and let us assume that the RT has been performed for ,
Fig. 6. Cumulative distribution function (CDF) of the rms delay spread (mea-sured and simulated).
so that and therefore are known. Denoting with the number of rays reaching , it holds
(13) (14)
and represent the frequency and impulse responses which refer to the ray, respectively. For each ray, RT provides the AoAs for both the elevation and the az-imuth plane, . Next, a cutoff threshold of 30 dB below the strongest ray is applied to ensure that only effective paths are modeled. This procedure is required since in the RT the paths are determined purely geometrically; conversely, here only the AoAs which refer to the dominant paths shall be taken into ac-count for statistical characterization. Therefore, the power asso-ciated with each ray is calculated, and the rays having a power less than 30 dB below the strongest one are not considered.
The impulse response which refers to the th ray, and con-sequently, the associated power, is calculated from (14) by per-forming the integral all over the band . In order to highlight the effect of the frequency on the statistic of AoAs, we can divide the band in a number of subbands and perform the integral in (14) over the subbands separately. The set of rays reaching a single location will change with frequency; therefore, also the AoAs statistics will result to be frequency-dependent.
Fig. 7 shows the probability density function (pdf) of az-imuthal AoAs for the LoS case, when considering two distinct subbands (3.1–4.85 and 6.2–9.7 GHz) and a threshold of 30 dB. Some differences can be noted between the pdfs of the two subbands, and this highlights the impact of frequency on channel statistics.
From the figure, it is possible to visually define a number of clusters. Some propagation studies have been reported for UWB channel, showing that clustering can be observed in the tem-poral and the angular domains [2], [18]; in our understanding “clusters” are a group of multipath components showing sim-ilar AoAs. Two peaks can be observed at 270 and 90 ; these
Fig. 7. Probability density function (pdf) of azimuthal AoAs when considering two distinct subbands (3.1–4.85 and 6.2–9.7 GHz), LoS case. The pdfs have been obtained numerically by using the RT simulated data.
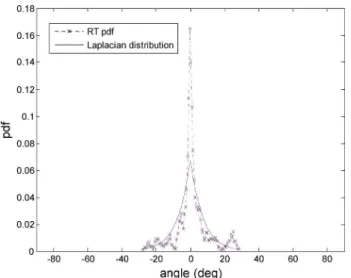
values correspond to AoAs aligned and opposite to transmitter-received direction, respectively. Then, the pdf of AoA with re-spect to the cluster means, i.e., intracluster arrival, has been ob-tained and compared to Gaussian and Laplacian distribution [2], [19]. A chi-square fitness test has been performed for both the low-band and high-band case, and it was determined that the in-tracluster arrivals are best fit to the Laplacian distribution with density
(15)
The parameter of and have been found
for the low-band and high-band case, respectively. Note that the previous parameters are very similar to those given in [19], where the same measured data used in this paper have been processed to extract the angular statistics, obtaining
and for the low and high subband, respectively. Fig. 8 shows the pdf of azimuthal AoAs with respect to the cluster means when considering the low frequency subband (3.1–4.85 GHz): the dotted line represent the pdf obtained numerically by using the RT data, while the continuous line represent the best fit Laplacian density distribution. A slight discrepancy between the curves can be observed: the higher amplitude at 0 of the RT data pdf is due to the purely geomet-rical calculation of the AoAs in the RT procedure, while the side lobes of the same curve can be related to truncation effects in the spatial grid.
The same approach can be applied when considering the NLoS case. Fig. 9 shows the probability density function- pdf of azimuthal AoAs for the NLoS case when considering two distinct subbands (3.1–4.85 and 6.2–9.7 GHz) with a threshold of 30 dB. Note that Fig. 9 differs from Fig. 7; in particular, the two peaks placed at 270 and 90 are lower in the NLoS than in LoS case, being the transmitter-received direction obstructed. Again, it was determined that the intracluster arrivals are best fit to Laplacian distribution with parameter and
784 IEEE TRANSACTIONS ON ANTENNAS AND PROPAGATION, VOL. 57, NO. 3, MARCH 2009
Fig. 8. Probability density function (pdf) of azimuthal AoAs with respect to the cluster means when considering the 3.1–4.85 GHz subband. Dotted line repre-sents the pdf which has been calculated numerically by using the RT data; con-tinuous line represents the best fit Laplacian density distribution.
Fig. 9. Probability density function-pdf of azimuthal AoAs when considering two distinct subbands (3.1–4.85 and 6.2–9.7 GHz), NLoS case. The pdfs have been obtained numerically by using the RT simulated data.
V. CONCLUSION
We presented an efficient procedure based on a ray-tracing method for analyzing indoor UWB channels. The RT simula-tions are carried out at various frequencies over the signal band-width, , and the impulse response is then extracted. It is impor-tant to note that the RT algorithm is independent of frequency; therefore, the determination of the rays reaching a given loca-tion is made only once. Moreover, a parallel ray approximaloca-tion, usually adopted in array analysis, is successfully used to dra-matically reduce the computational time. The accuracy and the validity limit of the aforementioned approximation are verified through the analysis of the prediction error, a feature not avail-able in conventional parallel ray based approaches. An excel-lent agreement with measurements is achieved, demonstrating the effectiveness of the method for accurate site-planning in re-alistic indoor environments. The proposed RT procedure can be used for investigating many aspects of the UWB channel, such as the impact of antenna effects on the channel, or the angular and multipath spread. As an alternative, it can be employed for developing statistical propagation models. As an example, we
have analyzed the impact of frequency on the multipath angle of arrival statistics.
REFERENCES
[1] A. F. Molisch, “Ultrawideband propagation channels—Theory, mea-surement, and modelling,” IEEE Trans. Veh. Technol., vol. 54, no. 5, pp. 1528–1545, Sep. 2005.
[2] , B. Allen, M. Dohler, E. E. Okon, W. Q. Malik, A. K. Brown, and D. J. Edwards, Eds., Ultra-Wideband Antennas and Propagation for
Communications, Radar and Imaging. London, U.K.: Wiley, 2006. [3] F. Tehoffo-Talom, B. Uguen, E. Plouhinec, and G. Chassay, “A
site-specific tool for UWB channel modeling,” in Proc. Int Workshop on
UWB Syst. and Technol., May 18–21, 2004, pp. 61–65.
[4] Y. Zhang and A. K. Brown, “Ultrawide bandwidth communication channel analysis using 3-D ray tracing,” in Proc. Int Symp. on
Wire-less Comm. Syst., Sep. 20–22, 2004, pp. 443–447.
[5] H. Sugahara, Y. Watanabe, T. Ono, K. Okanoue, and S. Yarnazaki, “Development and experimental evaluations of “RS-2000”—A propa-gation simulator for UWB systems,” in Proc. IEEE Int. Workshop Ultra
Wideband Syst. Joint With Conf. Ultra Wideband Syst. Technol., Kyoto,
Japan, May 18–21, 2004, pp. 76–80.
[6] W. Q. Malik, C. J. Stevens, and D. J. Edwards, “Spatio-temporal ultra-wideband indoor propagation modelling by reduced complexity geo-metric optics,” IET Commun, vol. 1, no. 4, pp. 751–759, Aug. 2007. [7] A. M. Attiya and A. Safaai-Jazi, “Simulation of ultra-wideband indoor
propagation,” Microw. Opt. Tech. Lett., vol. 42, Jul. 2004.
[8] T. K. Sarkar, Z. Ji, K. Kim, A. Medouri, and M. Salazar-Palma, “A survey of various propagation models for mobile communication,”
IEEE Antennas Propag. Mag., vol. 45, no. 3, Jun. 2003.
[9] M. F. Catedra and J. P. Arriaga, Cell Planning for Wireless
Communi-cations. Boston, MA: Artech House, 1999.
[10] [Online]. Available: http://www.iet.unipi.it/emvironment/
[11] H. Cory, S. Shiran, and M. Heilper, “An iterative method for calcu-lating the shielding effectiveness and light transmittance of multilay-ered media,” IEEE Trans Electromagn. Compat., vol. 35, no. 4, pp. 451–456, Nov. 1993.
[12] K. H. Ng, E. K. Tameh, and A. R. Nix, “Modelling and performance prediction for multiple antenna systems using enhanced ray tracing,” in
Proc. IEEE Wireless Comm. and Networking Conf., Mar. 13–17, 2005,
vol. 2, pp. 933–937.
[13] A. F. Molisch, M. Steinbauer, M. Toeltsch, E. Bonek, and R. S. Thomä, “Capacity of MIMO systems based on measured wireless channel,”
IEEE J. Sel. Areas Commun., vol. 20, no. 3, pp. 561–569, Apr. 2002.
[14] A. M. Street, L. Lukama, and D. J. Edwards, “Use of VNAs for wide-band propagation measurements,” Proc. Inst. Elect. Eng. Commun., vol. 148, no. 6, pp. 411–415, Dec. 2001.
[15] W. Q. Malik, D. J. Edwards, and C. J. Stevens, “Angular-spectral antenna effects in ultrawideband communications links,” Proc. Inst.
Elect. Eng. Commun., vol. 153, no. 1, Feb. 2006.
[16] W. Q. Malik, C. J. Stevens, and D. J. Edwards, “Ultrawideband antenna distortion compensation,” IEEE Trans. Antennas Propag., vol. 56, no. 7, pp. 1900–1907, Jul. 2008.
[17] G. Tiberi, S. Bertini, A. Monorchio, F. Giannetti, and G. Manara, “A computationally efficient ray-tracing technique for modeling ultraw-ideband indoor propagation channels,” IET Microw. Antennas Propag., accepted for publication.
[18] C. Chong, C. Tan, D. I. Laurenson, S. McLaughlin, M. A. Beach, and A. R. Nix, “A new statistical wideband spatio-temporal channel model for 5-GHz band WLAN systems,” IEEE J. Sel. Areas in Commun., vol. 21, no. 2, pp. 139–150, Feb. 2003.
[19] Y. Zhang, A. K. Brown, W. Q. Malik, and D. J. Edwards, “High resolution 3-D angle of arrival determination for indoor UWB multi-path propagation,” IEEE Trans. Wireless Commun., vol. 7, no. 8, pp. 3047–3055, Aug. 2008.
Gianluigi Tiberi received the Laurea degree in
telecommunication engineering and the Ph.D. de-gree from the University of Pisa, Pisa, Italy, in 2000 and 2004, respectively.
In 2000, he was a Visiting Researcher at the Centre for Telecommunication Research at King’s College London, London, U.K. In October 2000, he joined the Microwave and Radiation Laboratory, Department of Information Engineering, University of Pisa. From September to December 2002, he was a Visiting Ph.D. Researcher at the Electromagnetic Communication Laboratory, Pennsylvania State University. He is currently conducting his postdoctoral research at the University of Pisa. His research in-terests include high-frequency derived approaches for solving electromagnetic
scattering problems, electromagnetic propagation in complex environment, and ultrawideband indoor channel modeling.
Dr. Tiberi, jointly with the Department of Engineering Science, University of Oxford, received a Marie Curie Intra European Fellowship for Career Develop-ment, Seventh Research Framework Programme (id. FP7-PEOPLE-2007-2-1-IEF).
Stefano Bertini received the Laurea degree in
telecommunication engineering from the University of Pisa, Pisa, Italy, in 2005.
In October 2005, he joined the Microwave and Ra-diation Laboratory, Department of Information En-gineering, University of Pisa, where he is currently enrolled in the Ph.D. program. From March to July 2008, he was a Visiting Researcher at the Electro-magnetic Communication Laboratory, Pennsylvania State University, University Park. His research inter-ests include numerical methods for solving aperture antennas problems and high-frequency methods for electromagnetic propaga-tion in complex environments.
Wasim Q. Malik (S’97–M’05–SM’08) received the
B.E. degree from the National University of Sciences and Technology, Pakistan, in 2000 and the D.Phil. de-gree from the University of Oxford, Oxford, U.K., in 2005, both in electrical engineering.
From 2005 to 2007, he was a Research Fellow at the University of Oxford and a Junior Research Fellow in Science at Wolfson College, Oxford. Since 2007, he has been a Postdoctoral Fellow at the Massachusetts Institute of Technology, Cambridge. In 2008, he also joined the Massachusetts General Hospital, Harvard Medical School, Harvard University, Boston, as a Research Fellow. He has published in excess of 70 papers in refereed journals and conferences. He was an editor of Ultra-Wideband Antennas and Propagation
for Communications, Radar and Imaging (UK: Wiley, 2006) and International Journal of Ultra Wideband Communications and Systems.
Dr. Malik is a Member of the Society for Neuroscience. He received the ESU Lindemann Science Fellowship in 2007, the Best Paper Award in the ARMMS RF and Microwave Conf. (Steventon, U.K., 2006), and the Association for Com-puting Machinery (ACM) Recognition of Service Award in 2000. He was the lead Guest Editor of the IET Microwaves Antennas and Propagation Special Issue on Antenna Systems and Propagation for Future Wireless Communica-tions, December 2007. He routinely serves on the organizing and technical pro-gram committees of a number of international conferences.
Agostino Monorchio (S’89–M’96–SM’04) received
the Laurea degree in electronics engineering and the Ph.D. degree in methods and technologies for envi-ronmental monitoring from the University of Pisa, Pisa, Italy, in 1991 and 1994, respectively.
During 1995, he joined the Radio Astronomy Group, Arcetri Astrophysical Observatory, Florence, Italy, as a Postdoctoral Research Fellow, working in the area of antennas and microwave systems. He has been collaborating with the Electromagnetic Communication Laboratory, Pennsylvania State University (Penn State), University Park, where he is an Affiliate of the Computational Electromagnetics and Antennas Research Laboratory. He has been a Visiting Scientist at the University of Granada, Spain, and at the Communication University of China in Beijing. He is currently an Associate Professor in the School of Engineering, University of Pisa, and Adjunct Professor at the Italian Naval Academy of Livorno. He is also an Adjunct
Professor in the Department of Electrical Engineering, Penn State. He is on the Teaching Board of the Ph.D. course in “Remote Sensing" and on the council of the Ph.D. School of Engineering “Leonardo da Vinci" at the University of Pisa. His research interests include the development of novel numerical and asymptotic methods in applied electromagnetics, both in frequency and time domains, with applications to the design of antennas, microwave systems and RCS calculation, the analysis and design of frequency-selective surfaces and novel materials, and the definition of electromagnetic scattering models from complex objects and random surfaces for remote sensing applications. He has been a reviewer for many scientific journals. He has been supervising various research projects related to applied electromagnetics commissioned and supported by national companies and public institutions.
Dr. Monorchio has served as Associate Editor of the IEEE ANTENNAS AND
WIRELESSPROPAGATIONLETTERS. He received a Summa Foundation Fellow-ship and a NATO Senior FellowFellow-ship.
David J. Edwards is a Professor of engineering
sci-ence and Fellow of Wadham College, Oxford, U.K. He has been an academic for 23 years after 12 years spent in industry (BT). He has acted as a consultant to a large number industrial organizations during his career, and has served on a number of national and international committees relating to the antennas and propagation fields, and is an industrial consultant in these areas. He has a strong record of innovation in communications systems, techniques and technolo-gies and has authored or coauthored approximately 400 publications during his time as an academic. Current research areas include communications systems, electromagnetics, magneto inductive waveguides, ad hoc networks, antennas and MIMO systems. He has been awarded a number of patents and several have appeared as licensed commercial products.
Prof. Edwards is a Fellow of the Institution of Engineering and Technology (IET), London, U.K. and the Royal Astronomical Society. He was the recipient of a number of awards and prizes for his work and has been extremely well sup-ported by funding from research councils, industry, and government agencies.
Giuliano Manara (F’04) was born in Florence,
Italy, on October 30, 1954. He received the Laurea (Doctor) degree in electronics engineering (summa
cum laude) from the University of Florence,
Flo-rence, Italy, in 1979.
Currently, he is a Professor at the College of Engineering, University of Pisa, Pisa, Italy, where, since 2000, he has been serving as the President of the Bachelor and the Master Programs in Telecom-munication Engineering. Since 1980, he has been collaborating with the Department of Electrical Engineering, Ohio State University, Columbus, where, in the summer and fall 1987, he was involved in research at the ElectroScience Laboratory. His research interests have centered mainly on the asymptotic solution of radiation and scattering problems to improve and extend the uniform geometrical theory of diffraction. In this framework, he has analyzed electromagnetic wave scattering from material bodies, with emphasis on the scattering from both isotropic and anisotropic impedance wedges. He has also been engaged in research on numerical, analytical and hybrid techniques (both in frequency and time domain), scattering from rough surfaces, frequency selective surfaces (FSS), and electromagnetic compatibility. More recently, his research has also been focused on the design of microwave antennas with application to broadband wireless networks, and on the development and testing of new microwave materials (metamaterials).
Prof. Manara has been serving as the Secretary/Treasurer of the Italian So-ciety on Electromagnetics (Società Italiana di Elettromagnetismo, SIEm), since 2000. In August 2008, he was elected Vice-Chair of the International Commis-sion B of URSI.