HAL Id: hal-01004698
https://hal.archives-ouvertes.fr/hal-01004698
Submitted on 2 Feb 2017HAL is a multi-disciplinary open access archive for the deposit and dissemination of sci-entific research documents, whether they are pub-lished or not. The documents may come from teaching and research institutions in France or abroad, or from public or private research centers.
L’archive ouverte pluridisciplinaire HAL, est destinée au dépôt et à la diffusion de documents scientifiques de niveau recherche, publiés ou non, émanant des établissements d’enseignement et de recherche français ou étrangers, des laboratoires publics ou privés.
A database for case histories and numerical modelling
Philippe Mestat, Yvon Riou
To cite this version:
Philippe Mestat, Yvon Riou. A database for case histories and numerical modelling. International Conference on Case Histories in Geotechnical Engineering, Apr 2004, New York, United States. pp.1-2. �hal-01004698�
A DATABASE FOR CASE HISTORIES AND NUMERICAL MODELLING
P. Mestat Y. Riou
Laboratoire Central des Ponts et Chaussées (LCPC) Ecole Centrale de Nantes (ECN)
Paris, France Nantes, France
ABSTRACT
This paper deals with a bibliographic database dedicated to the comparison between numerical results and in situ measurements for geotechnical structures. This database, called MOMIS, has been developed by LCPC and ECN for several years. To date, it comprises a total of 416 case histories. The generation of MOMIS has relied on a technologic watch in the field of numerical modelling. The database can be used to highlight modelling principles (in order to provide a guide for good modelling practice to users) and deviations between results given by numerical models and values measured on actual geotechnical structures. It also reflects the evolution of the accuracy of numerical computations.
INTRODUCTION
Numerical methods are now well established as an analysis tool in many engineering problems, and practical applications have been growing at prodigious rate in recent years. With the increase in modelling applications and computing codes, it becomes essential for users that the code be well validated for different point of view and the range of possible applications assessed in a reliable manner.
In the field of geotechnical engineering, validation of numerical codes is of uppermost importance for three reasons:
- results are used for the design (displacements of soil, forces and moments in structures, etc.);
- complex constitutive laws are involved for modelling the behaviour of soils and rocks ;
- complex computations are carried out by users. The validation of a numerical model is achieved in terms of agreement between numerical results and experimental data. Accordingly, a literature survey is indispensable. Over the past thirty years, only two qualitative compilations, by Duncan (1994) and Gens (1995), and a study devoted to undergrounded facilities (Negro et de Queiroz, 2000) have been produced. No actual quantitative "assessment" has ever been drawn of the deviations observed between numerical modeling efforts and measurement campaigns. In light of this lack of references necessary for evaluating the capacity of both soil constitutive laws and software to reproduce complex situations, the Laboratoire Central des Ponts et Chaussées (LCPC) and the Ecole Centrale de Nantes (ECN) have
instituted a technology watch program to inventory these comparisons and estimate the resultant "model error" (Mestat, 2001a).
This technology watch has covered more than four hundred case histories where comparisons between numerical predictions and field measurements have been reported (horizontal and vertical displacements, excess pore pressures, stresses, etc.). Only in situ measurements were considered. The physical models (laboratory tests 1g or centrifuged models) were not taken into account in this survey. As a means of collecting and processing these data, the MOMIS database has been developed.
MOMIS DATABASE
The bibliographic database, called MOMIS (acronym for “Modélisation des Ouvrages et Mesures In Situ”), comprises case histories originating from articles, conference papers, reports and doctoral theses identified as part of the technology watch program. The data set extends back to 1972, with entries being evenly distributed over time (figure 1).
The database currently contains 416 case histories corresponding to the modelling of embankments (84), tunnels (135), sheet-piled retaining structures (66), diaphragm walls (102) and embankments on improved soils (29). Figure 2 reveals that almost half of the cases studied originated in Europe, followed by Asia, North America, Africa and South America.
1970 1975 1980 1985 1990 1995 2000
Year cumulated
references
sheet pile walls : 66 diaphragm walls : 102 embankments : 84 tunnels : 135 0 50 100 N. America S. America Asia
Table 1. Number of comparisons with 2D FE analysis
Fig. 1. Cumulated number of references over thirty years
Africa
Europe
Fig. 2. Experiment locations
Following the classification by Lambe (1973), the vast majority of modeling efforts recorded (382 case studies) pertain to class C predictions (ie a posteriori predictions) and only 34 cases concern class A predictions (before construction without knowledge of measures). Class A predictions are the ideal type of prediction to evaluate the performance of numerical modelling. Unfortunately they tend to be rather rare. Their limited number is due to the cost of experiments and more predominantly to their time requirements, which seem to be incompatible with the constraints imposed by construction economics.
Even though class C predictions are less demonstrative, it is valuable and useful to draw lessons from these comparisons from both an engineering and research standpoint as well as to derive recommendations for subsequent modelling set-ups (choice of model and guidelines for controlling results) and to quantify the model error.
For each type of geotechnical structure, the number of case histories would seem high enough to be able to produce a statistical overview covering a thirty-year period of numerical computation-measurement comparisons. The complete list of references, relative to embankments and tunnels, have been published (Mestat, 2001b, 2002).
An electronic version using the ACCESS database management application is being implemented in coordination with the Civil Engineering Laboratory of the Ecole Centrale de Nantes (Mestat and Riou, 2002). This database is mainly devoted to Class A predictions. For now, the information relative to 13 blind prediction competitions is stored in 63 tables linked together in order to facilitate the data analysis.
For each case study eight families serve to organize and collate the following informations:
- type of analysis (drained vs. undrained condition, consolidation, dynamic, cyclical);
- composition of the ground;
- construction technique employed, actual dimensions of the structure;
- constitutive laws for natural soils and construction materials, parameters;
- computational model (dimensions, type of finite elements, mesh density, boundary conditions, loadings, time step, construction project phasing, interface laws, etc.);
- set of numerical data for the comparison between computation results and measured values;
- conclusions drawn from the comparison (maximum deviation, relative errors, etc.);
- bibliographical references.
For the same experimental case, several numerical studies may be generated; such is the case for example when holding a blind prediction competition or a comparison between several constitutive laws for soils.
REVIEW OF CASE HISTORIES IN MOMIS DATABASE The numerical studies were mainly two-dimensional finite element analyses (Table 1). Some more recent 3D analyses are included in the database (9% of the references). The quantitative comparisons between predicted results and field measurements depend on the geotechnical works.
Embankment (end of construction)
- maximum settlement on center line 39 - maximum lateral displacement in depth (toe of slope) 24 - maximum excess pore pressure on center line 16 Embankment (long term)
- maximum settlement on center line 38 - maximum lateral displacement in depth (toe of slope) 26 Tunnels (end of construction)
- maximum surface settlement (transversal model) 120 - point of inflexion of settlement trough 87
- crown settlement 30
- maximum horizontal displacement 32 Sheet-pile walls (end of construction)
- maximum horizontal displacement of the wall 69 - maximum settlement behind the wall 37 - maximum bending moment in the wall 24 Diaphragm walls (end of construction)
- maximum horizontal displacement of the wall 77 - maximum settlement behind the wall 19 - maximum bending moment in the wall 18
The data contained within MOMIS database can serve to analyse, in statistical terms, the characteristics of meshes and to highlight modelling principles.
Geometrical Finite Element Model
Given that embankments, retaining structures and tunnels quite often exhibit a much greater length than width, their performance is often studied using a transversal section in plane strain. From the MOMIS data, we can justify the minimum recommendations for meshes used in both vertical and horizontal directions (Table 2). These recommendations are valuable for the numerical models which need not incorporate the presence of substratum near the surface, obstacles or other neighbouring interactions. For the mesh density, there is no real information in the references stored in the database because authors tend to offer little comment on the choices inherent in carrying out geometrical discretization. Table 2. Minimum dimensions for 2D plane strain meshes
Structures Total length Total height
Embankments 3 L 4 h
Retaining structures 4 D 2 D
Tunnels 5 d 2,5 H
L=1/2 width of embankment base; h=embankment height; D=height of the wall; d=tunnel diameter; H=tunnel axis depth.
The majority of 3D models are made for tunneling problems: intersection of galleries, influence of tunnel face, construction sequences which is really 3D, etc. At present time, it is difficult to deal with 3D modeling because there are not many case histories. What we can observe is the following point : in 3D mesh, the section perpendicular to the tunnel axis has generally extensions similar to those fixed for a 2D modeling. For example, the ratio total height of mesh / tunnel axis depth is about 2 for 3D meshes reported in MOMIS database. Of course the 3D mesh density is less refined than for 2D mesh and often not sufficient. A future survey will be made with complementary publications even if there are no comparisons with measurements. It is essential to provide good recommendations for 3D numerical models.
Type of Analysis for Geotechnical Structures
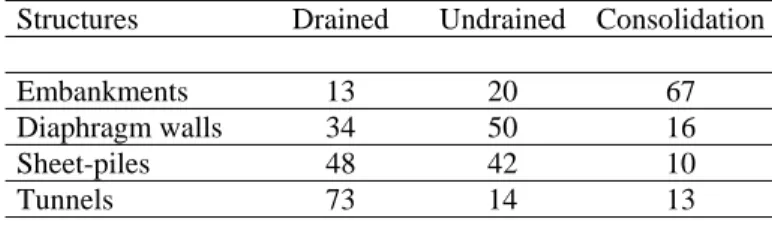
Three theoretical approaches are considered : undrained conditions (29%); drained conditions (46%) and consolidation (25%). From a historical perspective, the first two analyses preceded the third. Consolidation computations with non-linear behaviour were not possible before the existence of high-speed computers. Nevertheless, a comparison between modeling of embankments, tunnels and retaining structures shows a great difference in the types of analysis (percentages are listed in Table 3). The consolidation approach is rarer for tunnels and retaining structures.
Table 3. Type of analysis (%)
Structures Drained Undrained Consolidation
Embankments 13 20 67
Diaphragm walls 34 50 16
Sheet-piles 48 42 10
Tunnels 73 14 13
Constitutive Laws for Soils
The percentages of constitutive laws used for natural soils in the cases histories are listed in Table 4. The complexity of excavation sequences and computation time lead often to using simple constitutive laws for soil in the problems of tunnels and retaining structures: in more than 60% of case histories the constitutive law is elasticity (EL) or perfect plasticity (EP). On the other hand, the simple and monotonic loading in embankment problems allows to consider elastoplasticity with strain hardening or elasto-visco-plasticity for soft soils. Nevertheless the general trend has favored use of strain hardening models.
Table 4. Type of constitutive laws used for soils (%)
Structures EL EP EPH EVP HP
Embankments 11 12,5 49 27,5 0
Diaphragm walls 40 28 25 4 3
Sheet-piles 27,5 51 21,5 0 0
Tunnels 23,5 36,5 34 8 0
EL=linear or non linear elasticity; EP=elastoplasticity without hardening; EPH=elastoplasticity with hardening; EVP=elasto-visco-plasticity; HP=hypoplasticity.
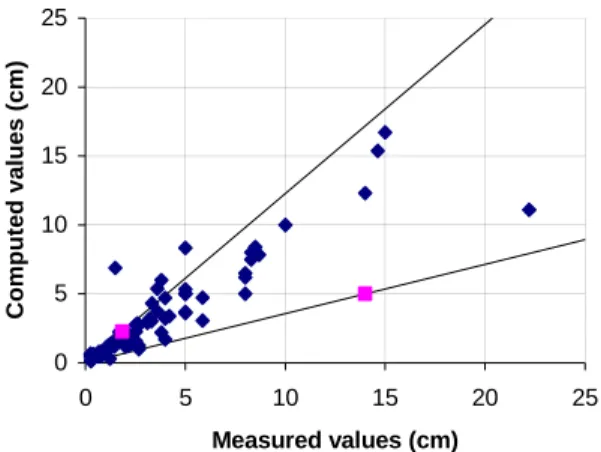
2D COMPUTATION MEASUREMENT COMPARISONS For 2D FEM modelling, comparisons between measured and computed values were made at the end of construction and at long term (particularly for embankments on soft soils). For example, the analysis of surface settlement in tunnel modelling can be achieved with figure 3 (settlement) and figure 4 (characteristics of trough).
Most class C predictions have led to relatively satisfactory results for the maximum vertical settlement on the surface at the end of construction (Figure 3). The points corresponding to computation values and measured values are primarily located within the boundaries defined by the results from class A predictions. This observation was expected because class C predictions can be improved by the knowledge of the measurements.
The quality of predictions focused on the settlement trough is also acceptable (distance of the point of inflexion, figure 4), but its width is generally overestimated.
0 5 10 15 20 25 0 5 10 15 20 25 Measured values (cm) C o mp u ted valu es ( c m)
Fig. 3. Comparison in the maximum settlement on the tunnel axis at the end of construction (squares represent class A predictions) 0 5 10 15 20 25 0 5 10 15 20 25 Measured values (cm) Computed values (cm)
Fig. 4. Comparison in the transverse distance of the point of inflexion of settlement trough
The measured values of maximum lateral displacements in depth are rarer. Figure 5 shows the comparisons between computed results and measurements provided by inclinometers near the tunnel axis.
0 1 2 3 4 5 0 1 2 3 4 5 Measured values (cm) C o mp u ted valu es (cm)
Fig. 5. Comparison in maximum lateral displacements in depth at the end of construction
Same diagrams can be drawn for embankments or retaining structures (Mestat and Riou, 2002; Mestat and Bourgeois, 2002). This analysis has enabled quantifying the model error committed during the modeling. During this year, a new synthesis has been made for all the references in the MOMIS database and new estimations of relative model errors provided on main measured variables.
ESTIMATION OF RELATIVE MODELLING ERRORS The modelling error is estimated after numerical computations, indeed it is the “sum” of the errors related to the software, its use, the hypotheses of modelling, the approach employed to obtain the mechanical and hydraulical parameters. In deriving this error, class A predictions are obviously the best fitted. Unfortunately they are rarer. Then all the references included in MOMIS database were taken into consideration.
For each geotechnical structure and each measured variable, five intervals are distinguished for the relative error e : [0, 25%], [25, 50%], [50, 75%], [75, 100%] and [100%, + ∞[. The relative error is the absolute value of the difference between the computed value and the measured value, divided by the measured value.
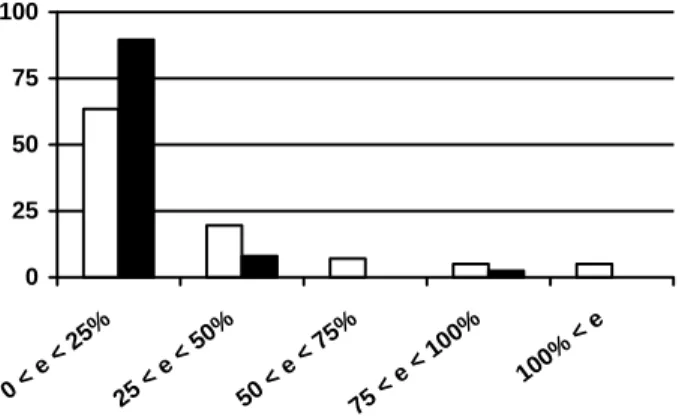
Figures 6 show the distribution of relative error for the maximum surface settlement (figure 6a) and the maximum lateral displacement at the toe (figure 6b). On the same figures, the results at the end of construction and at long term are represented. The quality of predictions is satisfactory for settlements specially at long term. In contrast the modeling of lateral soil movements is often unsatisfactory ; at short term only 58 % of the predictions reveal a relative error below 50 %, and 21% have a relative error of above 100%.
For retaining structures, best results are obtained with horizontal displacements of the wall (figure 7). On the other hand, vertical displacements on soil surface behind the wall (figure 7) and heave of the bottom excavation present important relative errors : 25% of case histories reveal a relative error of above 100%.
For tunnels, the modelling of the surface settlement is generally satisfactory (figure 8) and the distance to the point inflexion of settlement trough is well described. Even the width of trough is often overestimated by FE results, it is possible to simulate in satisfactory way the settlement trough when the mechanical parameters can be estimated with a sufficient precision.
Figures 6 and 9 show that FE models lead at present time to a poor simulation of lateral soil movements in the case of embankments and tunnels. In contrast figure 7 shows that horizontal movements of retaining structures are relatively well described and not the vertical soil movements. This difference confirms that the main movement of each geotechnical works is relatively well simulated by the
constitutive laws used in numerical models. Unfortunately it is not sufficient because a “good numerical model” must simulate simultaneously all the aspects of soil-structure behaviour. 0 25 50 75 100 0 < e < 25% 25 < e < 50% 50 < e < 75% 75 < e < 100 % 100% < e
(a) Maximum surface settlement on the embankment axis
0 25 50 0 < e < 25% 25 < e < 50% 50 < e < 75% 75 < e < 100 % 100% < e
(b) Maximum lateral displacement in depth (at the toe)
Fig. 6. Modelling errors for embankments – Comparison between results obtained at the end of construction (in white) and at long term (in black)
0 25 50 75 0 < e < 25% 25 < e < 50% 50 < e < 75% 75 < e < 100 % 100% < e
Fig. 7. Modelling errors for retaining structures – Comparisons between maximum horizontal displacement of the wall (horizontal lines) and maximum vertical displacement of soil surface behind the wall (vertical lines)
0 25 50 75 0 < e < 25% 25 < e < 50% 50 < e < 75% 75 < e < 100 % 100% < e
Fig. 8. Modelling errors for tunnels at the end of construction – Comparison between maximum settlement on the axis tunnel (in white) and the distance of the point of inflexion of the settlement trough (in black)
0 25 50 75 0 < e < 25% 25 < e < 50% 50 < e < 75% 75 < e < 100 % 100% < e
Fig. 9. Modelling errors for tunnels at the end of construction – Comparison between maximum surface settlement (in white) and maximum horizontal displacement tunnel in depth (in black)
ELECTRONIC DATABASE FOR CLASS A PREDICTIONS As regards the validation and demonstration of a model's capacity to predict structural behaviour, class A predictions (benchmarks) are the most incisive, yet remain the least frequent. In order to collect all the information about each benchmark and to provide better data access, an electronic database is developed (Mestat and Riou, 2002). At the present time its structure exclusively involves the class A predictions and the academic benchmarks (comparison of numerical calculations without measurement). The aim of this tool is to directly link the in-situ measurements with the predicted values (or predicted values with each other), the type and the parameters of the modelling. By this way, some useful indications regarding the current practice in modelling (discretization, boundary conditions, type of analysis, constitutive relationships, rheological parameters, etc.), their bias, the problems that the authors and participants encountered in these benchmarks, are expected.
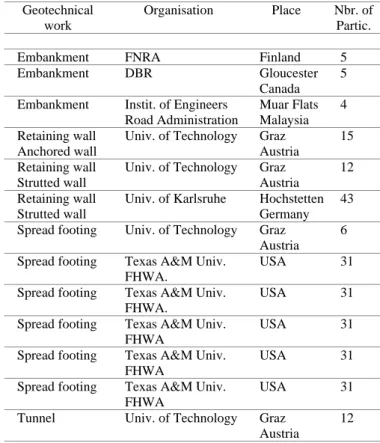
For now (august 2003), 13 benchmarks, 66 soil layers characterised by benchmark authors, 184 numerical modelling reports, 369 soil layers characterised by benchmark participants, 13 constitutive models, 6400 numerical results (settlements, horizontal displacements, water pore pressure, forces, moments) have been stored in the database (Table 5). In the database, benchmarks are distinguished by the reference data :
− industrials benchmarks with in situ measurements; − semi industrial benchmark with laboratory measurements; − academic benchmarks without reference (measurement) to a work. The aim of these benchmarks is to compare codes and settings up of modelling.
Table 5. Blind prediction competitions stored in the electronic database (references are listed in Riou et al. (2003))
Geotechnical work
Organisation Place Nbr. of Partic.
Embankment FNRA Finland 5
Embankment DBR Gloucester
Canada 5 Embankment Instit. of Engineers
Road Administration Muar Flats Malaysia 4 Retaining wall Anchored wall
Univ. of Technology Graz Austria
15 Retaining wall
Strutted wall
Univ. of Technology Graz Austria
12 Retaining wall
Strutted wall
Univ. of Karlsruhe Hochstetten Germany
43 Spread footing Univ. of Technology Graz
Austria 6 Spread footing Texas A&M Univ.
FHWA.
USA 31
Spread footing Texas A&M Univ. FHWA.
USA 31
Spread footing Texas A&M Univ. FHWA
USA 31
Spread footing Texas A&M Univ. FHWA
USA 31
Spread footing Texas A&M Univ. FHWA
USA 31
Tunnel Univ. of Technology Graz Austria
12
A first analysis of data contained in the database has been performed to know the use of constitutive models, the distribution of the values of some mechanical parameters, and the distribution of modelling error.
The analysis of constitutive models used in blind prediction competitions show the preponderance of Mohr-Coulomb models (54 %) and its distribution on the whole of geotechnical works seems in accordance with the idea of common practices in modelling, especially for projects (figure 10).
It is worth noting that elastoplastic models with no hardening are more currently used in class A predictions than in class C predictions. This fact is due to many reasons :
− for the purpose of comparisons, some benchmarks required the use of only one model. Mohr-Coulomb model is generally imposed as the more common model; − benchmark participants prefer a simple and robust model
(like for a project);
− some laboratory or in situ tests required for complex constitutive model are not available in the geotechnical report of the benchmark;
− class C predictions are often performed to test new sophisticated models. Sp rea d foo ting R etain in g w all Tu nnel Em bank m ent Moh r C oulo mb Dun can Mel anie Dru cker Pra ger Ela stic ité li néai re Har deni ng Iwas aki Mod sol Cam Cla y Dom asch uk Bar det Hyp opla stic ité Vis copl astic ity ( Seki guch i) Shea r H arde ning Zie nkie wic z/Pa nde Occu rren ces
Fig. 10. Constitutive relationships and geotechnical works modelling – Electronic database for class A predictions
0 20 40 60 80 100
The second study indicates the spread of Young’s modulus values in the Mohr-Coulomb model independently of the geotechnical work (see figure 11). The Young’s modulus used in these class A predictions is an “interpreted” value of soil stiffness. This value takes into account the rate of deformation in the geotechnical work. So, this figure exhibits a large scatter not representative of intrinsic elastic modulus. This distribution should be compared to the equivalent class C distribution in order to know the possible bias between “interpreted” value (class A prediction) and possible “adapted value” (class C prediction).
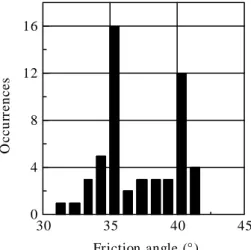
A similar analysis has been performed on friction angle of sand provided by participant using the Mohr-Coulomb model (see figure 12). In spite of its “more intrinsic” character, the scatter is very large: from 31 to 42 degrees. The distribution is uniform excepted for 35 and 40 degrees. No explanation is put forth, beyond the fact that 35 and 40 are multiple of five !!!
10k 100k 0 5 10 15 O ccu rr e n ces
Young m odulus (kPa )
Y oun g mo dulu s 1m dee p Y oun g mo dulu s 5m dee p Y oung mod ulus 10m dee p
Fig. 11. Young’s modulus distribution, Mohr Coulomb model (electronic database, class A predictions)
30 35 40 45 0 4 8 12 16 O cc u rr en ces Friction angle (°)
Fig. 12. Friction angle distribution, Mohr Coulomb model, (electronic database, class A predictions)
At least, an example of numerical modelling error distribution is provided in figures 13 and 14. The error expression takes the following form :
measure n) calculatio (measure
Err= −
These distributions concern two blind prediction competitions in relation with embankment: Haarajoki and Muar flats embankment. It is worth noting that the two benchmarks presents similar general distributions:
− if the tail of distribution in conservative area (negative values of error) is neglected, calculation results in a maximum over-estimation ratio of 4;
− the greatest occurrence of settlement error is located between 0 and 0.5. So, the calculation is slightly unconservative;
− this greatest occurrence in the case of lateral displacement is located in conservative area. However, this displacement can be overestimated or over estimated. This error on lateral displacement is four times greater than the one on settlement
The Haarajoki competition presents a larger global modelling error. This is mainly due to the fact that the calculation concerns two areas, one of which is composed of drains, making the modelling more complicated.
-12 -10 -8 -6 -4 -2 0 2 0 20 40 60 Haarajoki Muar Flat
Fig. 13. Distribution of modelling error. Settlement under the embankment
-40
-20
0
20
40
0
20
40
60
80
100
Haarajoki
Muar F at
Fig. 14. Distribution of modelling error. Lateral displacement under the embankment
As for class C prediction analysis, the long term displacements are better estimated, but the error order is not the same. So, if class C predictions are needed for the validation and calibration of models, class A prediction are essential for the evaluation of modelling error in project conditions.
CONCLUSIONS
The “Laboratoire Central des Ponts et Chaussées” and the “Ecole Centrale de Nantes” have been conducting a technology watch mission over the past several years with respect to comparing finite element model results with in situ measurements. The primary objective is: to preserve the record of these models and their comparisons with in situ measurements, to draw lessons in the practice of geotechnical modeling, to provide orders of magnitude for computation results, and to quantify the modelling error. The information extracted from the bibliographical analysis has been combined into a database called MOMIS.
The MOMIS database is just in the nascent stages of its development. Collation of the references has served to identify a few general conclusions, such as:
- the modelling error is less than 50% for the settlement predictions at the end of tunnel or embankment construction and for the horizontal displacement of a retaining structure at the end of construction;
- the modelling error remains high for the lateral displacements in tunneling and for the vertical settlement behind a retaining structure, with a significant number of relative errors surpassing 100%.
On the other hand, an electronic database is currently being developed at EC Nantes (with the ACCESS database management software) specially for the blind prediction competitions (class A predictions). The aim of this specific database is to link the in-situ measurements with the predicted values, or with the parameters of the modelling. By this way, some useful indications regarding the current practice in modelling, their bias, the problems that the authors and participants encountered in these benchmarks, are expected. Finally it is essential to continue conducting these computation-measurement comparisons along with additional full-scale experiments. We need to ascertain the degree of realism in the models and to define modelling methodologies specific to each type of geotechnical structure.
REFERENCES
Duncan, J.M. [1994]. “The role of advanced constitutive relations in practical applications”, Proc. 14th Intern. Conf. Soil Mechanics and Foundation Engineering, New Delhi, vol.
5, pp. 31-48.
Gens, A. [1995]. “General report: Prediction, performance and design”, Proc. Pre-failure Deformation of Geomaterials, (2) Shibuya et al. (eds.), Balkema, pp. 1233-1256.
Lambe, T. W. [1973]. “Prediction in soil engineering”, Géotechnique, vol. 23, No 2, pp. 149-202.
Mestat, P. [2001a] “An overview on 25 years of numerical modeling of test embankments and tunnels”, Computer
Methods and Advances in Geomechanics, Desai et al. (eds.),
Balkema, pp. 1521-1526.
Mestat, P. [2001b] “MOMIS : une base de données sur la modélisation numérique des remblais sur sols compressibles et sur la confrontation calculs - mesures in situ”, Bulletin des Laboratoires des Ponts et Chaussées, No 232, pp. 43-58. Mestat, P. and E. Bourgeois [2002a] “Database for finite element prediction and performance – Application to tunnels and retaining structures”, Proc. 2nd Int. Conf. on Soil Structure Interaction in Urban Civil Engineering, march 2002, ETH
Zurich, Vol. 2, pp. 403-410.
Mestat, P. [2002]. “Applications de la base de données MOMIS à la validation du calcul des ouvrages souterrains”, Bulletin des Laboratoires des Ponts et Chaussées, No 236, pp. 59-75.
Mestat P. and Y. Riou [2002]. “Database for class A and C predictions - Comparison between FEM results and measurements in excavation problems”, 5th Europ. Conf. on Numerical Methods in Geotechnical Engineering - NUMGE 2002, Paris, Presses de l’ENPC/LCPC, pp. 703-710.
Negro, A. and P.I.B. De Queiroz [2000]. “Prediction and performance: A review of numerical analyses for tunnels”,
Geotechnical Aspects of Underground Construction in Soft Ground, Kusakabe et al. (eds.), Balkema, pp. 409-418.
Riou, Y., P. Mestat, P. Kudella and P. von Wolffersdorff (2003). “A database for the performance of numerical modelling of retaining wall”, Int. Symp. on GeoTechnical
Measurements and Modelling, 23-26 sept. 2003, Karlsruhe,