Biophysical changes reduce energetic demand
in growth factor–deprived lymphocytes
The MIT Faculty has made this article openly available.
Please share
how this access benefits you. Your story matters.
Citation
Hecht, Vivian C. et al. “Biophysical Changes Reduce Energetic
Demand in Growth Factor–deprived Lymphocytes.” The Journal of
Cell Biology 212.4 (2016): 439–447.
As Published
http://dx.doi.org/10.1083/jcb.201506118
Publisher
Rockefeller University Press, The
Version
Final published version
Citable link
http://hdl.handle.net/1721.1/105377
Terms of Use
Creative Commons Attribution-NonCommercial-ShareAlike 3.0
The Rockefeller University Press $30.00
Introduction
Cytokines and growth factors precisely control the dynamics of lymphocyte behavior during an immune response. Upon ini-tial antigen exposure, prostimulatory cytokines, such as IL-2, mediate lymphocyte activation by promoting nutrient uptake and metabolism to support cell growth and proliferation (Duke and Cohen, 1986; Mizel, 1989; Rathmell et al., 2001). When an infection is cleared, levels of IL-2 and other growth factors decrease, leading to decreased nutrient uptake, cell cycle arrest, atrophy, and apoptosis of most activated lymphocytes. A small surviving fraction of these cells differentiates into memory cells, also through a cytokine-mediated process (Van Parijs and Abbas, 1998; Valentin and Yang, 2008).
The absence of proinflammatory cytokine signaling lim-its nutrient uptake in memory cells (Cornish et al., 2006; Rolf et al., 2013), though several mechanisms have been identified for maintaining viability under these conditions. First, memory cells undergo a significant metabolic shift; whereas activated
cells consume large amounts of glucose to support prolifera-tion, memory cells limit metabolic expenditures almost exclu-sively to maintenance functions. Correspondingly, memory lymphocytes rely on oxidative phosphorylation to extract the maximum amount of energy from available nutrients (Goldrath et al., 2002; Pearce, 2010). Autophagy, or self-digestion of in-tracellular components, also plays an essential role in memory lymphocyte survival in the absence of IL-2 by providing an al-ternative source of metabolic precursors (Lum et al., 2005b). Finally, the anti-apoptotic protein Bcl-2 is up-regulated in memory lymphocytes relative to effector lymphocytes, helping to promote memory cell differentiation and survival (Nuñez et al., 1991; Grayson et al., 2000; van der Windt et al., 2012). Bcl-2 also aids in the bioenergetic adaptation to decreased nu-trient uptake and remains elevated in memory cells for an ex-tended period after an infection has been cleared (Nuñez et al., 1991; Grayson et al., 2000).
Memory differentiation of effector lymphocytes also in-volves a decrease in cell size, a response previously attributed to autophagy (Rathmell et al., 2000; Berard et al., 2003; Xu et
Cytokine regulation of lymphocyte growth and proliferation is essential for matching nutrient consumption with cell state. Here, we examine how cellular biophysical changes that occur immediately after growth factor depletion promote ad-aptation to reduced nutrient uptake. After growth factor withdrawal, nutrient uptake decreases, leading to apoptosis. Bcl-xL expression prevents cell death, with autophagy facilitating long-term cell survival. However, autophagy induction
is slow relative to the reduction of nutrient uptake, suggesting that cells must engage additional adaptive mechanisms to respond initially to growth factor depletion. We describe an acute biophysical response to growth factor withdrawal, characterized by a simultaneous decrease in cell volume and increase in cell density, which occurs before autophagy initiation and is observed in both FL5.12 Bcl-xL cells depleted of IL-3 and primary CD8+ T cells depleted of IL-2 that are
differentiating toward memory cells. The response reduces cell surface area to minimize energy expenditure while con-serving biomass, suggesting that the biophysical properties of cells can be regulated to promote survival under condi-tions of nutrient stress.
Biophysical changes reduce energetic demand in
growth factor–deprived lymphocytes
Vivian C. Hecht,1,2* Lucas B. Sullivan,2,3* Robert J. Kimmerling,1,2 Dong-Hwee Kim,6,7,8 Aaron M. Hosios,2,3
Max A. Stockslager,5 Mark M. Stevens,2,3 Joon Ho Kang,2,4 Denis Wirtz,6,7,8 Matthew G. Vander Heiden,2,3,9
and Scott R. Manalis1,2,5
1Department of Biological Engineering, 2Koch Institute for Integrative Cancer Research, 3Department of Biology, 4Department of Physics, and 5Department of Mechanical
Engineering, Massachusetts Institute of Technology, Cambridge, MA 02139
6Johns Hopkins Physical Sciences in Oncology Center and 7Department of Chemical and Biomolecular Engineering, Johns Hopkins University, Baltimore, MD 21218 8Department of Pathology and Oncology and Sydney Kimmel Comprehensive Cancer Center, Johns Hopkins School of Medicine, Baltimore, MD 21205
9Dana-Farber Cancer Institute, Boston, MA 02115
© 2016 Hecht et al. This article is distributed under the terms of an Attribution–Noncommercial– Share Alike–No Mirror Sites license for the first six months after the publication date (see http ://www .rupress .org /terms). After six months it is available under a Creative Commons License (Attribution–Noncommercial–Share Alike 3.0 Unported license, as described at http ://creativecommons .org /licenses /by -nc -sa /3 .0 /).
*V.C. Hecht and L.B. Sullivan contributed equally to this paper.
Correspondence to Matthew G. Vander Heiden: [email protected]; or Scott R. Manalis: [email protected]
D.-H. Kim’s present address is KU-KIST Graduate School of Converging Science and Technology, Korea University, Seoul 02841, Republic of Korea.
Abbreviations used in this paper: htCP, high-throughput cell phenotyping; mTOR, mammalian target of rapamycin; PI, propidium iodide; SMR, suspended microchannel resonator.
THE
JOURNAL
OF
CELL
BIOLOGY
on February 25, 2016 jcb.rupress.org Downloaded from http://jcb.rupress.org/content/suppl/2016/02/11/jcb.201506118.DC1.html Supplemental Material can be found at:JCB • Volume 212 • NumBer 4 • 2016
440
al., 2014). Biophysical properties, such as cell mass, volume, and density, represent aggregate changes in cellular composi-tion, and measuring changes in these properties can reveal ad-aptations that may be obscured when investigating individual molecular events or pathways in isolation (Friedman and Roll, 1987; Grover et al., 2011; Park et al., 2012; Byun et al., 2013; Feijó Delgado et al., 2013). Here, we analyze cell size, described in terms of volume, as well as cell density, or mass per volume, of single lymphocytes to better understand the effects of growth factor withdrawal. Although cell volume and mass are measures of combined cell water and biochemical content, density rep-resents the contribution of each to overall cellular composition. Cell density is very tightly regulated and can therefore reveal changes to cell state beyond those suggested by changes in cell volume alone (Friedman and Roll, 1987; Grover et al., 2011; Park et al., 2012; Bryan et al., 2014; Byun et al., 2015).
To study the response of lymphocytes to growth factor withdrawal, we examined FL5.12 cells, mouse pro–B lympho-cytes that depend on IL-3 for nutrient uptake and growth. In the absence of IL-3, these cells lose the ability to take up nutrients and consequently undergo atrophy and apoptosis. However, when the prosurvival Bcl-2–related protein Bcl-xL is expressed, or proapoptotic proteins are lost, apoptosis is inhibited and cells rely on autophagy for long-term survival (Vander Heiden et al., 1999; Rathmell et al., 2000; Lum et al., 2005a). Here, we show that changes to cell volume and density occur as an acute re-sponse to growth factor depletion and that this rere-sponse aids adaptation to decreased nutrient uptake before autophagy induc-tion in both FL5.12 cells and primary monoclonal CD8+ cells.
Results
IL-3 depletion results in both volume and
density changes in FL5.12 Bcl-xL cells
To understand the biophysical effects of growth factor with-drawal, we studied FL5.12 cells, a pro–B lymphocytic cell line dependent on IL-3 for survival. As previously reported, wild-type FL5.12 cells (FL5.12 WT), but not FL5.12 cells expressing Bcl-xL (FL5.12 Bcl-xL), undergo apoptosis within 24 h of IL-3 depletion (Fig. S1 a; Sedlak et al., 1995; Vander Heiden et al., 1999). Thus, to investigate the biophysical effects of growth fac-tor deprivation independent of apoptosis, we used FL5.12 Bcl-xL
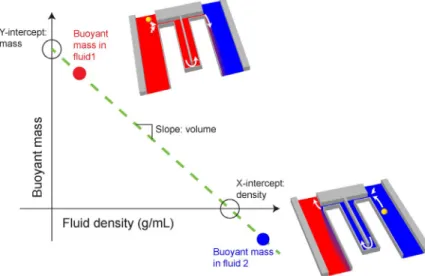
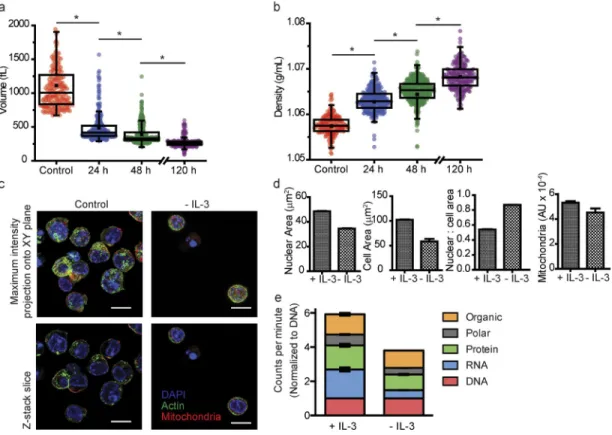
cells. We used a suspended microchannel resonator (SMR) to measure changes to the volume and density of FL5.12 Bcl-xL cells after depletion of IL-3 for up to 120 h. The SMR is a micro-fluidic cantilever-based mass sensor used to determine the mass of a single cell in a fluid—the buoyant mass—based on changes in resonance frequency (Burg et al., 2007). By measuring the buoyant mass of the same cell in two fluids of two different den-sities, we can calculate the total volume and density of that cell (Fig. 1 and Materials and methods; Grover et al., 2011). After IL-3 depletion, we found that cell volume decreases continuously for the entire measurement period, though most dramatically over the first 24 h (Fig. 2 a). Similar findings are observed when cell volume is assessed using a Coulter counter (Fig. S1 b) and are in agreement with previous studies (Rathmell et al., 2000; Edinger and Thompson, 2002). The density of growth factor–depleted cells increases continuously over the same time period (Fig. 2 b). These results are in contrast with measurements performed in apoptotic FL5.12 WT cells, which show only a slight decrease in volume and a decrease in density upon IL-3 depletion (Fig. S1, c and d). Cell density is the ratio of cell mass to volume, and also represents a weighted mean of the densities of all cellular com-ponents. Thus, an increase in cell density is likely characterized by an increase in the amount of high-density material, such as nucleic acids and proteins, relative to low-density material, such as water; nonetheless, the decrease in cell volume indicates the potential for loss of both aqueous and nonaqueous material.
We wished to confirm that the biophysical changes that we observed were not limited to Bcl-xL–expressing FL5.12 cells. We therefore depleted IL-3 from Bcl-2–expressing FL5.12 cells and found that volume decreased and density increased in a similar manner to Bcl-xL–expressing cells (Fig. S1, e and f). To determine the degree of loss of nonaqueous material, we used an SMR to measure the dry mass (Feijó Delgado et al., 2013; Lunt et al., 2015) of FL5.12 Bcl-xL cells depleted of IL-3 for up to 120 h. We observed a decrease in cell dry mass that occurs simultaneously with the changes to volume and density, sug-gesting that cells also lose macromolecular material (Fig. S1 g). These findings indicate that not all cellular material is lost in equal amounts and suggests that the initial response to growth factor withdrawal is a large decrease in cell size with selective conservation of high-density material.
To further analyze the intracellular content of the IL-3– depleted FL5.12 cells, we used high-throughput cell phenotying
Figure 1. Graphical description of how cell volume and density can be obtained from buoyant mass measurements. A cell is first flowed into the SMR, and its buoyant mass is measured in low-density fluid (red). The cell is then trapped in the high-density fluid (blue), and then the direction of fluid flow is switched. The cell is then flowed through the SMR in the opposite direction where buoyant mass is measured in the high-density fluid. Volume and density are then calculated as shown in the plot on the left.
on February 25, 2016
jcb.rupress.org
Downloaded from
(htCP), a single-cell resolution microscopy-based assay, to quantitatively determine morphometric parameters of immu-no-stained cells and fluorescence intensity of antibody-specific intracellular components (Chambliss et al., 2013). F-actin, mi-tochondria, and nuclei were stained and analyzed using htCP before and after IL-3 depletion (Fig. 2 c). As shown in Fig. 2 d, though both nuclear area and cellular area decrease 5 days after IL-3 depletion, the nuclear to cytoplasmic ratio increases, indi-cating a greater relative loss of cytoplasmic volume. Moreover, mitochondrial content only decreases slightly, further suggesting that material contained in the nucleus and mitochondria is pref-erentially retained. To orthogonally measure changes to cellular composition after growth factor withdrawal, we performed a cellular fractionation of radioactively labeled components. In this measurement, we cultured FL5.12 Bcl-xL or WT cells in 14C glucose until labeling reached steady state. Cells were then either maintained in, or depleted of, IL-3 for 24 h (in media with 14C glucose) and cells were fractionated to determine the relative amounts of 14C present in each fraction: organic (lipids and non-polar molecules), non-polar (metabolites and other small non-polar mol-ecules), protein, RNA, and DNA. Because all cells should have similar amounts of DNA, we normalized the amount of 14C in each fraction to the amount of 14C present in the DNA fraction. As shown in Fig. 2 e, IL-3 depletion of FL5.12 Bcl-xL cells leads to a large decrease in the amount of RNA and polar material and smaller decreases in the protein and organic content. These trends are enhanced in FL5.12 WT cells, which are dying at the time of the measurement (Fig. S1 a). These data indicate that some components of cellular biomass are conserved in FL5.12 Bcl-xL cells deprived of IL-3, whereas others are selectively lost.
To determine whether the increase in cell density was re-versible, we added IL-3 back to a population of cells depleted of IL-3 for 120 h and measured changes in cell density, vol-ume, and proliferation rate over a period of 96 h, which was the amount of time required for cells to return to previous rates of proliferation (Table S1). We found that cell volume begins to increase within 24 h after IL-3 repletion and returns to the value observed in proliferating cells within 72 h (Fig. S1 i). Interest-ingly, we found that density decreases to the value observed in proliferating cells within 24 h of IL-3 repletion, then decreases further, and again increases back to the value observed in pro-liferating cells within 96 h (Fig. S1 j).
Autophagy and IL-3 depletion lead to different biophysical changes
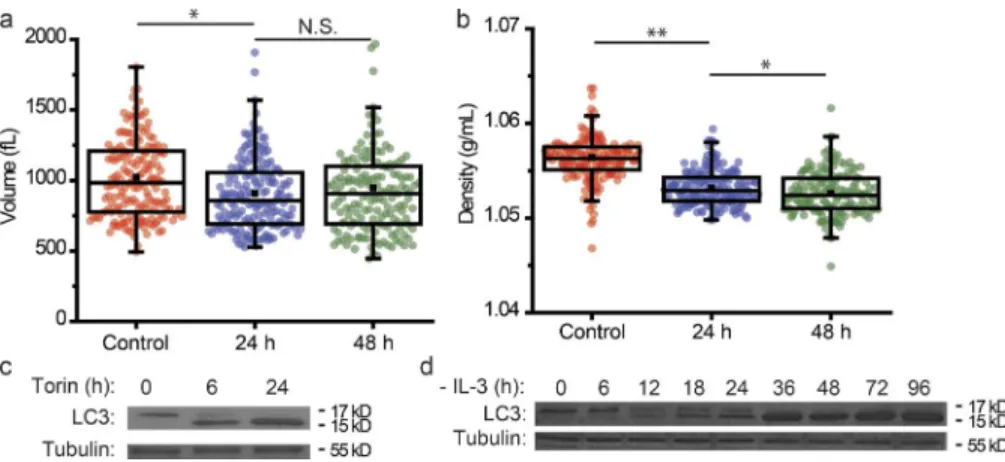
Induction of autophagy is a response that allows FL5.12 Bcl-xL cells to maintain ATP synthesis, and therefore viability, during prolonged depletion of IL-3 (Levine and Klionsky, 2004; Lum et al., 2005a; Valentin and Yang, 2008; Ayna et al., 2012). To determine whether activation of autophagy might drive the bio-physical changes we observed after IL-3 depletion, we used Torin 1, an ATP-competitive inhibitor of mammalian target of rapamycin (mTOR; Edinger and Thompson, 2002; Thoreen et al., 2009), to induce autophagy in FL5.12 Bcl-xL cells cultured in the presence of IL-3. mTOR signaling suppresses autoph-agy, and has been shown to be a downstream effector of IL-3 (Sekulić et al., 2000; Cruz et al., 2005; Wieman et al., 2007). As shown in Fig. 3 (a and b), cells treated with Torin 1 un-dergo a slight decrease in both volume and density (Thoreen et al., 2009). This phenotype contrasts with the larger decrease
Figure 2. Biophysical changes resulting from IL-3 depletion in FL5.12 Bcl-xL cells. SMR measurements demonstrate a decrease in volume (a) and increase
in density (b) over a 120-h interval. *, P < 2 × 10⁻²⁶. Representative images (c) and aggregate data (d) from high-throughput cell phenotyping (htCP)
performed on control cells and 120 h after IL-3 depletion. Bars, 10 µm. Fractionation of FL5.12 Bcl-xL cells labeled with 14C to show the relative loss of
different biomass components after IL-3 withdrawal (e).
on February 25, 2016
jcb.rupress.org
JCB • Volume 212 • NumBer 4 • 2016
442
in volume and increase in density observed after IL-3 deple-tion (Fig. 2, a and b). To determine whether Torin 1 treatment resulted in autophagy in FL5.12 Bcl-xL cells, we measured the conversion of LC3-I to LC3-II, a marker of autophagy (Kabeya et al., 2000). Torin 1 led to near maximal production of LC3-II within 6 h, confirming the induction of autophagy (Fig. 3 c). This suggests that autophagy alone is not sufficient to drive the acute biophysical changes that we observe after IL-3 depletion.
The earliest time that has been previously reported for increased autophagy after IL-3 withdrawal in FL5.12 Bcl-xL cells is ∼48 h (Lum et al., 2005a). However, density and vol-ume begin to shift within at most 12 h of IL-3 depletion (Fig. 2 and Fig. S2, a and b). To determine if autophagy contributes to the biophysical changes that we observe after IL-3 depletion, we measured the conversion of LC3-I to LC3-II over time in IL-3–depleted FL5.12 Bcl-xL cells. LC3-II expression begins to increase ∼18 h after IL-3 withdrawal, with maximum levels not reached until 36 h of growth factor deprivation (Fig. 3 d), much later than the appearance of the biophysical response. Further-more, we used shRNA to decrease expression of autophagy re-lated 7 (ATG7), a protein necessary for autophagy induction (Fig. S2 c). Consistent with previous studies, ATG7 expression is required to maintain viability over longer time periods of IL-3 deprivation, but not at 24 h (Fig. S2 d; Lum et al., 2005a). Also, knockdown of ATG7 did not impact the biophysical response of FL5.12 Bcl-xL cells to IL-3 withdrawal at 24 h (Fig. S2, e and f). Thus, these data support our hypothesis that the biophysical changes resulting from IL-3 withdrawal occur before, and inde-pendently of, the initiation of autophagy.
Biophysical changes support adaptation to decreased nutrient uptake
We hypothesized that the acute biophysical changes after growth factor withdrawal could represent a metabolic adap-tation to decreased nutrient uptake. In the absence of IL-3, FL5.12 Bcl-xL cells stop proliferating (Vander Heiden et al., 2001; Table S1) and greatly reduce nutrient uptake (Vander Heiden et al., 2001; Wellen et al., 2010); however, homeostatic processes such as preserving cell membrane integrity and ion gradients continue to require ATP. Importantly, these processes consume relatively more ATP than do cell biosynthesis and growth (Lunt and Vander Heiden, 2011), and meeting these fixed demands for ATP is critical for cell survival. Thus, we considered the possibility that the decrease in cell size and increase in density might partially compensate for decreased ATP production by decreasing the amount of ATP required to perform maintenance processes.
To confirm that the capacity for ATP production is re-duced after IL-3 depletion, we measured nutrient and oxygen consumption in FL5.12 Bcl-xL cells in the presence and absence of IL-3. In agreement with previous studies, both glucose and glutamine consumption are significantly suppressed in IL-3– depleted cells (Fig. 4, a and b; Edinger and Thompson, 2002; Rathmell, 2004). One source of ATP is fermentation of glucose to lactate. Consistent with decreased glucose consumption, lactate production is also abolished in IL-3–depleted cells (Fig. 4 c). The other major source of ATP production in cells is mitochondrial oxidative phosphorylation, which is fueled by oxidation of TCA cycle intermediates and fatty acids. As shown in Fig. 4 d, oxygen consumption is decreased, but not eliminated, in IL-3 withdrawn FL5.12 Bcl-xL cells, indicating that oxidative phosphorylation is the sole source of ATP production. This oxygen consumption is primarily supported by glutamine oxidation with a contribu-tion from fatty acid oxidacontribu-tion (Fig. S3, a and b). Regardless, the decreased mitochondrial respiration and the loss of glycol-ysis indicate that ATP synthesis capacity is decreased in IL-3– withdrawn FL5.12 Bcl-xL cells. Interestingly, we observe that neither the ATP to ADP ratio nor the ATP to AMP ratio is signifi-cantly affected at this time point in FL5.12 Bcl-xL cells after IL-3 depletion, suggesting a concomitant reduction in ATP consump-tion (Fig. S3, c and d). Thus, these cells must rely on addiconsump-tional adaptations to support survival despite decreased ATP production.
We considered how decreased ATP consumption could be linked to decreased cell size. Past studies have shown a similar percent increase in oxygen consumption in FL5.12 Bcl-xL cells treated with gramicidin D in both IL-3–depleted and control cases (Vander Heiden et al., 1999). Gramicidin D uncouples the plasma membrane Na+/K+ potential, resulting in a compensatory increase in cytosolic Na+/K+-ATPase activity to maintain the cell membrane potential, and thereby increases ATP consumption. The increase in ATP consumption requires an increase in ATP production, and gramicidin D has been classically used to drive increased mitochondrial ATP produc-tion in cells. The observaproduc-tion that IL-3–replete and depleted cells have a similar fractional increase in ATP production after gramicidin D treatment, and that IL-3–depleted cells have lower ATP production relative to IL-3–replete cells, suggests that IL-3–depleted cells require less ATP production to main-tain the plasma membrane potential. Because the energetic cost of maintaining the plasma membrane potential is proportional to the cell surface area, this argues that a reduction in cell size contributes to energy savings. To test this idea, we determined if decreased ATP consumption in smaller, denser cells could be beneficial for cells in low nutrient conditions. Incubation of
Figure 3. The biophysical response of FL5.12 Bcl-xL cells to autophagy induction. Volume (a)
and density (b) measurements of Torin-treated FL5.12 cells show a slight decrease in volume and a larger decrease in density. Time refers to time elapsed since Torin treatment. *, P < 9 × 10⁻³; **, P < 5 × 10⁻³²; N.S., no
signif-icance. Western blots of LC3 in FL5.12 cells treated with Torin (c) or withdrawn from IL-3 (d) over time. Note the conversion of the slow-er-migrating LC3-I to the more rapidly migrat-ing, lipidated LC3 species, LC3-II, indicating induction of autophagy (c and d).
on February 25, 2016
jcb.rupress.org
Downloaded from
IL-3–treated FL5.12 Bcl-xL cells with media lacking glucose causes a robust loss of viability after 48 h (Fig. 4 e). How-ever, withdrawal of IL-3 for 24 h before, and during, a 48-h incubation in glucose-free media shows a relative protection from glucose withdrawal (Fig. 4 e). Withdrawal of IL-3 did not protect against glutamine deprivation, consistent with the role of glutamine oxidation maintaining ATP in IL-3–depleted FL5.12 Bcl-xL cells (Fig. S3 e). These data demonstrate that withdrawal of IL-3, and the decreased ATP requirements to maintain viability at a smaller size, can promote improved sur-vival in nutrient-depleted conditions.
IL-2 depletion in primary T cells leads to changes in density and volume
Previous studies have demonstrated a significant degree of over-lap between the molecular events occurring after IL-3 depletion in FL5.12 Bcl-xL cells and in the differentiation of activated lymphocytes to memory cells; in particular, both circumstances involve decreases in nutrient uptake, shifts in metabolism from glycolysis to oxidative phosphorylation, and upregulation of autophagy and dependence on antiapoptotic protein expression (Goldrath et al., 2002; Pearce, 2010). To determine whether similar biophysical changes accompany growth factor with-drawal in primary lymphocytes, we investigated monoclonal CD8+ T cells taken from OT-1 transgenic mice and activated with a SIINFEKL peptide in the presence of IL-2. Within 48 h after activation, naive CD8+ cells are all proliferating (Hogquist et al., 1994) and undergo a significant increase in volume and decrease in density (Fig. S4, a and b). This response is similar to that observed when IL-3–depleted cells are restimulated with IL-3 (Fig. S1, i and j). After the clearance of an infection, levels of IL-2 fall and cellular nutrient uptake is reduced (Balkwill and Burke, 1989; Berard et al., 2003). Thus, we next measured the volume and density of a population of activated CD8+ cells after IL-2 withdrawal by removing exogenous IL-2 and adding an anti–IL-2 antibody to prevent stimulation from IL-2 produced by the activated cells (Balkwill and Burke, 1989). Depletion of IL-2 leads to a decrease in cell volume and increase in cell den-sity that closely resembles what we observe after IL-3 depletion in FL5.12 Bcl-xL cells (Fig. 5, a and b). A population of CD8+ cells cultured continuously in the presence of IL-2 for 48 h after
activation for a similar time interval showed a slight decrease in volume but no noticeable change in density (Figs. S4, a and b).
To more closely model the process of differentiation toward memory cells, we resuspended activated CD8+ cells in media de-pleted of IL-2 and supplemented with IL-15, a homeostatic cyto-kine that promotes memory differentiation (Berard et al., 2003). Similarly to the case with FL5.12 Bcl-xL cells, autophagy has also been identified as critical for memory cell differentiation; however, previous studies have shown that autophagy is initiated at a late time point (Puleston et al., 2014). CD8+ cells depleted of IL-2 and supplemented with IL-15 demonstrate a similar de-crease in volume and inde-crease in density to those depleted of IL-2 exclusively (Fig. 5, c and d). Interestingly, the ultimate volume and density of cells exposed to IL-15 is quite similar to that of naive cells before activation (Fig. S4). This similarity possibly reflects shared metabolic and physiological roles of both cell types and further suggests a connection between biophysical properties and cellular metabolism and physiological role.
Discussion
We have demonstrated that growth factor depletion in lympho-cytes results in a conserved biophysical response that helps pro-mote cell survival in nutrient-poor conditions. We have found that FL5.12 Bcl-xL cells decrease in volume and increase in density after IL-3 depletion and that this change is also observed in primary activated CD8+ cells during memory differentiation. We demonstrate that this change occurs before the initiation of autophagy and propose that these biophysical changes comprise an acute adaptation to a nutrient-deprived state.
Although the molecular implications of growth factor presence or absence have been widely studied, the influence of growth factors on the biophysical state of cells has not. We pro-pose that these changes result from a broader process of maxi-mizing metabolic efficiency and optimaxi-mizing resource allocation in lymphocytes. The tremendous breadth of the immune reper-toire of a typical organism requires that most lymphocytes remain quiescent for a majority of their lifetimes, though in a state that is primed for rapid activation. Here, we propose that a high-density, low-volume state assists in the metabolic adaptation to decreased
Figure 4. Changes in FL5.12 Bcl-xL cell metabolism after
IL-3 depletion. IL-3 depletion causes decreases in glucose consumption rate (a), glutamine consumption rate (b), lactate production rate (c), and mitochondrial oxygen consumption rate (d). Glucose depletion leads to a decrease in viability in FL5.12 Bcl-xL cells exposed to IL-3, though not to cells
de-pleted of IL-3 (e). *, P < 7.2 × 10⁻³; **, P < 2 × 10⁻⁴; ***,
P < 10−4; N.S., no significance.
on February 25, 2016
jcb.rupress.org
JCB • Volume 212 • NumBer 4 • 2016
444
nutrient uptake. Whereas a lower volume reduces the energy re-quired for cellular maintenance processes, a higher density in this low-volume state allows retention of specific cellular material, such as proteins that are energetically expensive to synthesize and could be accessed by autophagy as metabolic substrates. Retain-ing these materials also decreases the resources required to re-grow to a size needed for proliferation if the cells are reactivated. Interestingly, we find that the changes in cell density and volume occur before autophagy initiation, a process known to be critical for survival of growth factor–depleted lymphocytes over long periods (Lum et al., 2005a; Pearce, 2010; Xu et al., 2014). Autophagy plays several roles in memory lymphocytes, includ-ing clearinclud-ing damaged organelles and macromolecules as well as providing energy under conditions of limited nutrient uptake caused by the absence of stimulatory growth factor. In certain cases, it has been described as the primary source of metabolic precursors after growth factor depletion; however, its initiation has been identified as occurring at relatively late time points, in agreement with our findings (Lum et al., 2005a; Pearce, 2010; Puleston et al., 2014). Because ATP turnover in cells occurs on a much faster timescale, adaptations to decreased nutrient uptake are required to maintain ATP levels during the time interval req-uisite for autophagy initiation. Moreover, we find the biophys-ical outcomes of pharmacologic induction of autophagy to be different from those of growth factor depletion, causing a slight decrease in cell size and decrease in density with kinetics that are slower than the acute decrease in size observed immediately after growth factor withdrawal. Thus, we propose that before activation of autophagy to support cellular bioenergetics, the cell acutely reduces ATP requirements by decreasing in volume and increasing in density.
Biophysical parameters, such as density and volume, rep-resent the aggregate outcome of multiple complex molecular events trigged by loss of growth factor signaling. Similarly, changes to density or volume likely affect many downstream pathways. For example, molecular crowding resulting from an increase in density has been identified as disruptive to protein folding equilibria and responsible for longer diffusion times (Ellis, 2001; Al-Habori, 2001). These issues could potentially occur in the nonproliferating, high-density cells that we study
here; proliferating cells may be better served with a lower den-sity, which is presumably associated with a larger cytoplasm and more space available for protein synthesis, signaling, and other essential cellular processes. This might explain why both naive cells and IL-3–depleted cells increase volume and de-crease density before dividing when stimulated with IL-2 or IL-3, respectively. Our results also argue that the acute change in volume after growth factor withdrawal is not only caused by exit from the cell cycle, as the cell volume decreases to less than half of the mean volume of the cycling population. Whether this biophysical response allows adaptation of cells to energy stress in other contexts remains to be determined; these data nonethe-less establish a link between cell biophysical properties and cell survival in a nutrient-deprived state.
Materials and methods
Cell culture
FL5.12 cells were grown at 37°C in RPMI 1640 media (Life Technol-ogies) supplemented with 10% (vol/vol) FBS (Sigma-Aldrich), 10 ml of antibiotic antimycotic (Life Technologies), and 0.01 mg/ml IL-3 (R&D Scientific). For IL-3 depletion, a confluent (106/ml) culture was
washed three times in RPMI without IL-3 and resuspended in RPMI without IL-3 at a concentration of 4 × 10⁵/ml. Approximately 0.25 ml
of culture was removed every day for measurement in the SMR. For glucose depletion, a confluent (106/ml) culture was washed three times
in RPMI lacking glucose and supplemented with 10% vol/vol dialyzed FBS (Sigma-Aldrich) and resuspended at a concentration of 4 × 10⁵/ml
in RPMI supplemented with 10% vol/vol dFBS with or without glucose and/or 0.01 mg/ml IL-3. For Torin treatment, a culture at a concen-tration of 4 × 10⁵/ml was supplemented with 250 nM Torin 1 (gift of
D. Sabatini, Whitehead Institute, Cambridge, MA). OT-I splenocytes were activated in vitro with 1 µg/ml OVA257-264 peptide (SIINFEKL;
Sigma-Aldrich) in RPMI 1640 with 10% (vol/vol) FBS and 55 µM 2-mercaptoethanol (Life Technologies). For the IL-2 experiments, blasting, viable, CD8+ T cells were FACS sorted after 24 h of activation
and seeded at a concentration of 2 × 10⁵ cells/ml in media with either
100 U/ml IL-2 (PeproTech) or 1 µg/ml anti-IL2 (JES6-1A12 clone; eBioscience) for the +IL-2 and −IL-2 conditions, respectively. For the
Figure 5. Biophysical response of CD8+ OT-1 cells to growth
factor depletion. IL-2 depletion leads to a decrease in volume and increase in density in activated CD8+ cells (a and b).
Exposure to IL-15 also leads to a decrease in volume and increase in density in activated CD8+ cells (c and d). *, P <
0.01; **, P < 8 × 10⁻⁴; ***, P < 5 × 10⁻¹⁸.
on February 25, 2016
jcb.rupress.org
Downloaded from
IL-15 experiments, cells were FACS sorted after 48 h of activation and seeded at a concentration of 2 × 10⁵ cells/ml in media with either 100
U/ml IL-2 or 10 ng/ml IL-15 (PeproTech). In both cases, t0 refers to the
time at which the cells were exposed to varying cytokine conditions. SMR operation
Cell volume and density were measured using the SMR as previously described (Grover et al., 2011). The SMR is a cantilever-based mass sensor with an embedded microfluidic channel (Burg et al., 2007). The cantilever mass determines its resonance frequency; as a cell flows through the channel embedded in the cantilever, the cantilever mass changes, leading to a change in resonance frequency. This change in cantilever mass corresponds to the buoyant mass of a cell, or the mass in a fluid: mB = Vcell(ρcell− ρfluid), where mB refers to cell buoyant mass,
Vcell refers to cell volume, ρcell refers to cell density, and ρfluid refers
to fluid density. Thus, cell density and volume can be determined by measuring the buoyant mass of a single cell twice, in two fluids of two different densities (Fig. 1 a). In this study, we use cell media as a low-density fluid (fluid 1), and an osmotically balanced solution of 30% Optiprep (Sigma-Aldrich) and 70% cell media as the high-density fluid (fluid 2). The SMR is filled with fluid 1 in the left-hand bypass and fluid 2 in the right-hand bypass. A cell sample of ∼250,000/ml is loaded into the left-hand bypass channel of the SMR (Fig. 1 a). The pressure is adjusted such that a single cell is directed to pass from the left-hand bypass, through the cantilever, and toward the right-hand by-pass channel, where it is immersed in fluid 2. As the cell by-passes through the cantilever this first time, its buoyant mass in fluid 1 is measured. The pressure is again adjusted to flow the cell from the right-hand bypass channel toward the cantilever entrance. The cell then passes through the SMR a second time, during which its buoyant mass in fluid 2 is measured. Once the cell reenters the left-hand bypass channel, it is flushed toward a waste vial, and a new cell is subsequently loaded into the cantilever. Cell samples are typically measured for a period of 60 min. As a validation of measurement accuracy, the volume of a sample of cells measured on the SMR is compared with the population measured on a commercial Coulter counter (Fig. S1 b). Additionally, each dataset is evaluated to ensure that no drifts in density or volume occur over the time course of a measurement. Experiments are con-trolled via a custom LabVIEW program, and data are processed using a custom MATLAB script.
Cellular dry mass is determined in a similar fashion, as previ-ously described (Feijó Delgado et al., 2013; Lunt et al., 2015). In brief, cells are measured with the technique described in the previous para-graph, though with PBS and D2O-PBS (PBS in 90% D2O) as the low-
and high-density fluids, respectively. The cell membrane is permeable to D2O, and so when a cell is measured in D2O, its aqueous content is
replaced with D2O. This produces a buoyant mass measurement
repre-sentative of the buoyant mass of the nonaqueous material exclusively. Similarly, when the cell is measured in PBS, we can approximate that the composition of the intracellular aqueous content to be similar to PBS; thus, a buoyant mass measurement in PBS would also represent the buoyant mass of the dry material. Thus, the cell buoyant masses in PBS and PBS-D2O can be used to determine a mass, volume, and
density of cellular nonaqueous material, or its biomolecular content. Confocal microscopy and high-throughput cell phenotyping
Cells were fixed with 4% paraformaldehyde (Sigma-Aldrich) for 10 min at room temperature and permeabilized with 0.1% Triton X-100 (Life Technologies) for 10 min. To block nonspecific binding, cells were incubated with PBS (Life Technologies) supplemented with 10% FBS (ATCC) for 30 min. For immunostaining, cells were incubated with anti-mitochondria antibody (Abcam) for 1 h. Nuclear DNA and
actin filaments were marked with Hoechst 33342 (Sigma-Aldrich) and Alexa Fluor phalloidin 488 (Life Technologies), respectively. Imag-ing of immunostained cells was performed with an A1 confocal laser microscope (Nikon) equipped with a 60× oil-immersion objective (Nikon). Immunofluorescence confocal images collected every 1 µm in the z-direction were projected onto the xy plane (Kim and Wirtz, 2015; Fig. 2 c, top). For high-throughput cell phenotyping, fluorescence im-ages of immunostained cells were collected with a fluorescence mi-croscope (TE300; Nikon) equipped with a DS-QiMc camera (Nikon). Nuclear area, cell area, and mitochondria intensity were assessed with a customized MATLAB code (Chambliss et al., 2013). More than 5,000 cells were assessed per condition (Fig. 2 d).
Quantification of biomass components
FL5.12 Bcl-xL or WT cells were cultured in RPMI containing tracer
amounts of 14C glucose for 3 d, when steady-state labeling into each
fraction had been reached. Cells were then washed and transferred to fresh 14C glucose media with or without IL-3 for 24 h. Cells were lysed
using TRIzol reagent (Life Technologies), and protein, RNA, and DNA fractions were extracted and purified according to the manufacturer’s instructions. Soluble material after RNA precipitation in the aqueous phase was designated the polar fraction, whereas material in the or-ganic phase after protein precipitation was designated the oror-ganic fraction. Radioactivity in each fraction was then quantified by liquid scintillation counting. To account for differences in material input, ra-tios of each fraction were determined normalized to the DNA fraction. Immunoblotting
Protein was extracted from 3 × 10⁶ FL5.12 Bcl-x
L cells in RIPA buffer
containing protease inhibitors (Roche) and measured by Western blot using standard methods. The primary antibodies used were anti-LC3 antibody (PM036; MBL International), anti-ATG7 antibody (2631S; Cell Signaling), and anti–α-tubulin (ab176560; Abcam).
shRNA expression
Validated pLKO.1 shRNA constructs targeting mouse ATG7 were ob-tained from Sigma-Aldrich. Control pLKO.1 shRNA targeting GFP was a gift from D. Sabatini (plasmid 30323; Addgene; Sancak et al., 2008). Virus was produced in 293T cells and used to infect FL5.12 Bcl-xL cells, which were selected in 2 µg/ml puromycin.
Viability
Cell viability was determined by propidium iodide (PI) exclusion using standard methods. For IL-3 withdrawal viability assays, FL5.12 WT or FL5.12 Bcl-xL cells were washed and resuspended in media
with-out IL-3 for the indicated amount of time. For glucose and glutamine deprivation experiments, FL5.12 Bcl-xL cells were suspended in media
with or without IL-3 for 24 h before and subsequently during a 48-h incubation in media absent glucose or glutamine and compared with replete media. In all viability experiments, cells were then resupended in 1 µg/ml PI, and PI incorporation was measured by flow cytometry (FACS Canto II; BD) and quantified (FACS Diva Software).
Mitochondrial oxygen consumption
Oxygen consumption rate was measured from 107 IL-3–treated or
with-drawn FL5.12 Bcl-xL cells/ml using an Oxytherm instrument
(Hansat-ech). The slope of the linear range of oxygen depletion was used to measure basal oxygen consumption rate. Nonmitochondrial oxygen consumption rate was measured after treatment with 2 µM antimycin and 2 µM rotenone. The difference between basal and nonmitochon-drial oxygen consumption was calculated to determine mitochonnonmitochon-drial oxygen consumption rate. To determine the contribution of glutamine
on February 25, 2016
jcb.rupress.org
JCB • Volume 212 • NumBer 4 • 2016
446
to oxygen consumption, IL-3–withdrawn FL5.12 Bcl-xL cells were
de-prived of glutamine for 2 h and oxygen consumption rate was deter-mined during glutamine withdrawal and after reconstitution with 2 mM glutamine. Fatty acid oxidation contribution to oxygen consumption was determined by comparing oxygen consumption rate before and after addition of 300 µM etomoxir (Sigma-Aldrich).
Metabolic measurements
Metabolic excretion and consumption measurements of glucose, gluta-mine, and lactate from the media of FL5.12 Bcl-xL cells were determined
with an YSI 7100MBS (YSI Life Sciences) according to manufacturer’s protocols. FL5.12 cells treated with IL-3 or withdrawn from IL-3 for 24 h were resuspended at 3 × 10⁶/ml in fresh RPMI for 3 h and metabolite levels
in the media were quantified. The measurements were then normalized to cell number and subtracted from metabolite levels measured in media with-out cells to determine consumption and production rates in each condition. Measurement of adenine nucleotides
FL5.12 Bcl-xL cells were washed three times in RPMI and resuspended in
media with or without IL-3 for 24 h. Cells were then washed in blood bank saline and extracted with 250 µl ice-cold 60% methanol. 250 µl chloroform was then added followed by vortexing at 4°C for 10 min and centrifugation at 4°C for 10 min at 16,000 g. 40 µl of the upper, aqueous methanol-water phase was then transferred to a liquid chromatography–mass spectrom-etry tube for analysis. Liquid chromatography–mass spectromspectrom-etry mea-surement of ATP, ADP, and AMP was done as detailed in (Sullivan et al., 2015). To control for changes in total material input upon IL-3 deprivation, quantifications were determined as a ratio of ATP/ADP or ATP/AMP in each condition. To control for potential ionization efficiency differences between adenine nucleotide species, the relative ratios were compared after being normalized to the ratios of the +IL-3 condition.
Statistical analysis
Box plots in Figs. 2, 3, 5, S1, S2, and S4 represent the interquartile range of the experimental data, and whiskers represent the 5th and 95th percentile of the data. Statistical significance was determined using a Wilcoxon rank-sum analysis. Error bars in Figs. 2 and 4 represent standard deviation. Statistical significance in Figs. 4 and S3 was de-termined using an unpaired, parametric t test with Welch’s correction. Online supplemental material
Fig. S1 provides additional detail regarding changes to density and volume in FL5.12 Bcl-xL cells, as well as demonstrations of biophysical
changes in wild-type FL5.12 cells and FL5.12 Bcl-2 cells. Fig. S2 shows additional experiments investigating the dependence of the observed biophysical phenotype to autophagy. Fig. S3 shows further characterization of changes to the metabolic phenotype of FL5.12 cells after IL-3 depletion. Fig. S4 shows changes to volume and density of OT-1 CD8+ cells continually exposed to IL-2. Table S1 shows the
doubling time of a culture of FL5.12 cells depleted of IL-3 for 120 h and then reexposed to IL-3 for 96 h. Online supplemental material is available at http ://www .jcb .org /cgi /content /full /jcb .201506118 /DC1.
Acknowledgments
This work was supported by a Koch Institute Support (core) grant from the National Cancer Institute (P30-CA14051), Physical Sciences On-cology Center (U54CA143874), Burrough’s Wellcome Foundation, the Ludwig Center at the Massachusetts Institute of Technology, and the Damon Runyon Cancer Research Foundation. Lucas B. Sullivan was supported by a postdoctoral fellowship from the American Can-cer Society (PF-15-096-01-TBE).
The authors declare no competing financial interests. Submitted: 24 June 2015
Accepted: 15 January 2016
References
Al-Habori, M. 2001. Macromolecular crowding and its role as intracellular signalling of cell volume regulation. Int. J. Biochem. Cell Biol. 33:844– 864. http ://dx .doi .org /10 .1016 /S1357 -2725(01)00058 -9
Ayna, G., D.V. Krysko, A. Kaczmarek, G. Petrovski, P. Vandenabeele, and L. Fésüs. 2012. ATP release from dying autophagic cells and their phagocytosis are crucial for inflammasome activation in macrophages.
PLoS One. 7:e40069. http ://dx .doi .org /10 .1371 /journal .pone .0040069 Balkwill, F.R., and F. Burke. 1989. The cytokine network. Immunol. Today.
10:299–304. http ://dx .doi .org /10 .1016 /0167 -5699(89)90085 -6
Berard, M., K. Brandt, S. Bulfone-Paus, and D.F. Tough. 2003. IL-15 promotes the survival of naive and memory phenotype CD8+ T cells. J. Immunol. 170:5018–5026. http ://dx .doi .org /10 .4049 /jimmunol .170 .10 .5018 Bryan, A.K., V.C. Hecht, W. Shen, K. Payer, W.H. Grover, and S.R. Manalis.
2014. Measuring single cell mass, volume, and density with dual suspended microchannel resonators. Lab Chip. 14:569–576. http ://dx .doi .org /10 .1039 /C3LC51022K
Burg, T.P., M. Godin, S.M. Knudsen, W. Shen, G. Carlson, J.S. Foster, K. Babcock, and S.R. Manalis. 2007. Weighing of biomolecules, single cells and single nanoparticles in fluid. Nature. 446:1066–1069. http ://dx .doi .org /10 .1038 /nature05741
Byun, S., S. Son, D. Amodei, N. Cermak, J. Shaw, J.H. Kang, V.C. Hecht, M.M. Winslow, T. Jacks, P. Mallick, and S.R. Manalis. 2013. Characterizing deformability and surface friction of cancer cells. Proc.
Natl. Acad. Sci. USA. 110:7580–7585. http ://dx .doi .org /10 .1073 /pnas .1218806110
Byun, S., V.C. Hecht, and S.R. Manalis. 2015. Characterizing Cellular Biophysical Responses to Stress by Relating Density, Deformability, and Size. Biophys.
J. 109:1565–1573. http ://dx .doi .org /10 .1016 /j .bpj .2015 .08 .038
Chambliss, A.B., P.H. Wu, W.C. Chen, S.X. Sun, and D. Wirtz. 2013. Simultaneously defining cell phenotypes, cell cycle, and chromatin modifications at single-cell resolution. FASEB J. 27:2667–2676. http ://dx .doi .org /10 .1096 /fj .12 -227108
Cornish, G.H., L.V. Sinclair, D.A. Cantrell, and I. Fields. 2006. Differential regulation of T-cell growth by IL-2 and IL-15. Blood. 108:600–608. http ://dx .doi .org /10 .1182 /blood -2005 -12 -4827
Cruz, R., L. Hedden, D. Boyer, M.G. Kharas, D.A. Fruman, and K.K. Lee-Fruman. 2005. S6 kinase 2 potentiates interleukin-3-driven cell proliferation.
J. Leukoc. Biol. 78:1378–1385. http ://dx .doi .org /10 .1189 /jlb .0405225 Duke, R.C., and J.J. Cohen. 1986. IL-2 addiction: withdrawal of growth
fac-tor activates a suicide program in dependent T cells. Lymphokine Res. 5:289–299.
Edinger, A.L., and C.B. Thompson. 2002. Akt maintains cell size and survival by increasing mTOR-dependent nutrient uptake. Mol. Biol. Cell. 13:2276– 2288. http ://dx .doi .org /10 .1091 /mbc .01 -12 -0584
Ellis, R.J. 2001. Macromolecular crowding: obvious but underappreciated.
Trends Biochem. Sci. 26:597–604. http ://dx .doi .org /10 .1016 /S0968 -0004(01)01938 -7
Feijó Delgado, F., N. Cermak, V.C. Hecht, S. Son, Y. Li, S.M. Knudsen, S. Olcum, J.M. Higgins, J. Chen, W.H. Grover, and S.R. Manalis. 2013. Intracellular water exchange for measuring the dry mass, water mass and changes in chemical composition of living cells. PLoS One. 8:e67590. (published erratum appears in PLoS One. 2013. 8.) http ://dx .doi .org /10 .1371 /journal .pone .0067590
Friedman, S.L., and F.J. Roll. 1987. Isolation and culture of hepatic lipocytes, Kupffer cells, and sinusoidal endothelial cells by density gradient centrifugation with Stractan. Anal. Biochem. 161:207–218. http ://dx .doi .org /10 .1016 /0003 -2697(87)90673 -7
Goldrath, A.W., P.V. Sivakumar, M. Glaccum, M.K. Kennedy, M.J. Bevan, C. Benoist, D. Mathis, and E.A. Butz. 2002. Cytokine requirements for acute and Basal homeostatic proliferation of naive and memory CD8+ T cells.
J. Exp. Med. 195:1515–1522. http ://dx .doi .org /10 .1084 /jem .20020033 Grayson, J.M., A.J. Zajac, J.D. Altman, and R. Ahmed. 2000. Cutting edge:
increased expression of Bcl-2 in antigen-specific memory CD8+ T cells.
J. Immunol. 164:3950–3954. http ://dx .doi .org /10 .4049 /jimmunol .164 .8 .3950 Grover, W.H., A.K. Bryan, M. Diez-Silva, S. Suresh, J.M. Higgins, and
S.R. Manalis. 2011. Measuring single-cell density. Proc. Natl. Acad. Sci.
USA. 108:10992–10996. http ://dx .doi .org /10 .1073 /pnas .1104651108
on February 25, 2016
jcb.rupress.org
Downloaded from
Hogquist, K.A., S.C. Jameson, W.R. Heath, J.L. Howard, M.J. Bevan, and F.R. Carbone. 1994. T cell receptor antagonist peptides induce positive selection. Cell. 76:17–27. http ://dx .doi .org /10 .1016 /0092 -8674(94)90169 -4 Kabeya, Y., N. Mizushima, T. Ueno, A. Yamamoto, T. Kirisako, T. Noda,
E. Kominami, Y. Ohsumi, and T. Yoshimori. 2000. LC3, a mammalian homologue of yeast Apg8p, is localized in autophagosome membranes after processing. EMBO J. 19:5720–5728. http ://dx .doi .org /10 .1093 / emboj /19 .21 .5720
Kim, D.-H., and D. Wirtz. 2015. Cytoskeletal tension induces the polarized architecture of the nucleus. Biomaterials. 48:161–172. http ://dx .doi .org /10 .1016 /j .biomaterials .2015 .01 .023
Levine, B., and D.J. Klionsky. 2004. Development by self-digestion: molecular mechanisms and biological functions of autophagy. Dev. Cell. 6:463–477. http ://dx .doi .org /10 .1016 /S1534 -5807(04)00099 -1
Lum, J.J., D.E. Bauer, M. Kong, M.H. Harris, C. Li, T. Lindsten, and C.B. Thompson. 2005a. Growth factor regulation of autophagy and cell survival in the absence of apoptosis. Cell. 120:237–248. http ://dx .doi .org /10 .1016 /j .cell .2004 .11 .046
Lum, J.J., R.J. DeBerardinis, and C.B. Thompson. 2005b. Autophagy in metazoans: cell survival in the land of plenty. Nat. Rev. Mol. Cell Biol. 6:439–448. http ://dx .doi .org /10 .1038 /nrm1660
Lunt, S.Y., and M.G. Vander Heiden. 2011. Aerobic glycolysis: meeting the metabolic requirements of cell proliferation. Annu. Rev. Cell Dev. Biol. 27:441–464. http ://dx .doi .org /10 .1146 /annurev -cellbio -092910 -154237 Lunt, S.Y., V. Muralidhar, A.M. Hosios, W.J. Israelsen, D.Y. Gui, L. Newhouse,
M. Ogrodzinski, V. Hecht, K. Xu, P.N.M. Acevedo, et al. 2015. Pyruvate kinase isoform expression alters nucleotide synthesis to impact cell proliferation. Mol. Cell. 57:95–107. http ://dx .doi .org /10 .1016 /j .molcel .2014 .10 .027
Mizel, S.B. 1989. The interleukins. FASEB J. 3:2379–2388.
Nuñez, G., D. Hockenbery, T.J. McDonnell, C.M. Sorensen, and S.J. Korsmeyer. 1991. Bcl-2 maintains B cell memory. Nature. 353:71–73. http ://dx .doi .org /10 .1038 /353071a0
Park, J.-M., J.-Y. Lee, J.-G. Lee, H. Jeong, J.-M. Oh, Y.J. Kim, D. Park, M.S. Kim, H.J. Lee, J.H. Oh, et al. 2012. Highly efficient assay of circulating tumor cells by selective sedimentation with a density gradient medium and microfiltration from whole blood. Anal. Chem. 84:7400–7407. http ://dx .doi .org /10 .1021 /ac3011704
Pearce, E.L. 2010. Metabolism in T cell activation and differentiation. Curr.
Opin. Immunol. 22:314–320. http ://dx .doi .org /10 .1016 /j .coi .2010 .01 .018 Puleston, D.J., H. Zhang, T.J. Powell, E. Lipina, S. Sims, I. Panse, A.S. Watson,
V. Cerundolo, A.R. Townsend, P. Klenerman, and A.K. Simon. 2014. Autophagy is a critical regulator of memory CD8(+) T cell formation.
eLife. 3:1–21. http ://dx .doi .org /10 .7554 /eLife .03706
Rathmell, J.C. 2004. B-cell homeostasis: digital survival or analog growth? Immunol.
Rev. 197:116–128. http ://dx .doi .org /10 .1111 /j .0105 -2896 .2004 .0096 .x Rathmell, J.C., M.G. Vander Heiden, M.H. Harris, K.A. Frauwirth, and
C.B. Thompson. 2000. In the absence of extrinsic signals, nutrient utilization by lymphocytes is insufficient to maintain either cell size or viability. Mol. Cell. 6:683–692. http ://dx .doi .org /10 .1016 /S1097 -2765(00)00066 -6
Rathmell, J.C., E.A. Farkash, W. Gao, and C.B. Thompson. 2001. IL-7 enhances the survival and maintains the size of naive T cells. J. Immunol. 167:6869– 6876. http ://dx .doi .org /10 .4049 /jimmunol .167 .12 .6869
Rolf, J., M. Zarrouk, D.K. Finlay, M. Foretz, B. Viollet, and D.A. Cantrell. 2013. AMPKα1: a glucose sensor that controls CD8 T-cell memory. Eur.
J. Immunol. 43:889–896. http ://dx .doi .org /10 .1002 /eji .201243008 Sancak, Y., T.R. Peterson, Y.D. Shaul, R.A. Lindquist, C.C. Thoreen, L.
Bar-Peled, and D.M. Sabatini. 2008. The Rag GTPases bind raptor and mediate amino acid signaling to mTORC1. Science. 320:1496–1501. http ://dx .doi .org /10 .1126 /science .1157535
Sedlak, T.W., Z.N. Oltvai, E. Yang, K. Wang, L.H. Boise, C.B. Thompson, and S.J. Korsmeyer. 1995. Multiple Bcl-2 family members demonstrate selective dimerizations with Bax. Proc. Natl. Acad. Sci. USA. 92:7834– 7838. http ://dx .doi .org /10 .1073 /pnas .92 .17 .7834
Sekulić, A., C.C. Hudson, J.L. Homme, P. Yin, D.M. Otterness, L.M. Karnitz, and R.T. Abraham. 2000. A direct linkage between the phosphoinositide 3-kinase-AKT signaling pathway and the mammalian target of rapamycin in mitogen-stimulated and transformed cells. Cancer Res. 60:3504–3513. Sullivan, L.B., D.Y. Gui, A.M. Hosios, L.N. Bush, E. Freinkman, and
M.G. Vander Heiden. 2015. Supporting aspartate biosynthesis is an essential function of respiration in proliferating cells. Cell. 162:552–563. http ://dx .doi .org /10 .1016 /j .cell .2015 .07 .017
Thoreen, C.C., S.A. Kang, J.W. Chang, Q. Liu, J. Zhang, Y. Gao, L.J. Reichling, T. Sim, D.M. Sabatini, and N.S. Gray. 2009. An ATP-competitive mammalian target of rapamycin inhibitor reveals rapamycin-resistant functions of mTORC1. J. Biol. Chem. 284:8023–8032. http ://dx .doi .org /10 .1074 /jbc .M900301200
Valentin, M., and E. Yang. 2008. Autophagy is activated, but is not required for the G0 function of BCL-2 or BCL-xL. Cell Cycle. 7:2762–2768. http ://dx .doi .org /10 .4161 /cc .7 .17 .6595
Vander Heiden, M.G., N.S. Chandel, P.T. Schumacker, and C.B. Thompson. 1999. Bcl-xL prevents cell death following growth factor withdrawal by facilitating mitochondrial ATP/ADP exchange. Mol. Cell. 3:159–167. http ://dx .doi .org /10 .1016 /S1097 -2765(00)80307 -X
Vander Heiden, M.G., D.R. Plas, J.C. Rathmell, C.J. Fox, M.H. Harris, and C.B. Thompson. 2001. Growth factors can influence cell growth and survival through effects on glucose metabolism. Mol. Cell. Biol. 21:5899– 5912. http ://dx .doi .org /10 .1128 /MCB .21 .17 .5899 -5912 .2001
van der Windt, G.J.W., B. Everts, C.H. Chang, J.D. Curtis, T.C. Freitas, E. Amiel, E.J. Pearce, and E.L. Pearce. 2012. Mitochondrial respiratory capacity is a critical regulator of CD8+ T cell memory development. Immunity. 36:68–78. http ://dx .doi .org /10 .1016 /j .immuni .2011 .12 .007
Van Parijs, L., and A.K. Abbas. 1998. Homeostasis and self-tolerance in the immune system: turning lymphocytes off. Science. 280:243–248. http :// dx .doi .org /10 .1126 /science .280 .5361 .243
Wellen, K.E., C. Lu, A. Mancuso, J.M.S. Lemons, M. Ryczko, J.W. Dennis, J.D. Rabinowitz, H.A. Coller, and C.B. Thompson. 2010. The hexosamine biosynthetic pathway couples growth factor-induced glutamine uptake to glucose metabolism. Genes Dev. 24:2784–2799. http ://dx .doi .org /10 .1101 /gad .1985910
Wieman, H.L., J.A. Wofford, and J.C. Rathmell. 2007. Cytokine stimulation promotes glucose uptake via phosphatidylinositol-3 kinase/Akt regulation of Glut1 activity and trafficking. Mol. Biol. Cell. 18:1437–1446. http ://dx .doi .org /10 .1091 /mbc .E06 -07 -0593
Xu, X., K. Araki, S. Li, J.-H. Han, L. Ye, W.G. Tan, B.T. Konieczny, M.W. Bruinsma, J. Martinez, E.L. Pearce, et al. 2014. Autophagy is essential for effector CD8(+) T cell survival and memory formation. Nat.
Immunol. 15:1152–1161. http ://dx .doi .org /10 .1038 /ni .3025
on February 25, 2016
jcb.rupress.org