HAL Id: hal-02146533
https://hal.archives-ouvertes.fr/hal-02146533
Submitted on 4 Jun 2019HAL is a multi-disciplinary open access archive for the deposit and dissemination of sci-entific research documents, whether they are pub-lished or not. The documents may come from teaching and research institutions in France or abroad, or from public or private research centers.
L’archive ouverte pluridisciplinaire HAL, est destinée au dépôt et à la diffusion de documents scientifiques de niveau recherche, publiés ou non, émanant des établissements d’enseignement et de recherche français ou étrangers, des laboratoires publics ou privés.
Cross subsidies across electricity network users from
renewable self-consumption
Cédric Clastres, Jacques Percebois, Olivier Rebenaque, Boris Solier
To cite this version:
Cédric Clastres, Jacques Percebois, Olivier Rebenaque, Boris Solier. Cross subsidies across electric-ity network users from renewable self-consumption. Utilities Policy, Elsevier, 2019, 59, pp.100925. �10.1016/j.jup.2019.100925�. �hal-02146533�
Cross subsidies across network users: renewable self-consumption
Cédric Clastres1, Jacques Percebois2 3, Olivier Rebenaque1 2*, Boris Solier2 3
January, 2019
The deployment of renewable energies relies upon incentive policies to make their use profitable for the owner. Increasing costs of renewable support result in rising public service obligation tariffs to fund these policies. The photovoltaic prosumption could help decreasing the cost of developing renewables but induces cross-subsidies between prosumers and other users of the network that may compensate the benefits. We show that such cross-subsidies do occur but are dependent on the self-consumption rate that will remain low in the coming years. The regulator could fund these cross-subsidies by increasing the fixed part of the network tariff for prosumers only.
Key words: self-consumption; cross-subsidies; network tariff JEL CODES: L94; Q42; L51
1 GAEL (UMR 5313), University of Grenoble-Alpes, CNRS, INRA, Grenoble-INP CS 40700, 38058 Grenoble
Cedex 9, France
2 Climate Economics Chair, Palais Brongniart, 28 Place de la Bourse, 75002 Paris, France.
3 ART-Dev (UMR 5281), University of Montpellier, Avenue Raymond Dugrand CS 79606, 34960 Montpellier
Cedex 2
*Corresponding author E‐mail addresses:
Introduction
The development of renewable energies has been achieved so far through the use of support schemes designed to make renewables competitive with fossil fuels. Solar photovoltaic energy is one of the renewable technologies that has attracted the most attention and enjoyed much support from public policies. As a result, installed PV capacity has sharply increased recently, rising from 1 GW in 2000 to 230 GW in 2015 (Solar Power Europe, 2016). This increase has produced massive diffusion effects resulting in a sharp decrease in PV investment and generation costs (Mir-Artigues and del Río, 2016). For instance, since 2009, the levelized cost of electricity from PV technology has dropped from $0.40 per kWh to $0.06 per kWh (Solar Power Europe, 2016). Grid parity, which means the levelized cost of electricity of renewables is equal to the price of electricity purchased from the grid, could consequently be reached for PV technology in the near term, at least in some countries. But this is not yet generally the case. According to Solar Power Europe (2016), only 1.3% of PV capacity has been developed without incentive policies. So public incentive policies are still needed to ensure the development of renewable energy capacities (IEA PVPS, 2016).
As renewable energy takes a larger share of the overall mix, grid balancing is required and financial difficulties follow. Network operators – primarily distribution system operators1, must invest in new
capacity to manage the surplus of distributed energy fed into the grid and its intermittency. At the same time, incentive policies are costly and must be compensated by revenue from consumption and other network services. Thus, the development of PV electricity generation often results in two different kinds of transfer between consumers. The first one is based on the public service obligation tariff (PSOT), designed to finance the extra cost of renewables. The PSOT increases for all consumers but part of it is redistributed towards PV producers, who may also be consumers (prosumers). The second transfer is based on network tariffs. As the cost of managing distributed energy rises, with the development of PV, network tariffs should increase accordingly, they being the only source of revenue for DSOs. Since all electricity consumers pay the regulated tariff, we observe another transfer from consumers as a whole to prosumers, who benefit from network investments.
In this context, in order to reduce the pressure on public finance supporting renewables, while internalizing rising network and intermittency costs, the deployment of self-consumption of PV generation emerges as an interesting option. Self-Consumption (SC) is defined as the opportunity for a prosumer to consume all or part of what they generate (Figure 1).
1 Distributed generation is mainly connected to distribution network. For example, in France, 93% of
Figure 1: Schematic daily load consumption and PV generation curves for a residential prosumer
Self-consumption corresponds to the part of the PV generation that is consumed on a year. It represents the overlap area between the production and the consumption which corresponds to the dotted area in figure 1 (Widén, 2014). A most commonly metric to measure the mismatch between the consumption and the production is the consumption rate defined as the ratio between the self-consumption and the PV self-generation (Luthander et al., 2015). According to Jäger-Waldau (2013) the average SC rate is about 30% in Europe. In some cases, such as consumers equipped with smart-meters in France, this rate reaches about 45% for residential properties and 70% for industry (PV-Net, 2016). In Italy the SC rate in 2015 was 48% in the service sector, 58% in industry and 42% in agriculture (GSE, 2015). In Germany the rate was 27% for households, which benefited from an incentive policy to promote self-consumption. The rate is generally below 50% for households (Luthander et al., 2015), except for Sweden (Thygesen and Karlsson, 2014; Widén, 2014). However the industrial sector could exhibit higher SC rates due to greater consumption when PV generation occurs (Ong et al., 2012). So, some industrial prosumers could achieve an SC rate between 95% and 100%. This rate varies between European countries because it depends on solar radiation, consumption profiles and the self-consumption regulatory framework.
The development of self-consumption tends to reduce the total cost of developing renewables for public policies compared to Feed-in Tariffs or Net-metering mechanisms. Indeed, under these mechanisms, PV owners benefit from a public financing for every kWh produced. With self-consumption, the kWh self-consumed don’t need financial support. Moreover, PV self-consumption could also decrease the PV intermittency on the grid compared to FIT and Net-Metering mechanisms because less electricity from PV power plant goes to the electrical grid (Cohen and Callaway, 2016). But SC also entails additional costs for the electricity system (Council of European Energy Regulators (CEER), 2017; Cruciani, 2014) and financial losses for the DSO (Felder and Athawale, 2014; Küfeoglu and Pollitt, n.d.; Satchwell et al., 2014). Prosumers are usually not self-sufficient, so they still rely on the network for the residual part of their consumption. The problem arises with the structure of network tariffs, for in most EU countries they are mainly based on the volume of electricity drawn from the grid, and not so much on the capacity subscribed. So, as the level of self-consumption in the system rises, DSO revenue drops. The regulator must consequently increase the network tariff to compensate for the financial losses born by the DSO because all its costs must be financed. This situation generates
subsidies from consumers as a whole to prosumers (Brown and Bunyan, 2014; Prata and Carvalho, 2018).
Roulot and Raineri, (2018) have recently studied transfers between private and public stakeholders in France when self-consumption occurs. They have shown that some stakeholders gain (with savings on end users’ electricity bill or for the State), while others, such as the DSO loss. These losses range from €15 (industrial consumers) to €61 (households) per self-consumed MWh. We have adopted a complementary approach, focusing on network losses and network tariffs as a means of restoring the financial balance for the DSO. These authors cite the need to change the structure of electricity tariffs on the network in order to internalize network-operator losses and restore the financing of network infrastructure. Our research focuses on cross-subsidies between prosumers and others consumers, proposing new regulatory rules to internalize such subsidies. In particular we present a new balance between the fixed and variable components of network tariffs and some other solutions available for internalizing the negative impact of self-consumption on recovery of network costs. We analyze these solutions over a four-year period of regulation, allowing photovoltaic capacity and the number of prosumers to change every year. After this regulation period, network tariffs could change, but their values are not yet known.
In the present paper we estimate the level of cross-subsidies due to self-consumption in France in 2021. Our estimates are based on the methodology developed by Athawale and Felder (2016) and rely on detailed data on consumer profiles published by the French DSO. In Section 2 we discuss the range of policy instruments that could be implemented to promote SC and summarize the empirical experiments of several EU countries which have adopted such policies. Sections 3 and 4 present the methodology, data and assumptions we have used to estimate the level of cross-subsidies in the French case. Results are presented in Section 5, then in Section 6 we analyze an alternative way of ensuring that the DSO recovers all its costs. In particular we show that, of the available economic policies, increasing the fixed part of the network tariff paid by prosumers would enable the DSO to recover network losses while preventing cross-subsidies between consumers.
2. Incentive policies and empirical experiments in deploying self-consumption
Several factors affect the decision to invest in renewable energy, or not, and become a prosumer. Firstly, the initial cost of investment in a renewable installation impacts a consumer’s decision to execute the project. Secondly the retail price of electricity price, the amount of solar radiation and the demand curve all impact the profitability of the project. Thirdly the network tariff and tax exemptions reinforce profitability for prosumers but raise concerns about the recovery of network costs. Network tariffs are often based on two components: a fixed part based on the subscribed power (in kW) and a variable part based on the energy actually consumed (in kWh). The greater the latter component, the more attractive self-consumption should be, due to savings on variable costs, less electricity being drawn from the grid (Percebois, 2014; Schittekatte et al., 2018).
Public decisions could influence some of these factors. Cost barriers could be overcome by regulated prices included in long-term contracts or tax exemptions. Retail electricity price levels are often influenced by taxes set by public authorities. Network recovery costs are set by the relevant regulatory scheme. All these economic variables could still be influenced in order to encourage self-consumption. In addition to these economic factors, analysis of behaviour is relevant because that too influences the decision to become a prosumer. Such behaviour can be based on environmental concerns, energy management, power source (renewable or not), and security and reliability, among others (Boughen et al., 2013; Bremdal, 2011; Farhar and Buhrmann, 1998).
2.1. Incentive policies and self-consumption
Several countries use net-metering or billing to manage self-consumption (Dufo-Lopez and Bernal-Agustin, 2015). Net-metering calculates the prosumers’ net consumption as the total consumption of the site minus the volume of renewable energy fed into the grid (DGEC, 2014). Prosumers only pay the net consumption of their site. In this case the network acts as a back-up power plant, supplying the residual demand of the site while offering security and reliability services. This mechanism assumes that the value of the energy fed into the grid is the same as that of energy drawn from the grid. Net-billing differs from net-metering in this respect. Energy exported to the grid has a different monetary value from imported energy. In the first case it is valued at market price or the “avoided cost price”, whereas the value of imported electricity is higher, equal to the retail price. The two incentive mechanisms account for 16% of incentives to encourage deployment of PV installations. The main driver is still the feed-in-tariff scheme.
In the case of net-metering savings represent the only revenue stream for prosumers. So, for self-consumption to develop, the cost of PV generation must be lower than the retail price. In the case of net-billing the same is true of PV costs, with the additional impact of the exported tariff. To maintain the incentive for self-consumption, this tariff must not be too high. Otherwise prosumers would earn more by feeding all their production into the grid. Several authors (Gautier et al., 2018) have criticized the net-metering system, mainly on account of its inefficiency inducing effective economic signals for the deployment of renewable energies2, but also because it creates numerous transfers between prosumers
and other consumers (network-cost transfers). In its recent Clean Energy for All package, proposing new regulatory rules for the energy market, the EU bans the use of net-metering as a means of encouraging the deployment of self-consumption (Creti et al., 2017).
2.2. Learning from empirical experiments in self-consumption in Europe
Debate on the cost of incentive policies for renewables, such as feed-in tariffs, started at an earlier date. Indeed feed-in tariffs have steadily increased, prompting policy-makers to consider several ways of reducing them. Promoting self-consumption would be one way of reducing the cost of such incentives. It would also reduce the impact of feed-in tariffs on the overall electricity system.
Policy-makers have implemented several incentive schemes to encourage self-consumption. Germany and Denmark have introduced tax exemption schemes, public-service obligation tariffs and network tariff fees for prosumers. Feed-in tariffs have been cut to reduce the volume of electricity being fed into the grid. A premium on each self-consumed kWh is added and the retail rate is increased to make self-consumption profitable (Dusonchet and Telaretti, 2015; Masson et al., 2016). This increase shifts the balance between the levelized cost of electricity and the retail rate. As the former is lower than the latter, prosumers save through self-consumption rather than paying for electricity from the grid (Sarasa-Maestro et al., 2013).
In addition to all these instruments, Spain and Italy have also introduced net-metering. But this scheme has not proved an effective way of promoting self-consumption and has been banned by the EU (Creti et al., 2017). Others incentive schemes have pushed up self-consumption rates by as much as 40% in just a few years.
2 Energy imported from and exported to the grid is valued at the same price, namely the retail price which is
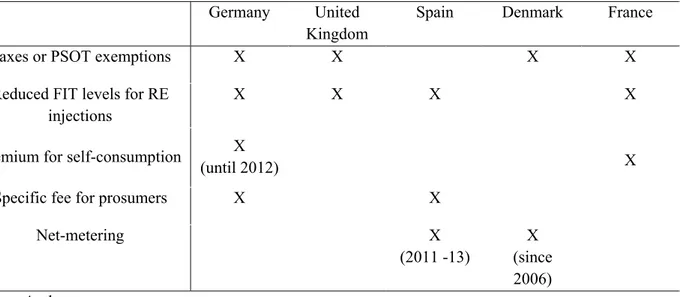
High rates of self-consumption have raised other concerns for policy-makers, primarily cross-subsidies between prosumers and others consumers. Exemptions and a negative relation between self-consumed electricity and electricity drawn from the grid, have had a negative impact on public-service obligation tariffs and the recovery of network costs. Normal consumers must pay a bigger share of the PSOT or network costs than prosumers. In response policy-makers have modified incentive schemes. Germany, where the retail rate has increased, has stopped the premium system, self-consumption being more profitable. Elsewhere (France) the premium system is still in use. Policy-makers (Spain, United Kingdom, Germany) have also decided to restore the payment of fees by prosumers to improve the recovery of network costs and reduce cross-subsidies. Others (France) have increased the flexibility of self-consumption, considering the opportunity to self-consume in a larger area, creating energy communities for self-consumption (CRE, 2018).
Table 1: Summary of incentive policies to promote self-consumption in Europe
Source: Authors
3. Data and assumptions for computing self-consumption and cross-subsidies
We use a set of assumptions and data to forecast the volume of photovoltaic capacity installed in France by 2021 as well as the consumption and PV generation load curves for various consumer profiles. 3.1. Assumptions for forecast of PV capacity in 2021
In January 2018, 8 GW of photovoltaic (PV) capacity3 was connected to the grid in France,
representing 7% of the total electricity generating capacity. Enedis, France’s incumbent DSO, published the breakdown of PV capacity for each level connected to its network (Table 2). Ademe (French Environment and Energy Management Agency) uses a similar sector-based breakdown of capacity. Residential, industrial and commercial segments represent 52% of total capacity connected to the Enedis-managed grid. 3 http://www.statistiques.developpement‐durable.gouv.fr/publicationweb/103. Germany United Kingdom
Spain Denmark France
Taxes or PSOT exemptions X X X X
Reduced FIT levels for RE injections
X X X X
Premium for self-consumption X
(until 2012) X
Specific fee for prosumers X X
Net-metering X
(2011 -13)
X (since 2006)
Table 2: Total PV capacity by sector in 01/2018
kW Sector Total plants Total capacity (MW)
] 0 – 9] Residential 339,378 1,167
] 9 – 2504] Business premises 31,379 2,237
] 250 – 12,000] Ground-mounted 1,082 2,237
Total 371,839 6,528
Source: Enedis (2018a)
By 2023 the French government is expecting to reach a total capacity between 18.2 GW and 20.2 GW. For the period between 2016 to the first quarter of 2019 it has published a schedule of PV tenders to achieve those goals. Each year 2.45 GW will be allocated to ground-mounted power plants (500 kW to 17 MW) and 1.35 GW to rooftop power plants (100 kW to 8 MW). Other tenders are planned for self-consumption installations. The first call for tenders was launched in 2016 and, at present, 40 MW have been allocated, mainly to PV projects. To promote self-consumption the government has decided to extend this type of tender until 2019, representing annual capacity of 150 MW.
Prosumers represent 36% of overall photovoltaic investment in 2016 (8,000 sites) and 70% of the first semester of 2017 (6,000 sites5). All PV plants with a capacity lower than 100 kW connected after
August 2017 are assumed to self-consume part of their output. In the following study we only consider these installations and self-consumption tenders when estimating cross-subsidies between conventional consumers and prosumers. The government has set a goal of 350 MW a year for capacity under 100 kW. The present article uses the same target up to 2021 and we assume that photovoltaic deployment will be the same for households and firms, (175 MW for each sector, see Table 3). According to the schedule of tenders6, PV capacity from tenders is following the trend in the table below. In August 2021 1.89 GW
of self-consumption PV capacity is expected.
Table 3: Variation in PV capacity subject to self-consumption obligations up to 08/2021 (MW)
MW 08/18 08/19 08/20 08/21 Total
Residential 175 175 175 175 700
Business 175 175 175 175 700
Tenders 90 150 150 100 490
Source: Ministry of Ecological and Inclusive Transition (2016) 4 Some firms have photovoltaic power plants above 250 kW but they are only a few of them and we assume that firms will not invest beyond 500 kW. They are more likely to enter a call for tenders for PV power plants between 100 kW and 500 kW. 5 Available at: https://www.ecologique‐solidaire.gouv.fr/nicolas‐hulot‐presente‐grands‐axes‐accelerer‐ deploiement‐des‐energies‐renouvelables‐electriques. 6 Available at: http://www.cre.fr/documents/appels‐d‐offres.
3.2. Consumer characteristics
Given that consumer profiles vary, we have made several assumptions to characterize patterns of consumption. Their profiles are based on Enedis data used by the French regulator to set network tariffs. They are characterized by load consumption and the voltage rating of their connection. We have used the same data and approach as Roulot and Raineri (2018) to compute consumer profiles. Households are split into two categories depending on their load profiles. The first one represents consumers with a single flat tariff who usually have a low electricity load and no electric heaters. The second one corresponds to consumers with a time‐of‐use (TOU) tariff. According to the sample provided by the French regulator the first profile, RES1, represents 55% of households, whereas the second one called, RES2, accounts for the remaining 45%. Both of them have a subscribed power rating of 6 kVA. Businesses with PV panels under 100 kW are assumed to be connected at a voltage level between 36 kVA and 250 kVA, which corresponds to a specific interval between low and medium voltage. For this specific voltage interval Enedis has established two different profiles which differ according to the gap between average consumption and subscribed power. We apply the short‐use profile (ENT1) to businesses because they represent 87% of all the firms in this voltage interval. We assume that firms selected by tenders (ENT3) have a medium‐voltage connection. Our assumption is based on the fact that the first batch of firms awarded tenders announced an average self‐ consumption rate of about 95%. So, firms must have high electricity consumption to absorb the PV power they generate. Table 4 details average consumption and subscribed power by period of time for each profile, based on the sample provided by the French regulator.
Table 4: Average consumption and subscribed power for each consumer profile based on the sample provided by the CRE
Profiles RES1 RES2 ENT1 ENT3
Co n sumpt io n (kWh) High rate winter 1,405 2,039 55,143 468,729 Low rate winter ‐ 1,400 16,966 339,689 High rate summer 1,602 1,220 67,504 665,045 Low rate summer ‐ 1,032 20,966 540,477 Subscribed p owe r (kW) High rate winter 6 6 61 496 Low rate winter 40 434 High rate summer 62 503 Low rate summer 41 446 Source: Commission de Régulation de l’Energie (2017) 3.3. PV size We assume that households install PV capacity of 3 kW. It corresponds to the median of all the PV panels connected in France to the low‐voltage network (Rebenaque, 2017). The average
consumption peak for firms connected to a voltage level between 36 kVA and 250 kVA is 74 kW. We assume that firms will not install a PV installation with a capacity above their peak consumption, so we apply a PV capacity of about 70 kW for a typical business, allowing an average self‐consumption rate of 74%. As presented in the previous sub‐section, self‐consumption tenders concern PV capacity between 100 kW and 500 kW, so we assume that on average these firms will install a PV capacity of 300 kW.
3.4. Load curves
Enedis provides profile coefficients for various categories of customers. These coefficients are computed by calculating the weighted average of a load curve for every customer from a sample obtained by the DSO. Load curves are then computed by multiplying the average annual consumption of each profile ACi by a specific coefficient for each period of half an hour. So, the consumption 𝐶, for each half‐hour "𝐻𝐻" (nHH=17,520, the total number of half‐hours per year) and for consumer profile i= {RES1, RES2, ENT1, ENT2} is: 𝐶, 𝐸𝑛𝑒𝑑𝑖𝑠 𝐶𝑜𝑒𝑓𝑓𝑖𝑐𝑖𝑒𝑛𝑡, ∗ 𝐴𝐶 1 In order to compute the volume of PV generation for each consumer profile per half‐hour, we first estimate the average annual load factor. We rely on public data provided by Enedis on the volume of photovoltaic generating capacities KPV and PV generation GPV on an annual basis in 2012‐17. Based on
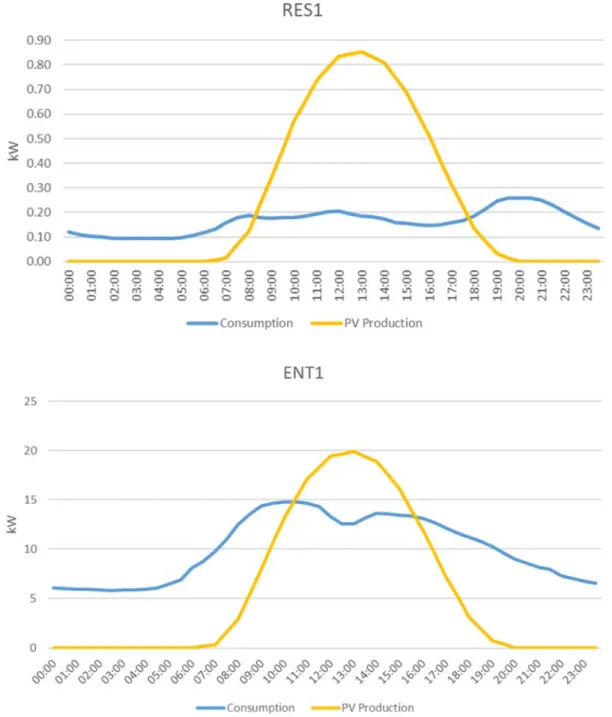
the data we deduce the average Load Factor of solar capacity L𝐹 using the following relation: L𝐹 𝐺 𝐾 ∗ 𝑛 2 Then annual photovoltaic generation for consumer profile 𝑖 𝐺 is computed from equation 3: 𝐺 𝐾 ∗ 𝐿𝐹 ∗ 𝑛 3 Where 𝐾 is the total capacity for consumer profile i, 𝐿𝐹 is the load factor expressed in relation 2 . By comparing the volume of generation and consumption for each half‐hour, we can assess the volume of self‐consumption and generation injected into the grid. Self‐consumption is thus computed for each half‐hour HH as in equation 4: 𝑆𝐶, min 𝐺 , , 𝐶, 𝑖𝑓 𝐺 , 0 0 𝑖𝑓 𝐺 , 0 4 Typical daily load and generation curves for RES1 consumers are depicted in Figure 2.
Figure 2: Typical consumption and PV load curves for the household “RES1” and the firm “ENT1” (Monday 3 April) Source: Authors’ contribution based on Enedis (2018b) 3.5. Network tariffs
Network tariffs are usually two-part tariffs. In France, the fixed charge usually accounts for both metering and administrative management costs, and for the subscribed capacity subscribed by the consumer. However, a small part of the CAPEX is recovered from the fixed charge (Boiteux, 1960, 1956). It’s mostly recover from the variable part which is mainly the case in the European Union (European Commission, 2015; Schwartz et co, 2016).
So, the fixed charge usually accounts for both
metering and administrative management costs, and for the subscribed capacity subscribed by
the consumer. This allocation of costs is not applied in practice (European Commission, 2015;
Schwartz et al., 2016) and some CAPEX is recovered from the variable part. In August 2017
the French energy regulator published a new network tariff. The charges were set in 2017 and
will hold till 2020. They have changed in several respects compared with the previous schedule.
Specific seasonal (winter and summer) tariffs have been introduced for consumers fitted with a
Linky smart meter. The smart meter will be deployed for all consumers by 2021, so all of them
should have this specific tariff by then. Moreover, Linky is required when any investments are
made in photovoltaic power plants. So, we have applied these new network tariffs to our
consumers, as shown in Table 5.
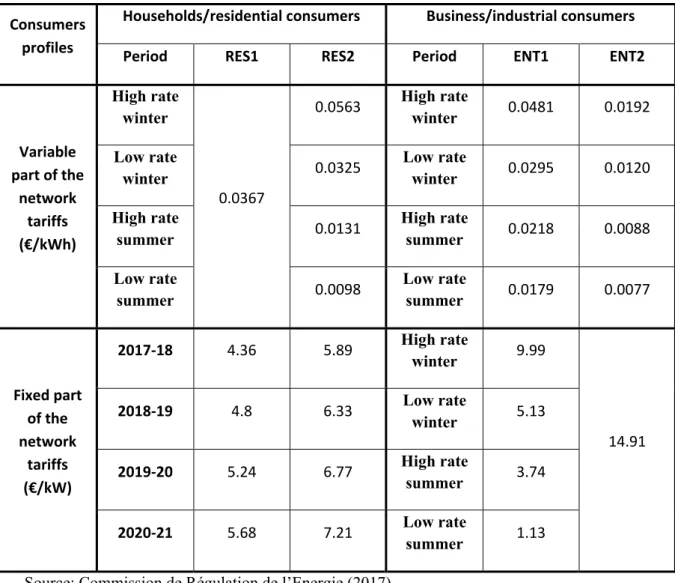
Table 5: Variable part of network tariff for end users (RES1: household - low consumption; RES2: household – high consumption; ENT1: firm – low consumption; ENT2: firm – high consumption) Consumers
profiles
Households/residential consumers Business/industrial consumers
Period RES1 RES2 Period ENT1 ENT2
Variable part of the network tariffs (€/kWh) High rate winter 0.0367 0.0563 High rate winter 0.0481 0.0192 Low rate winter 0.0325 Low rate winter 0.0295 0.0120 High rate summer 0.0131 High rate summer 0.0218 0.0088 Low rate summer 0.0098 Low rate summer 0.0179 0.0077 Fixed part of the network tariffs (€/kW) 2017‐18 4.36 5.89 High rate winter 9.99 14.91 2018‐19 4.8 6.33 Low rate winter 5.13 2019‐20 5.24 6.77 High rate summer 3.74 2020‐21 5.68 7.21 Low rate summer 1.13
Source: Commission de Régulation de l’Energie (2017)
The annual network charges for 2017 are shown in Table 6. The variable part of the tariff ranges from 80% to 85% except for large users (45%). The fixed part of the tariff ranges from 20% to 25% except for large users (55%).
Table 6: Annual network charges for our consumer profiles (2017)
End users Variable part (€) Fixed part (€) Network tariff (€)
RES1 110 26 136
RES2 187 35 222
ENT1 5,002 1,095 6,097
ENT2 2,3122 28,007 51,129
Source: Authors (data from Enedis [2018b] and Commission de Régulation de l’Energie [2017])
4. Modelling cross-subsidies
Here we present the model used to estimate the impact of self-consumption of electricity on revenue lost by the DSO and the corresponding increase in network tariffs applied to all consumers. This methodology is based on the work of Athawale and Felder (2016).
4.1. Network operator deficit
As we have seen above, prosumers pay the fixed part but only a small variable part on their residual consumption. So, revenue from network tariffs could be reduced and the DSO would have difficulty recovering its costs, with increasingly unstable financial flows and prices (Picciariello et al, 2015; Kubli, 2015; Simshauser, 2015).
To compute cross-subsidies over several years, we start by estimating the number of prosumers. For each consumer profile we compute the number of prosumers for each year dividing the total capacity for each profile by the average PV capacity (Table 7).
Table 7: Variation of the number of prosumers
Profiles 2017‐18 2018‐19 2019‐20 2020‐21 RES1 35 000 70 000 105 000 140 000 RES2 23 333 46 667 70 000 93 333 ENT1 2 500 5 000 7 500 10 000 ENT3 300 800 1 300 1 633 Total 61 133 122 467 183 800 244 967
Then, we estimate the volume of PV self-consumption for each time period p of network tariffs7
𝑆𝐶, in Equation 5, i,e by multiplying the volume of self-consumption for each consumer profile 𝑆𝐶, 𝑤𝑖𝑡ℎ 𝐻𝐻 ∈ 𝑝 by the corresponding number of prosumers 𝑃𝑉 .
𝑆𝐶, 𝑆𝐶,
∈
∗ 𝑃𝑉 5
7 The periods of network tariffs are detailed in Table 5. Thus p= {High rate winter, Low rate winter, High rate
summer, Low rate summer}.
We then obtain network financial losses for each consumer profile in Equation 6. They are computed by multiplying the total volume of self-consumption by the corresponding network tariff for each period (𝑇, :
𝐹𝐷 𝑆𝐶, ∗ 𝑇, 6
We also introduce in our analysis the impact of self-consumption on network losses. Self-consumption also decreases electricity losses on the grid. Electricity losses, L, on the French grid are given by:
𝐿 𝑎𝑃 𝑏𝑃 𝑐 7
With Pw and Pwe respectively the amount of power consumed on weekdays and at the week-end; 𝑎 a
parameter applied to weekdays; 𝑏 a parameter applied to week-ends; and 𝑐 a non-technical parameter which allows for counting error and fraud. The estimated load curves allow us to compute the volume of self-consumption for every week and week-end. We then multiply the parameter 𝑎 and 𝑏 respectively by the total amount of self-consumption during weekdays and week-ends. We obtain the avoided network losses thanks to self-consumption, valued at average future prices8.
4.2. Estimating cross-subsidies
To cover its financial deficit the DSO might increase the network tariff for all consumers. In order to limit the death spiral induced by the increase of the variable charge (Eid et al., 2014; Picciariello et al., 2015; Simshauser, 2016), we assume that the DSO will increase the fixed charge for every consumer to equal the amount of cross-subsidies CS (€/kW):
𝐶𝑆 𝐹𝐷
𝐶𝑃
∑ 𝐹𝐷 𝐿
𝐶𝑃 8
Where 𝐶𝑆 is the amount of cross-subsidies per kW; 𝐹𝐷is the DSO’s financial deficit; and 𝐶𝑃 the total subscribed power in kW. The last value is provided by the French regulator until 2021 (CRE, 2016). Then we assess the impact of the development of self-consumption by multiplying the amount of cross-subsidies CS by the subscribed power of each representative consumer.
5. The results: low value of cross-subsidies between consumers
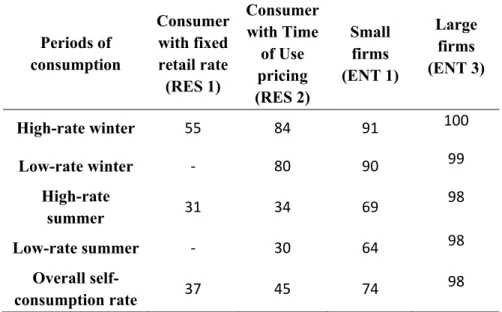
We present self-consumption rates for each representative consumer in Table 8 below. Obviously, they depend on the consumption levels of each category, so RES 1 – the smallest consumers – display the lowest self-consumption rates (31% and 55% respectively for summer and winter). Large firms could consume most of their PV output (about 98% to 100% respectively for the low-rate summer and high-rate winter periods). These results are consistent with the intuition that self-consumption rates are higher for firms than for residential consumers, business activity more often coinciding with the times when PV generation occurs.
8 For the relevant prices see http://www.eex.com/en/market‐data/power/futures/french‐
Table 8: Self-consumption rates (%) for each representative consumer Periods of consumption Consumer with fixed retail rate (RES 1) Consumer with Time of Use pricing (RES 2) Small firms (ENT 1) Large firms (ENT 3) High-rate winter 55 84 91 100 Low-rate winter ‐ 80 90 99 High-rate summer 31 34 69 98 Low-rate summer ‐ 30 64 98 Overall self-consumption rate 37 45 74 98
Using the self-consumption volumes and network tariffs presented in Table 5, we compute the variable network charges saved by prosumers. They are presented in Table 9.
Table 9: Savings (€) in network charges for prosumers 2018-2021 Periods of consumption9 / Consumer profiles 2018 2019 2020 2021 Savings per prosumers (€) RES 1 1,683,194 3,366,387 5,049,581 6,732,775 48 RES 2 1,130,852 2,261,704 3,392,556 4,523, 408 48 ENT 1 4,531,478 9,062,957 13,594,435 18,125,913 1,813 ENT 3 1,145,848 3,055,595 4,965,343 6,238,507 3,819 Total 8,491,372 17,746,644 27,001,915 35,620,604
The gain per consumer is higher for large industries, depending on the self-consumed volumes and smaller number of prosumers. Depending on specific consumption profiles, each residential consumer could save €48 a year and firms €1,813 or €3,819 a year respectively for small and large industries10.
The overall value of savings rises from one period to the next due to the increase in the number of prosumers and PV generation capacity. These savings are derived from the variable part of the network tariffs so they entail imbalances of €8.49 million (2018) to €35.62 million (2021) in DSO revenue. However self-consumption also leads to cost savings for the DSO in the management of network losses. They are presented in Table 10.
9 Consumption periods run from September year Y‐1 to august year Y.
Table 10: Reduction in network losses for the DSO 2018-2021 Periods of consumption 2018 2019 2020 2021 Future prices (€/MWh) 40.87 40.24 40.50 40.50 Reduction in network losses (MWh) 16,312 35,992 55,672 72,546 Reduction in network losses (€) 754,995 1,487,638 2,244,203 2,992,271
Reduction in network losses could amount to about 8.4% of DSO’s revenue losses each year. They reduce financial losses that the DSO must recover through its network charge when self-consumption occurs. To fund DSO revenue losses, the regulator could decide to increase the fixed or variable parts of the network tariff, for all consumers or only prosumers. It could also create a new network tariff for prosumers, based on the reliability which prosumers enjoy. The increase in the variable part of the tariff would be very low, because of the lower self-consumption volumes compared to overall consumption (self-consumption amounts to 0.07% in 2018, rising to 0.35% of total forecast consumption in 2021). So cross-subsidies will represent from 0.02€/MWh in 2018 to 0.07€/MWh in 2021. However, when the financial deficit is recovered by an increase in the variable component, the system enters a death spiral (Costello et al., 2014; Felder et al., 2014). The increase in the fixed part should be higher because of the lower volumes contracted in MW or kW but they would remain very low if we consider the fixed part paid by consumers. Cross-subsidies range from 0.022€/kW in 2018 to 0.09€/kW in 2021. For a consumer, cross-subsidies only marginally increase their fixed share of network costs with a maximum of a 2% for RES 1 consumers in 2021. This increase remains below 1% for large consumers and below 1.7% for consumers with time-of-use pricing or small firms over the four periods studied.
6. The impact of self-consumption on network access pricing: a way of reforming the network tariff
The large-scale development of self-consumption of electricity raises the issue of the optimal structure of the tariff, as Roulot and Ranieri (2018) mention in their research. With the current structure, which often relies on a low fixed component, a large producer of photovoltaic or wind power consuming almost all the power it produces and only using the network marginally will pay a fair share of variable costs. Thus, it will only make a marginal contribution to covering fixed network costs, which will lead to "cross-subsidization" detrimental to other customers. For reasons of equity, the structure of the tariff for access to the transmission and distribution networks must therefore be adjusted by increasing the fixed part of the tariff.
In this section we propose a new structure for the network tariff, which consists in increasing the fixed part for prosumers only. This would restore cost recovery by the DSO and prevent free-riding by prosumers. As the incentive to invest in PV generation does not only rely on self-consumption gains from the network, this decision could improve the payment of network costs by prosumers11. Another
solution would be to set a new network tariff based on the degree of reliability required by prosumers. All consumers connected to the grid must pay a fee to the DSO to prevent power cuts. A prosumer who remains connected to the distribution network treats it as a back-up and must therefore be allocated a
11 Incentives to invest in PV generation and self‐consumption also contribute to a fall in energy purchases at the
retail price, the FIT for PV surplus fed into the grid, and PSOT exemption, which rewards each self‐consumed kWh, etc. The study of these incentives policies is outside the scope of this research.
price which takes account of this specific behaviour. These solutions make it possible to cover the revenue losses supported by the DSO without entailing cross-subsidies between consumers.
6.1. Prosumers and network reliability tariff
The network may be seen as a reliable asset, which prevents a loss of consumer welfare. So the cost-of-failure and value-of-lost-load approaches could be used (Hansen et al., 2015). For instance, RTE, the French TSO, has shown that the economic cost of a power outage exceeding 3 minutes is €26/kWh, higher than the retail rate (about €0.17/kWh). The average cost of a one-hour outage is €25 for a household, but households are only willing to pay €17 to avoid it (RTE, 2012). These figures include the cost of generating, transmitting and distributing a kWh and the corresponding taxes.
Prosumers must strike a balance between maximizing savings and the probability of an outage if the DSO does not cover all its network costs. So, prosumers must cope with the Value of Lost Load (VOLL) i.e. the cost of a MV curtailed (Stoft, 2002). Depending on their overall savings from self-consumption, and willingness-to-pay to avoid shortfalls (from €17/kWh to €25/kWh), prosumers would be willing to cover revenue losses incurred by the DSO. The RES 1 and RES 2 categories would agree to pay a maximum fixed fee of €48, whereas the ENT 1 and ENT 3 categories would pay fees of €1,813 and €3,819 respectively. These fees are consistent with a shortfall of a few kWh compared to the consumption of end-users (a shortfall from 0.32 kWh and 2.8 kWh for residential consumers; 72.5 kWh to 106.6 kWh for small firms; 152.6 kWh to 224.6 kWh for large firms). It is plausible that the greater the share of self-production, the less the consumer is willing to pay. Consumers make less use of the network to reduce their concerns regarding network reliability and security. Moreover, the consumer will waive this guarantee if the cost of individual storage allows them to be self-sufficient in electricity. The cost of storage therefore sets the ceiling price of the emergency tariff. As the cost of battery storage falls, prosumers are likely to be less and less willing to pay to guarantee network access.
6.2. An increase in the fixed part of the network tariff for prosumers
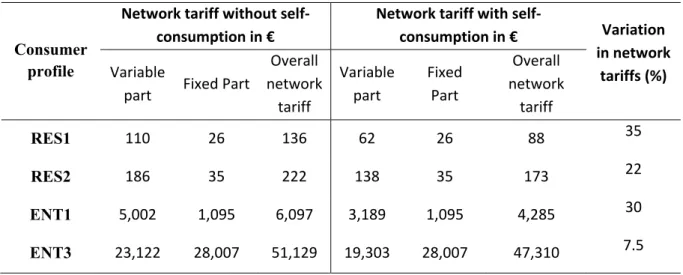
We present the network tariff paid with and without self-consumption in Table 11. The decrease in network tariffs is lower for larger firms, variable network tariffs being lower than for other consumers. Moreover, big firms have large residual consumption, as self-consumption accounts for 17.6% of their overall consumption (as against 43.6% and 28.6% for RES1 and RES2 respectively, and 38.7% for small firms).
Table 11: Network tariffs with and without self-consumption
Consumer profile Network tariff without self‐ consumption in € Network tariff with self‐ consumption in € Variation in network tariffs (%) Variable part Fixed Part Overall network tariff Variable part Fixed Part Overall network tariff RES1 110 26 136 62 26 88 35 RES2 186 35 222 138 35 173 22 ENT1 5,002 1,095 6,097 3,189 1,095 4,285 30 ENT3 23,122 28,007 51,129 19,303 28,007 47,310 7.5
For each consumer profile the DSO must recover savings presented in Table 9. Every year the fixed part of the network tariff for prosumers must increase by these amounts to anticipate and internalize DSO revenue losses. Simple calculations yield new tariffs for subscribed power (Table 12)12.
Table 12: Increases in the fixed part of network tariffs Consumer profile Average subscribed power (kW) Tariffs increase in € per kW New fixed part in network tariff (€) Increase of the fixed part (%) RES1 6 8.02 74 184 RES2 6 8.08 84 137 ENT1 51 35.54 2,908 165 ENT3 470 8.13 31,826 14
The increase in the fixed part must be large enough for households and small firms to internalize the negative effect of self-consumption on DSO revenue. This intuition depends on their network contracts, for they pay lower fees for subscribed power and higher variable tariffs, but also on lower residual demand. Using this new fixed part, network tariffs paid by prosumers are as follows (Table 13).
Table 13: New structure of network tariffs for prosumers
Consumer profile Network tariffs with self‐consumption and increased fixed part Variable part Fixed part Overall network tariff RES1 €62 46% €74 54% €136 RES2 €138 62% €84 38% €222 ENT1 €3,189 52% €2,908 48% €6,097 ENT3 €19,303 38% €31,826 62% €51,129
The overall network tariff is the same as the one without self-consumption but its structure differs, the weight of the fixed part has increased. The fixed part of the tariff accounts for 38% to 62% of cost recovery, compared with 16% to 55% in the initial network-tariff structure. A large share of network costs is now recovered from the fixed part. Moreover, the overall network tariff for prosumers also increases to compensate for losses in DSO revenue, rising by 8% for large firms (from €47,310 to €51,129), 42% for small firms (from €4,285 to €6,097), and by 54% and 28% for consumers with fixed retail rate or time-of-use contracts, respectively (from €88 to €136, and €173 to €222).
12 For another empirical example of modifications of the structure of network tariffs, see the CREDEN/OSE
study, WP 2017. In particular they found that the fixed part must increase by 75% for a firm with a subscribed power of 110 kW.
7. Conclusions
Self-consumption is developing to reduce network costs and public service obligation tariffs. Public authorities have decided to use net billing or net-metering to foster this deployment. Some of them have also exempted prosumers from taxes and PSOT to increase their gains when they do not feed their own photovoltaic production into the grid. This system has achieved its goals. Self-consumption rates range from 35% to 45% for residential and 70% to 100% for industrial consumers. The success of these policies is also related to rising energy prices and a decrease in feed-in tariffs, with self-consumption becoming more profitable.
These exemptions and the reduction in energy drawn from the grid are not sufficient to secure the recovery of network costs and the funding of public services obligations. Cross-subsidies exist between conventional energy consumers and prosumers. To avoid these cross-subsidies, exemptions are reduced and prosumers will pay a share of the public service obligation or network tariffs. These changes usually follow a period of incentive policies benefiting prosumers. With the large-scale development of self-consumption we consequently need to rethink network access tariffs if existing networks are to be financed other than by cross-subsidies. The fixed share of the network tariff must be increased for prosumers, as they wish to continue to benefit from access to the interconnected network to serve their residual demand.
As our model shows, cross-subsidies will remain very low between 2018 and 2021 in France. Forecast PV capacity and the share of PV production in total electricity generation or consumption are very low. So, the increase in network costs or PSOT exists, but the annual increase for consumers is insignificant, adding only a few euros to their annual bill. But losses by the distribution-system operator will amount to €7.7 million in 2018, rising to €32.6 million in 2021. The DSO is responsible for security, public service obligations and network deployment. These costs must therefore be recovered. As the DSO only derives its revenue from the regulated network tariff, revenue losses could lead to poorer services or more frequent power cuts. Several economic tools could be used to recover theses costs, reducing cross-subsidies. Using consumer willingness to pay for reliability, a fee based on network deficit would cost less than the value-of-lost-load that consumers support in the event of curtailments. Certainly, self-consumption could be reduced and based on others economics variables (level of retail rate, feed-in-tariffs, fees to promote investments, among others).
The regulator could also modify the share of fixed costs in the network tariff, reducing the weight of the variable part not paid by prosumers (45% to 38% for heavy users, 80% to 46% or 65% for other consumers). A significant increase in the fixed part paid by prosumers reduces the network system operator’s losses. This increase must be 14% for large firms, and from 135% to 184% for other consumers. This is due to savings that amount to 7.5% of network bills for large consumers, and 35% for households. Nevertheless, the increase must maintain incentives for self-consumption. So, an injection tariff could be decided to supplement the policy. The new tariff yields additional revenue for the network operator and further incentives for prosumers, an opportunity cost, to consume their own production to minimize injection costs. Finally internalizing the risk on consumption levels could lead to network tariffs based exclusively on subscribed power, as in the Netherlands.
Physical network losses decrease with self-consumption and could amount to 8.5% of the DSO deficit. It could be higher in regions with high PV adoption but the DSO’s costs are evenly distributed throughout the country in France. Some self-consumption rates are still high. But new regulatory policies, such as the creation of energy communities and collective self-consumption (over larger areas rather than a single site) could improve this rate. Physical network losses may increase in the future. Although these gains are a step in the right direction for the DSO, their weight will not compensate its overall deficit.
It should be borne in mind that we have only taken into account the cost of network access. Further research in this field could supplement these findings. Thanks to their photovoltaic installation the consumer will obviously make a saving on their electricity bill, because they will be buying less. Nor do we make any allowance for surplus electricity that could be sold on the market or fed into the network with a set tariff. This in turn begs the question of introducing a network-injection tariff, because the DSO is entitled to compensation for the use of its network. This could be analyzed in further research, as taxing surplus energy fed into the grid would impact the incentive to increase self-consumption. It should also be noted that prosumers may gain by subscribing to a lower capacity than would be the case if they did not self-consume part of their PV output; these are all fixed costs saved. So, a network tariff heavily based on subscribed power could also encourage more strategic behaviour.
Funding
This research did not receive any specific grant from funding agencies in the public, commercial, or not-for-profit sectors.
Acknowledgements
The authors are very grateful to Yannick Perez and Philippe Menanteau for their helpful comments and suggestions, but we take full responsibility for any errors or omissions that remain. The views expressed in this paper are those of the authors and not necessarily those of the Climate Economic Chair.
References Athawale, R., Felder, F., 2016. Residential Rate Design and Death Spiral for Electric Utilities: Efficiency and Equity Considerations, in: Future of Utilities Utilities of the Future. Elsevier, pp. 193–209. https://doi.org/10.1016/B978‐0‐12‐804249‐6.00010‐5 Boiteux, M., 1960. Peak‐load pricing. J. Bus. 33, 157–179. Boiteux, M., 1956. La vente au coût marginal. Rev. Fr. Energ. Boughen, N., Contreras Castro, Z., Ashworth, P., 2013. Understanding the residential customer perspective to emerging electricity technologies: Informing the CSIRO Future Grid Forum. Bremdal, B.A., 2011. Prosumer oriented business in the energy market. Brown, A., Bunyan, J., 2014. Valuation of Distributed Solar: A Qualitative View. Electr. J. 27, 27–48. https://doi.org/10.1016/j.tej.2014.11.005 Cohen, M.A., Callaway, D.S., 2016. Effects of distributed PV generation on California’s distribution system, Part 1: Engineering simulations. Sol. Energy 128, 126–138. https://doi.org/10.1016/j.solener.2016.01.002 Commission de Régulation de l’Energie, 2017. Open Data CRE ‐ Outils de calcul des structures tarifaires [WWW Document]. Council of European Energy Regulators (CEER), 2017. Electricity Distribution Network Tariffs: CEER Guidelines of Good Practice. CRE, 2018. Délibération de la Commission de régulation de l’énergie du 7 juin 2018 portant décision sur la tarification de l’autoconsommation, et modification de la délibération de la CRE du 17 novembre 2016 portant décision sur les tarifs d’utilisation des réseaux publics d’électricité dans les domaines de tension HTA et BT. Creti, A., Percebois, J., Solier, B., 2017. The Clean Energy Package: Are its objectives always consistent? Econ. POLICY ENERGY Environ. 5–14. https://doi.org/10.3280/EFE2016‐002001 Cruciani, M., 2014. Le coût des énergies renouvelables. Dusonchet, L., Telaretti, E., 2015. Comparative economic analysis of support policies for solar PV in the most representative EU countries. Renew. Sustain. Energy Rev. 42, 986–998. https://doi.org/10.1016/j.rser.2014.10.054 Eid, C., Reneses Guillén, J., Frías Marín, P., Hakvoort, R., 2014. The economic effect of electricity net‐ metering with solar PV: Consequences for network cost recovery, cross subsidies and policy objectives. Energy Policy 75, 244–254. https://doi.org/10.1016/j.enpol.2014.09.011 Enedis, 2018a. Open Data Enedis ‐ Energie. Enedis, 2018b. Open Data Enedis ‐ Coefficients des Profils.
European Commission, 2015. Study on tariff design for distribution systems. Farhar, B.C., Buhrmann, jan, 1998. Public response to residential grid‐tied PV systems in Colorado: A qualitative market assessment. Felder, F.A., Athawale, R., 2014. The Life and Death of the Utility Death Spiral. Electr. J. 27, 9–16. https://doi.org/10.1016/j.tej.2014.06.008 Gautier, A., Jacqmin, J., Poudou, J.‐C., 2018. The prosumers and the grid. J. Regul. Econ. 53, 100–126. https://doi.org/10.1007/s11149‐018‐9350‐5 GSE, 2015. Rapporto Statistico 2015 : Solare Fotovoltaico. Hansen, J.‐P., Percebois, J., Boiteux, M., Tirole, J., 2015. Énergie: économie et politiques. De Boeck, Louvain‐la‐Neuve. IEA PVPS, 2016. Trends 2016 in photovoltaic applications : Survey report of selected IEA countries between 1992 and 2015. Jäger‐Waldau, A., 2013. PV Staus Report 2013. Küfeoglu, S., Pollitt, M., n.d. The impact of PVs and EVs on Domestic Electricity Network Charges: a case study form Great Britain. Luthander, R., Widén, J., Nilsson, D., Palm, J., 2015. Photovoltaic self‐consumption in buildings: A review. Appl. Energy 142, 80–94. https://doi.org/10.1016/j.apenergy.2014.12.028 Masson, G., Ignacio, J., Baez, M.J., 2016. Review and Analysis of PV Self‐consumption Policies. Ministère de la transition écologique et solidaire, 2016. Programmation pluriannuelle de l’énergie. Mir‐Artigues, P., del Río, P., 2016. The Economics and Policy of Solar Photovoltaic Generation, Green Energy and Technology. Springer International Publishing, Cham. https://doi.org/10.1007/978‐3‐319‐ 29653‐1 Ong, S., Campbell, C., Clark, N., 2012. Impacts of regional electricity prices and building type on the economics of commercial photovoltaic systems. Percebois, J., 2014. Les mécanismes de soutien aux énergies renouvelables, leurs forces et leurs faiblesses respectives. Picciariello, A., Vergara, C., Reneses, J., Frías, P., Söder, L., 2015. Electricity distribution tariffs and distributed generation: Quantifying cross‐subsidies from consumers to prosumers. Util. Policy 37, 23– 33. https://doi.org/10.1016/j.jup.2015.09.007 Prata, R., Carvalho, P.M.S., 2018. Self‐supply and regulated tariffs: Dynamic equilibria between photovoltaic market evolution and rate structures to ensure network sustainability. Util. Policy 50, 111–123. https://doi.org/10.1016/j.jup.2017.11.004 PV‐Net, 2016. Promotion du photovoltaïque par l’optimisation du net‐metering.
Rebenaque, O., 2017. Autoconsommation et transferts de richesses entre consommateurs. Roulot, J., Raineri, R., 2018. The impacts of photovoltaic electricity self‐consumption on value transfers between private and public stakeholders in France. Energy Policy 122, 459–473. https://doi.org/10.1016/j.enpol.2018.07.035 RTE, 2012. Quelle valeur attribuer à la qualité de l’électricité? L’avis des consommateurs. Sarasa‐Maestro, C.J., Dufo‐López, R., Bernal‐Agustín, J.L., 2013. Photovoltaic remuneration policies in the European Union. Energy Policy 55, 317–328. https://doi.org/10.1016/j.enpol.2012.12.011 Satchwell, A., Mills, A., Barbose, G., 2014. Financial Impacts of Net‐Metered PV on Utilities and Ratepayers: A Scoping Study of Two Prototypocal U.S. Utilities. Schittekatte, T., Momber, I., Meeus, L., 2018. Future‐proof tariff design: Recovering sunk grid costs in a world where consumers are pushing back. Energy Econ. 70, 484–498. https://doi.org/10.1016/j.eneco.2018.01.028 Schwartz et co, 2016. Etude comparative des tarifs d’utilisation des réseaux de distribution d’électricité en Europe. Simshauser, P., 2016. Distribution network prices and solar PV: Resolving rate instability and wealth transfers through demand tariffs. Energy Econ. 54, 108–122. https://doi.org/10.1016/j.eneco.2015.11.011 Solar Power Europe, 2016. Global Market Outlouk For Solar Power / 2016‐2020. Stoft, S., 2002. Power system economics: designing markets for electricity. IEEE Press ; Wiley‐ Interscience, Piscataway, NJ : New York. Thygesen, R., Karlsson, B., 2014. Simulation and analysis of a solar assisted heat pump system with two different storage types for high levels of PV electricity self‐consumption. Sol. Energy 103, 19–27. https://doi.org/10.1016/j.solener.2014.02.013 Widén, J., 2014. Improved photovoltaic self‐consumption with appliance scheduling in 200 single‐ family buildings. Appl. Energy 126, 199–212. https://doi.org/10.1016/j.apenergy.2014.04.008