Publisher’s version / Version de l'éditeur:
Proceedings of the 6th International Conference on the Application of Physical
Modelling in Coastal and Port Engineering and Science (Coastlab16), 2016-05
READ THESE TERMS AND CONDITIONS CAREFULLY BEFORE USING THIS WEBSITE. https://nrc-publications.canada.ca/eng/copyright
Vous avez des questions? Nous pouvons vous aider. Pour communiquer directement avec un auteur, consultez la première page de la revue dans laquelle son article a été publié afin de trouver ses coordonnées. Si vous n’arrivez pas à les repérer, communiquez avec nous à PublicationsArchive-ArchivesPublications@nrc-cnrc.gc.ca.
Questions? Contact the NRC Publications Archive team at
PublicationsArchive-ArchivesPublications@nrc-cnrc.gc.ca. If you wish to email the authors directly, please see the first page of the publication for their contact information.
NRC Publications Archive
Archives des publications du CNRC
This publication could be one of several versions: author’s original, accepted manuscript or the publisher’s version. / La version de cette publication peut être l’une des suivantes : la version prépublication de l’auteur, la version acceptée du manuscrit ou la version de l’éditeur.
Access and use of this website and the material on it are subject to the Terms and Conditions set forth at
Validation of a CFD tool for studying the interaction of extreme waves
with offshore gravity-based structures
Babaei, Hossein; Baker, Scott; Cornett, Andrew
https://publications-cnrc.canada.ca/fra/droits
L’accès à ce site Web et l’utilisation de son contenu sont assujettis aux conditions présentées dans le site LISEZ CES CONDITIONS ATTENTIVEMENT AVANT D’UTILISER CE SITE WEB.
NRC Publications Record / Notice d'Archives des publications de CNRC:
https://nrc-publications.canada.ca/eng/view/object/?id=43b31c5a-ce5f-479f-88bc-e7619f3f0cea https://publications-cnrc.canada.ca/fra/voir/objet/?id=43b31c5a-ce5f-479f-88bc-e7619f3f0ceaProceedings of the 6
thInternational Conference on the Application
of Physical Modelling in Coastal and Port Engineering and Science
(Coastlab16)
Ottawa, Canada, May 10-13, 2016
Copyright ©: Creative Commons CC BY-NC-ND 4.0
VALIDATION OF A CFD TOOL FOR STUDYING THE INTERACTION OF EXTREME
WAVES WITH OFFSHORE GRAVITY-BASED STRUCTURES
HOSSEIN BABAEI1, SCOTT BAKER2, ANDREW CORNETT3
1 hossein.babaei@nrc.ca, 2 scott.baker@nrc.ca, 3 andrew.cornett@nrc.ca
Ocean, Costal and River Engineering (OCRE), National Research Council of Canada (NRC), Ottawa
ABSTRACT
Computational Fluid Dynamics (CFD) is a potentially flexible and cost-effective approach to study the interaction of waves with offshore structures. However, extensive validation is required to determine whether CFD modelling can be used to complement or even replace a physical modelling approach. Ocean, Coastal, and River Engineering (OCRE) portfolio of the National Research Council of Canada (NRC) previously conducted a series of physical hydraulic model tests to assist in designing an offshore Natural Gas processing platform to safely and optimally withstand extreme wave conditions forecasted for the deployment site. For three different wave headings (0°, 33° and 90°), the model was tested using a combination of long-crested regular and irregular waves as well as short-crest irregular waves for conditions associated with return periods up to 10,000 years. The model platform was tested in several different configurations, including the steel gravity sub-structure (SGS) alone, and also with various other components (such as superstructure consisting of solid or grated decks, and wave deflectors). A large quantity of high quality data on wave run-up, airgap, forces, moments, and pressures was obtained.
The present paper validates the OpenFOAM® CFD toolbox for use in numerical modelling of this wave-rigid structure interaction problem. The interaction of long-crested regular waves with the structure is modelled. Global forces, overturning moments, pressures, and water levels are compared with results from the physical model. The present CFD model successfully predicts a large majority of experimental results with a high level of accuracy and proves to be a viable option for the prediction of the interaction of extreme waves with offshore gravity-based structures.
KEYWORDS: Extreme waves, offshore platform, physical modelling, CFD numerical modelling, OpenFOAM® 1 INTRODUCTION
For a safe and optimal design of offshore structures subjected to extreme waves, loads exerted by the waves on the structure and perturbations of water surface caused by the structure need to be correctly predicted. Two main prediction approaches are physical and numerical modelling, each of which has pros and cons. Physical modelling is relatively costly and usually involves testing a smaller-than-reality model structure which can introduce complications because of scaling. Physical models however, could reveal complex aspects of the mechanics of the modelled problem. These aspects might be overlooked when a numerical model is unrealistically simplistic. On the other hand, numerical modelling is relatively inexpensive and not limited by the size of the structure to be modelled. However, numerical models need to be validated to ensure dependable predictions.
NRC-OCRE previously conducted a series of physical hydraulic model tests to assist in designing an offshore hydrocarbon production platform to safely and optimally withstand extreme wave conditions forecasted for the deployment site. This work is described in further detail in the next section.
The focus of the present paper is the setup and validation of Computational Fluid Dynamics (CFD) modelling for one of the physical modelling test cases. The interaction of non-linear steep waves in intermediate-depth waters with the steel gravity sub-structure, SGS, is modelled using OpenFOAM®, a free general purpose open source CFD toolbox. Open literature on the CFD modelling of the interaction of extreme waves with complex real-life structures is not yet fully developed. This is in part because of computational limitations for modelling large three-dimensional real-life problems. These limitations are being lifted by the advent of faster computers and high-tech parallel computational technologies. For some of recent relevant literature see (Paulsen et al., 2014), (Palomares, 2015), (Afshar, 2010), (Lambert, 2012),
(Thanyamanta et al., 2011), (Palemón-Arcos et al., 2014), (Cornett et al., 2013), and (Christensen et al., 2005). 2 PHYSICAL MODELLING
A program of physical hydraulic model tests was conducted to assist in designing an offshore processing platform to withstand the extreme waves forecast for the deployment site. These tests have generated the data required to validate analysis methods for extreme wave effects on the proposed bottom founded structure, and to establish design values for environmental loads when analysis methods are insufficient (Cornett, 2011). The model tests were conducted at a scale of 1:50 in NRC-OCRE’s 36 m wide by 30 m long by up to 3 m deep Multidirectional Wave Basin located in Ottawa, Canada. Froude scaling was used to convert quantities measured in the model (including wave height, pressure, and force) to full scale or prototype values. The 1:50 scale was the largest model scale at which the required extreme wave conditions could be realized in the facility, and was selected to minimize as much as possible, scale effects stemming from improper scaling of surface tension and water viscosity.
A scaled model of the offshore platform sub-structure and the lowest parts of the deck structure was designed and fabricated by NRC and Comdor Mechanical Design. The model was fitted with instrumentation for measuring many quantities, including: water surface elevations and run-up at twenty two locations around and between the columns; kinematics of the waves passing through the platform at 4 locations; 6-axis global loads on the entire model; 6-axis global loads on the deck structure; hydrodynamic forces on each deck post; hydrodynamic forces exerted on wave deflectors mounted near the top of the SGS columns; hydrodynamic forces exerted on wave deflectors mounted near the top of the deck posts; hydrodynamic forces exerted on a horizontal test beam suspended below the deck structure; local pressures because of intermittent water contact at twenty eight locations on the surface of the SGS columns; and uplift pressures because of intermittent water contact at eighteen locations on the underside of the deck structure. All sensor outputs were collected at sampling rates ranging from 50 Hz to 10 kHz using a pair of synchronized computer-controlled data acquisition systems. The measurements were analyzed to identify key quantities such as the maximum water levels, maximum loads, and maximum pressures recorded in each test. Five video cameras were used to record all tests, including a high-speed digital video camera recording at 500 frames per second.
The model platform was tested in several different configurations: SGS alone; SGS with a grated (porous) deck structure, SGS with a plated (non-porous) deck structure; SGS with a plated deck structure and wave deflectors encircling the top of each column; SGS with a plated deck structure and an enhanced sub-cellar deck; and SGS with a plated deck structure, an enhanced sub-cellar deck, and small wave deflectors encircling the deck support posts. For each model configuration, tests were conducted in extreme wave conditions associated with return periods of 100, 1,000, and 10,000-years. Figure 1 shows two snapshots during one of the test cases. The model was tested using a combination of regular waves, long-crested irregular waves with 3-hour duration, crested irregular waves with 3-hour duration, and short-crested and long-short-crested wave snapshots (relatively brief periods of irregular wave activity selected to contain at least one extreme wave). The model was installed on a massive concrete turntable, and three different wave headings (0°, 33°, and 90°) were simulated by rotating the model within the wave basin.
3 PROBLEM STATEMENT
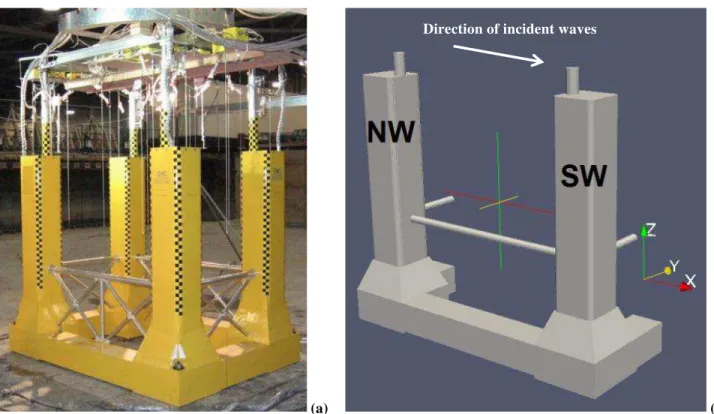
The focus of this paper is on the setup and validation of a CFD model to simulate and study the interaction of extreme waves with an offshore structure, and the comparison to physical modelling results. For this preliminary validation effort, the simplest case (SGS alone with the deck posts with head-on waves) is considered. To avoid possible complications due to scaling issues, it was decided to conduct the numerical simulations at the model scale used in the physical experiments. Figure 2a shows the physical modelling arrangement, while Figure 2b shows the numerical representation. Because of the symmetry of the incident wave condition and the structure, only half of the structure was modelled numerically. The bounding box of the full structure is approximately 2.06 m × 1.5 m × 1.88 m along the X, Y, and Z dimensions, respectively. The numerical representation of the SGS did not include the lower cross-bracing, since to do so would have required additional mesh refinement in these areas and consequently larger computational time, and these elements were not expected to contribute significantly to the global load. Some other approximate sizes are as follows: Legs: 0.280 m × 0.280 m × 1.30 m; the length of the short and the long pontoons: 1.16 m and 0.6 m; the height of the pontoons: 0.212 m; the diameter of the horizontal bars: 0.051 m, the vertical distance from the bottom of the horizontal bars to the top of the pontoons: 0.503 m. It is noted that both the prototype structure and the physical model included a small gap between the underside of the horizontal pontoons and the seabed; this gap was also taken into account in the CFD modelling. The digital geometry was built and adjusted using the freewares of Blender and netfabb Basic.
The present CFD modelling involves the interaction of regular waves with the four-legged structure. The target wave characteristics are given in Table 1. The incident waves travel along the +X direction which is the direction of the longer side of the structure in the XY plane, Figure 2b. Free water surface elevations as a function of time and location, and the global forces and overturning moments exerted by the waves on the structure are the main unknowns of the problem.
(a) (b)
Figure 2. The SGS with the deck posts: (a) the physical model structure (b) the simplified structure for the CFD modelling. NW and SW denote North-West and South-West legs.
Table 1. Target wave condition.
Wave height, H Wave period, T Calm water depth, h Wavelength, L Steepness, H/L Relative depth,
�h/L
. � . � . � . � . .
4 GOVERNING EQUATIONS AND OpenFOAM® SOLVER
The present problem is a two-phase (air and water) fluid dynamics problem. The well-known Navier-Stokes equations for the conservation of mass and momentum are the main governing equations. For an incompressible Newtonian fluid, the equations read:
� ∙ � = (1)
���
� + � ∙ �� ��= −��∗− � ∙ � �� + � ∙ ��� + � (2) where �, �, �∗, �, � and � are respectively velocity vector, density, pseudo-dynamic pressure = � − �� ∙ � , gravity vector, viscosity and other body forces vector, and � is the total pressure. �, ∙, �, superscript �, and � respectively denote the del operator, the dot product, partial derivative, matrix transpose, time, and location vector.
There are different approaches to model two phase flows in the CFD field, one of which is the Volume of Fluid (VOF) method. In the VOF approach, the interface between the two phases is tracked by the introduction of an advection equation:
��
� + � ∙ �� + � ∙ ��� − � = (3)
where � is the volume fraction of water. In the present study � is 1 when in water, 0 when in air, and an intermediate value in the interface region. This equation is then only relevant in the interface region. The third term in the left-hand side of the above equation does not have a physical meaning and is mainly introduced to prevent smear-out of the interface and guarantee the boundedness of the problem. �� is � ��| |, � | | and �� is a compression factor assigned by the CFD modeller; when ��= , Equation (3) is the “true” advection of the free surface. When known, � is used to calculate the density and the viscosity:
� = ��� + − � ��
(4) � = ��� + − � ��
where the subscripts and � denote water and air. The VOF CFD models then involve solving only one set of Navier-Stokes and surface advection equations, effectively modelling one fluid whose density and viscosity depends on the location given by Eq. (4). This approach unlike other “true” two-phase approaches leads to shorter computational time.
To solve the governing differential equations subject to proper boundary conditions, the open source freeware OpenFOAM® (version 2.2.1) tool was selected. OpenFOAM® provides solvers for several types of physics problems, including compressible and incompressible fluid dynamics, single and multiphase flow dynamics, solid mechanics, and electromagnetics. It has capabilities for different turbulence, and rheological modelling and powerful meshing and parallel computations. OpenFOAM’s main discretization method is finite-volume. The two-phase incompressible flow VOF solver of OpenFOAM® is InterFOAM which was selected for the present CFD study.
For the generation and the active absorption of numerical waves, FOAM (Higuera et al., 2013) was employed. IH-FOAM provides the generation of several wave types including solitary, linear and nonlinear waves based on Stokes, cnoidal, and stream function theories. IH-FOAM generates waves at a boundary plane rather than over a volume which leads to relatively smaller computational time. The active wave absorption capability of IH-FOAM lifts the requirement of having a “sponge” volume region to dissipate downstream waves to avoid reflections from boundaries which would otherwise lead to larger computational time.
Other wave generation and/or absorption modules that have been developed for use with OpenFOAM® include groovyBC and waves2foam (Jacobsen et al., 2012); however they were not assessed in the present CFD study.
5 DETAILS OF THE NUMERICAL WAVE BASIN
The outer boundary of the computational domain, shown in Figure 3, creates a rectangular block whose approximate size along the X, Y, and Z are 1.7L, 4.7W and h+1.3H, where W is the width of the modelled structure in Y direction. The location of the midpoint of the structure along the X axis from the boundary at which the waves are generated is approximately 0.73L. In creating the block and positioning the structure in the block, considerations were made for computational efficiency, the prevention of unwanted boundary effects and numerical decay of waves as they propagate within the domain.
Boundary conditions, in OpenFOAM® and IH-FOAM terminologies, are given in Table 2. A summary of the meaning of each boundary condition is given below:
symmetryPlane: For scalars, this boundary condition imposes a zero gradient along the normal to the plane, zeroGradient. For vectors, this boundary condition imposes a zero value for the normal component, and a zero gradient for
the tangential component of the vector.
IH_Waves_InletAlpha, IH_Waves_InletVelocity, IH_3D_3DAbsorption_InletVelocity: These conditions impose the
(Higuera et al., 2013).
buoyantPressure: This condition imposes a fixed gradient for pressure at the boundary based on the atmospheric
pressure gradient and guarantees that the second derivative of the pressure normal to the boundary vanishes. This latter condition is required for the conservation of mass.
inletOutlet: This condition imposes a fixed value or a zero gradient depending on whether the � vector is towards the
domain or not.
pressureInletOutletVelocity and totalPressure: These two conditions in addition to the above condition will lead to the
removal of the water phase if it reaches the top plane.
For more details about the boundary conditions, see the boundaries section of the OpenFOAM® User Guide.
Figure 3. The outline of the numerical wave basin and the location of the structure in the basin.
Table 2. Boundary conditions in OpenFOAM® and IH-FOAM terminologies.
� � � B o un da ry
Symmetry plane symmetryPlane symmetryPlane symmetryPlane
The plane parallel to
the symmetry plane zeroGradient zeroGradient zeroGradient Inlet plane IH_Waves_InletAlpha IH_Waves_InletVelocity buoyantPressure
Outlet plane zeroGradient IH_3D_3DAbsorption_InletVelocity buoyantPressure
Top plane inletOutlet pressureInletOutletVelocity totalPressure
Structure zeroGradient fixedValue buoyantPressure
Bottom plane zeroGradient fixedValue buoyantPressure
The velocity field on the surface of the structure is forced to be zero, also known as no-slip boundary condition. The Keulegan-Carpenter number (� = /�) for the present fluid-structure interaction problem is approximately (considering the wave celerity for speed, , and the structure’s leg width for the characteristic length, , for the calculation of the number). For conditions where � < ~ , inertial effects dominate the frictional effects (Paulsen et al., 2014), and effects of velocity boundary layer on the exerted loads on the structure could be neglected. This suggests that for the present problem, the application of a slip boundary condition could have been also justifiable. The slip boundary condition is equivalent to a zero gradient for the tangential component of the velocity and a zero value for the normal component.
Away from the structure, the mesh is constructed by nearly square cubes whose side length is approximately 0.03 m. This is equivalent to 17 discretization points per wave height (p.p.w.h.). Close to the structure, the mesh conforms to the structure to have a body-fitted mesh. The BlockMesh and SnappyHexMesh utilities of OpenFOAM® were used to mesh the computational domain. The total number of grid cells is over . million. Computations where carried out by 200 processors from a “pool” of computational nodes provided by Shared Services Canada with processor speeds ranging from 1.86 GHz to 3.16 GHz. Typical computational time step size and mean and maximum Courant numbers in the domain are respectively,
0.0004 s, 0.01, and 0.5. The computational time needed to model 20 seconds of wave-structure interactions was ~2-3 days. A number of trial runs were conducted to study the effect of coarsening the mesh on the calculated loads and moments exerted by waves on the structure; for a case when p.p.w.h. was 10 (instead of 17 mentioned above), although some of the details in trends were missed, general trends and extremums changed negligibly. For brevity, further details about this mesh sensitivity study are not reported herein.
The wave condition given in Table 1 is close to the upper limit of the applicability of Stokes III wave theory. IH -FOAM (1.0) does not provide wave generation based on the third-order and the fourth-order Stokes theories; therefore Stokes V theory was selected for the generation of waves by IH-FOAM at the up-wave boundary.
6 RESULTS
Results of the present work are summarized in this section. The generation and propagation of waves is first investigated without the structure. This is followed by a comparison of the present CFD wave-structure interaction results with experimental measurements.
Figure 4a shows the computed water surface profile at the symmetry plane along the X axis at five different instances, while Figure 4b shows the time series of the water surface elevation at a location close to the wave generating plane. The approximate crest and trough elevations measured in the experiment are also shown. The wave height and the elevations of the crests and troughs vary depending on the time and the location within the computational domain. This is mainly because of numerical diffusion and possibly because of slight reflection of waves from the downstream and side boundaries. The difference in the measured and computed water surface elevations is approximately within the size of a single grid cell.
Figure 4. Water surface elevations without the SGS structure: (a) along the X axis, (b) as a function of time. The wave height, crest, and trough elevations vary with location and time. The scale of this variation is close to the size of a computational grid cell.
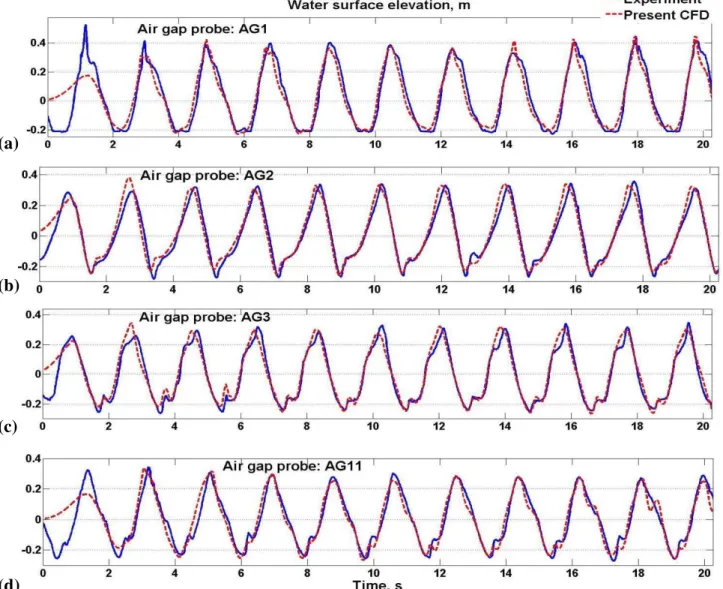
After validating the wave generation and propagation of the nonlinear regular wave in an empty domain, the model structure was then included to investigate the forces, pressures, and overturning moments exerted on the structure and water surface elevations in different locations as compared to the experimental results. Figures 5 shows the location of the water surface elevation and pressure sensors used in this comparison. Note that run-up gauges (denoted RU) measured water surface locations close to the vertical surfaces of the structure, while air gap gauges (denoted AG) measured the water surface elevations below horizontal deck structures (the deck itself was not included in the present model).
Measured air gaps are very well predicted by the present CFD model. This close prediction includes both the extremums and the trends, as seen in Figure 6. Run-up extremums and trends are also very closely predicted by the present CFD model, except for sensor RU2, located near the face of the up-wave leg parallel to the XZ plane. For sensor RU2, the CFD model over-predicts the peak water surface elevations, Figure 7b. The reasons for this discrepancy remain unclear, but measurement errors or small differences in the location of the experimental and numerical sensors are two possibilities.
Note that the largest peak run-up, among the investigated locations, occurs at sensor RU7, located near the up-wave
(a)
face of the down-wave leg. This behaviour is very well predicted by the present CFD model, Figure 7c.
Figure 5. Locations of sensors in the physical model: (a) pressure (b) water surface elevation. CFD results are compared for the sensors shown in red boxes.
Figure 6. Water surface elevations in different locations away from the structure (air gap). Comparison of the present CFD with the experimental measurements.
(a)
(b)
(a)
(b)
(c)
Figure 7. Water surface elevations in different locations very close to the structure (run-up). Comparison of the present CFD with the experimental measurements.
The present CFD results for pressure trends and peaks also agree well with the experimental results. All but one of the pressures sensors considered in this validation are located well above the still water level and are subject to intermittent wetting and sometimes to highly impulsive pressure fluctuations. Note that pressure sensors HW035, HW051, and HW053 measure pressure at midpoints on faces whose normals are along the X axis. There are two exceptions for this close agreement: the pressures sensor HW032, located on one of the faces of the up-wave leg parallel to the XZ plane, where the absolute values are generally over-predicted, Figure 8c; and the pressure at the submerged sensor AB53, where the present CFD result slightly under-predicts the absolute values of extremums, Figure 8f. Note that sensor HW032 is only wetted for a brief portion of each wave cycle and the pressures at sensor HW032 are an order of magnitude smaller than the pressures in most of the other locations. These clues indicate that sensor HW032 is located close to the crest of the run-up in that location, and that small differences in the measured and computed run-up are likely responsible for the relatively large differences in the measured and computed pressure seen in Figure 8c. For confidentiality reasons, we do not release the values used for the normalization of the pressures, forces, and moments.
(d)
(c)
(b)
(a)
Figure 8. Pressure values at different locations on the structure. Comparison of the present CFD with the experimental measurements. Note that noisy experimental readings of the sensors in (b) and (d) do not need adjustments for peak pressures
since recorded pressures at the pressure-free start of the test are zero.
(a)
(b)
(c)
(d)
(e)
(f)
The experimental measurements of the forces exerted by the waves on the structure were based on the readings from four load cells measuring tri-axial force components at each of the four bottom corners of the structure. The location of these load cells is denoted in Figure (5b) by B1X, B1Y, B1Z, etc. The overturning moments were then calculated based on the measured forces and the moment arms measured from a point which is located at the bottom of the domain on the center of the structure along the X axis.
The component of the global force along the X axis is extremely well predicted by the CFD model, Figure 9a. The general trend of the vertical load on the SGS is reasonably well predicted; however, the peak vertical load is slightly under-predicted, Figure 9b. The computed wave-induced global overturning moment on the SGS is also compared with the test results in Figure 9c. The present CFD model closely predicts the minimum values of the moment and over-predicts the peak values. Note that in order to achieve good agreement in overturning moment, magnitude, distribution, and the center of action of the horizontal and vertical forces must match with the experiment; any error in the magnitude and/or the distribution of the forces will potentially contribute to the errors in the prediction of moments. It should be noted that even though great care was taken when conducting the experimental study to ensure that the measurements were accurate and reliable, some of the experimental data may be noisy or have some degree of error/inaccuracy.
Figure 9. Forces and the moment exerted on the structure by the waves.
7 CONCLUSIONS
The OpenFOAM® CFD toolbox was validated for modelling the interaction of extreme waves with a gravity-based structure in intermediate-depth waters. The CFD model was validated against experimental data obtained from a comprehensive and detailed test program previously performed by NRC-OCRE.
A large majority of the experimental measurements were predicted by the present CFD model with a high level of accuracy. The present CFD model proves to be a good option for predicting global loads, local pressures, wave run-up and air gap occurring during the interaction of extreme waves with gravity-based structures.
(a)
(b)
To further improve the CFD modelling, the following research could be pursued: (1) Modelling flow turbulence: The present study involves laminar flow modelling. The � − � turbulence model provided by the OpenFOAM® InterFOAM solver was initially attempted for the present modelling. This attempt was unsuccessful because the model produced an unrealistically high level of wave damping, hence laminar flow modelling was pursued thereafter. Other turbulence models could be examined. (2) Studying the effect of the small gap between the four bottom corners of the structure and the seabed or basin floor: The gap at the bottom corners of the physical model was necessary to ensure that the structure was fully supported on the four corner load cells.
The sensitivity of the global loads to the size of the gap under the horizontal pontoons was investigated in the present CFD study. Results (not shown) revealed that the gap size and its existence slightly affect the vertical component of the force and consequently the numerically predicted moments. The dynamics of the flow in the gap and its effects on the CFD results could be more systematically studied.
The authors intend to further validate the present CFD model with other test cases. More extreme regular waves, irregular waves, and oblique incident waves will be considered as the next step. In addition, the interaction of waves with the complete structure, SGS with its superstructures, decks, risers, and wave deflectors, will be modelled and compared with the physical test results.
ACKNOWLEDGEMENT
The authors would like to gratefully acknowledge the financial support of NRC’s Marine Infrastructure, Energy, and Water Resources Research Program. Hossein Babaei thanks Ron Jerome from Shared Services Canada for his help with the application of the cluster computational facility and the compilation of IH-FOAM.
REFERENCES
Afshar, M.A., 2010. Numerical Wave Generation in OpenFOAM®, Master’s thesis, Chalmers University of Technology, Goteborg, Sweden.
Christensen, E.D., Bredmose, H., and Hansen, E.A., 2005. Extreme Wave Forces and Wave Run-up on Offshore Wind Turbine Foundations, Copenhagen Offshore Wind, Copenhagen, Denmark, pp. 1-10.
Cornett, A., 2011. Hydraulics Model Studies of Extreme Wave Interaction with the Wheatstone Platform, Canadian Hydraulics Center, Report ID: CHC-CTR-0120.
Andrew Cornett, A., Anglin, D., and Elliott, T., 2013. Wave-in-deck Loads for an Intricate Pile-supported Pier and Variation with Deck Clearance, ASME International Conference on Ocean, Offshore and Arctic Engineering, Nantes, France, pp. 1-10.
Higuera, P., Lara, J.L., and Losada, I.J., 2013. Realistic Wave Generation and Active Wave Absorption for Navier-Stokes Models Application of OpenFOAM®, Costal Engineering, 71, pp.102-118.
Jacobsen, N.G., Fuhrman, D.R., and Fredso, J, 2012. A Wave Generation Toolbox for the Open-source CFD Library: openfoam®,
International Journal of Numerical Methods in Fluids, 70, 9, pp.1073-1088.
Lambert, R.J., 2012. Development of a Numerical Wave Tank Using OpenFOAM, Master’s thesis, Coimbra University, Coimbra, Portugal.
Palomares, G.D., 2015. CFD Simulations on a Partially Submerged Cylinder under Regular Waves Using OPENFOAM®, Master’s thesis, University of Stavanger, Norway.
Palemón-Arcos, L., Torres-Freyermuth, L., Chang, K., Pastrana-Maldonado, D., Salles, P., 2014. Modeling Wave-Structure Interaction and its Implications in Offshore Structure Stability, International Ocean and Polar Engineering Conference, Busan, Korea, pp. 613-617.
Paulsen, B.T., Bredmose, H., Bingham. H.B., and Jacobsen, N.G., 2014. Forcing of a Bottom-mounted Circular Cylinder by Steep Regular Water Waves at Finite Depth, Journal of Fluid Mechanics, 555, pp.1-34.
Thanyamanta, W., Herrington, P., Molyneux, D., 2011. Wave Patterns, Wave Induced Forces and Moments for a Gravity Based Structure using CFD, International Conference on Ocean, Offshore and Arctic Engineering, Rotterdam, The Netherlands, pp. 1-11.