HAL Id: insu-00617833
https://hal-insu.archives-ouvertes.fr/insu-00617833
Submitted on 30 Aug 2011
HAL is a multi-disciplinary open access
archive for the deposit and dissemination of
sci-entific research documents, whether they are
pub-lished or not. The documents may come from
teaching and research institutions in France or
abroad, or from public or private research centers.
L’archive ouverte pluridisciplinaire HAL, est
destinée au dépôt et à la diffusion de documents
scientifiques de niveau recherche, publiés ou non,
émanant des établissements d’enseignement et de
recherche français ou étrangers, des laboratoires
publics ou privés.
Geophysical survey to estimate the 3D sliding surface
and the 4D evolution of the water pressure on part of a
deep seated landslide
Thomas Lebourg, Stéphane Binet, Emmanuel Tric, Herve Jomard, S. El
Bedoui
To cite this version:
Thomas Lebourg, Stéphane Binet, Emmanuel Tric, Herve Jomard, S. El Bedoui. Geophysical survey
to estimate the 3D sliding surface and the 4D evolution of the water pressure on part of a deep seated
landslide. Terra Nova, Wiley-Blackwell, 2005, 17 (5), pp.399-406. �10.1111/j.1365-3121.2005.00623.x�.
�insu-00617833�
Geophysical survey to estimate the 3D sliding surface and the 4D
evolution of the water pressure on part of a deep seated landslide
T. Lebourg,1 S. Binet,2 E. Tric,1 H. Jomard1 and S. El Bedoui1
1Labo. Géosciences Azur, UMR 6526, UNSA, 250 r. A. Einstein, 06560 Valbonne, France; 2EA2642 Géosciences: Déformation,
écoulement,Transfert, 16 route de Gray, 25030 Besancon, France Correspondence: Dr Thomas Lebourg,
Labo. Géosciences Azur, UMR 6526, University Nice Sophia-Antipolis, 250 r.
A. Einstein, 06560 Valbonne, France. e-mail: lebourg@geoazur.unice.fr
ABSTRACT
Geophysical surveys were conducted on the very unstable front part of the La Clapiè re landslide in the French Alps (Alpes Maritimes). The electrical resistivity survey was carried out to obtain, for the first time on this deep-seated landslide, 3D information on the slipping surface and the vertical drained faults. Moreover, we planned to follow within time (6 months) the evolution of the saturated zones (presence of gravitational water) and their percolation into the shearing zones. Our 4D results showed the importance of the complex water channelization within the slope and relation to geological discontinuities.
Introduction
The understanding of rupture processes involved in deep seated landslides is difficult for two main reasons. The first reason arises from the difficulty in estimating the mechanical and the hydrogeological behaviours of the whole mountain (heterogeneous structure with discontinuities) which is very different from rock samples studied in the laboratory. This is especially important in the upper part of the slope subject to weathering. The second reason items from the necessity of taking into account both the 3D geometry of the phenomenon and the geological discontinuities affecting the mountain slide. The geometry and the structure can be determined only by geotechnical and/or geophysical methods. Although the geotechnical methods allow one to obtain accurate data which locate precisely the substratum, they have high destructive consequences and provide relatively poor total information. Thus, a global interpretation of the structure of the landslide is not easy and sometimes impossible. This is why geophysical methods are employed such as the electrical resistivity tomography method. The main advantages are that it is possible to measure the soil response along continuous (or pseudo-continuous) profiles at the soil surface. We obtained 2D and 3D imagery of the structure with an identification of different zones that can be associated with lithological and/or hydrological characteristics. Nevertheless, these profiles need validation points and/or supporting informations from several complementary approaches (hydrogeology, tectonics, etc.) or methods (seismic reflection and refraction, gravity). Some recent studies have shown that the resistivity method can reveal very important details of the weathered zone, hydrological system and geological structures of the studied area (Robain et al., 1996; Ritz et al., 1999; Jongmans et al., 2000; Sumanovac and Weisser, 2001). However, this method has been rarely used on deep seated landslides because the surface topography can be very irregular and the studied area difficult to reach.
The purpose of this work was to investigate whether the electrical resistivity tomography could provide accurate information on the weathered zones, the slipping surface, the major discontinuities and on the network of drainage in an unstable part of the La Clapière landslide (Alpes Maritimes, France). Even if numerous studies have been carried out on this site (hydrology, geology, tectonics, topography, etc.), no geophysical studies have been made (Follaci, 1987; Ivaldi et al., 1991; Guglielmi et al., 2000). This is why we decided to undertake, for the first time, such a study by applying this approach to the La Clapière landslide and more precisely to an active unstable part at the front of the landslide, Fig. 1. This area has been chose because it is more accessible than other unstable parts that we can observe on this landslide, for example, between elevations of 1500 and 1720 m in the south-eastern upper part of the slope. Moreover, we propose to show in this article the possibility of carrying out a 3D acquisition of the landslide structure and of following evolution of resistivities through time. As shown in previous study (Lebourg et al., 2003) it is possible to refine the interpretation of the piezometric levels and the principal faults structures (drained faults) within a landslide.
We will show in the first part the results of the interpretation of the electrical tomography in 2D and in 3D and this in correlation with hydraulic data and the geological interpretation. In the second part, data are presented on the temporal evolution of the fifth tomographic profile at three different times (4D measurements, example of profile number 6).
Geographical, geological and hydrogeological setting
The la Clapière landslide is a large unstable slope located in the South East French Alps, about 80 km North of Nice. This landslide, which mobilizes a huge volume (55 · 106 m3) of metamorphic bedrock (Follaci et al., 1999) is developed on the north side of the Tinee Valley and affects a mountain that rises to 3000 m, occurring between 1100 and 1800 m of altitude (Fig. 1). A large rupture has been observed since the beginning of the last century: in 1936 the wrenching at the top of the landslide was already visible. In the 1970s, the movements became more continuous and the site has been monitored since 1982 (Follaci, 1987, 1999 ). The slope of the unstable zone is about 37 _, but is not constant along the profile: the lower part of the slope is steeper than the higher part. The change of gradient corresponds to the limit of extension of quaternary glaciers, as frequently occurs in the alpine valleys. The slope can be separated into three entities: a stable internal zone where the foliation has a strong dip varying from 60_ to 80_ towards the interiors of the slope; a zone dipping towards N030_
approximately 200 m thick where foliation is gradually rotated to the horizontal, and the slipped zone where displacements towards the
valley are important. The surface of the landslide is quite irregular because of numerous rock-fall accumulations, tilted terraces and internal cracks. In this area, the basement is composed of migmatitic paragneisses (Anelle Formation) and orthogneisses (Iglière Formation) having a strong Hercynian foliation. The _La Clapière_ slope itself is affected by a lot of tectonic discontinuities. The major fractures are subvertical N20 faults intersecting the whole slope far away from the active landslide and limiting several parallels, a few hundred metres wide, N20 faults. The displacements measured by the monitoring system have also on average a N20 orientation. Thus, it can be suggested that faults play the role of _guides_ localizing landslip deformations and the water drainage. The main sliding surface is partly outcropping at the foot of the slope. In the rest of the slope, its depth is thought to be approximately 100– 200 m but no geophysical study up to date has been devoted to confirm or to weaken this suggestion. Actually, several parts of the landslide are unstable. The more important is located at the south-eastern upper part of the slope, between elevations of 500 m and 1720 m. In this area we observe a compartment with an estimated volume of 5 millions m)3 which is sliding on a superficial rupture surface and actually overthrusting the remaining of the landslide.
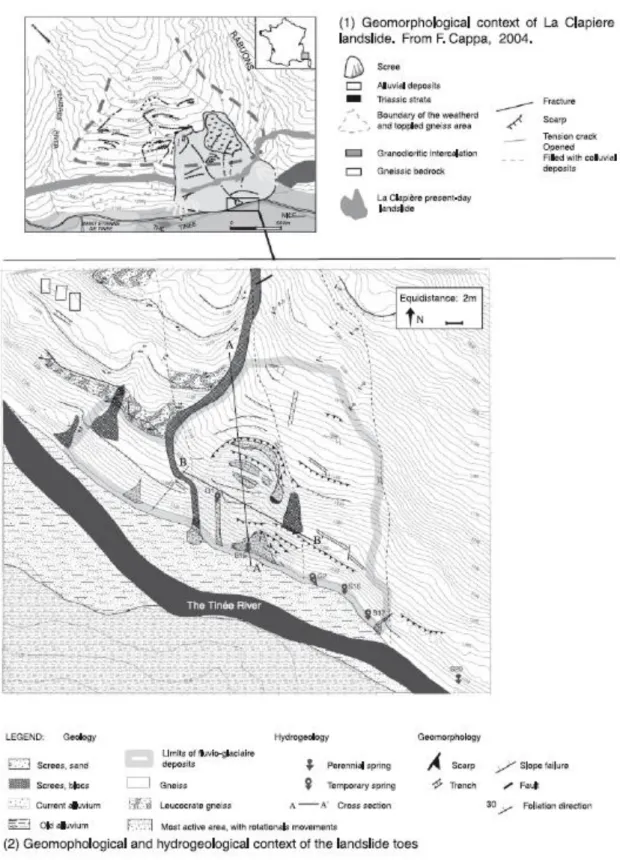
From the hydrogeological point of view, the area is characterized by several springs (perennial and temporary). Some of these springs outflow directly from the basement along faults with various orientations or in the weathered superficial formation. A study of the water chemistry (Guglielmi et al., 2000, 2003) suggests the presence of two main flowpaths in this landslide: (I) deep flow-through fractured gneiss and low permeability Triassic deposits pinched under the foot of the landslide, and (ii) flow through a more permeable fractured basement with a complex flow path. These differences in the landslide drainage can be correlated with the different mechanical behaviours: high speed sliding during snow melting period and slow speeds during low water periods (Follaci, 1999). The foot of the landslide is another very active area where a rotational landslide is taking place in the fluvioglacial deposits on top of the gneiss. This zone is structured by north–south faults, which are a local deviation of the major N20 faults, driving the landslide evolution (Figs 2 and 3).
The hydrogeological behaviour of the rotational landslide (studied with ahydrogeochemical approach) shows the following general characteristics for the La Clapiè re: (i) the perennial springs which drain deep flow from the faults and which diverges in the fluvio-glacial deposits which have much higher permeability; (ii) the temporary springs which drain perched saturated zones in the fluvioglacial deposit (or moraine).
The presence of the perched water table appears to be best developed after periods of high rain, but if these periods of high rain occurs during a period of snow melting, a connection is made between the two water sources, and the potential to trigger the instability becomes more important.
Electrical prospecting and data acquisition
The electrical resistivity tomography is a method widely applied to obtain 2D or 3D high-resolution images of the resistivity variation in a geological system (Griffiths and Barker, 1993; Lebourg and Frappa, 2001). Resistivity contrast analyses make it possible to highlight discontinuities: faults, drainage channel systems and structural features. Drainage contrast induced by the lithology of the system (see geological settings), was measured by making a series of measurements over the entire site at regular time intervals.
The electrical methods and experimental protocol
The experiments measurement were undertaken with a multi-electrode 2D device, using 48 electrodes separated by 2 m. We used systematically a pole–pole and dipole–dipole array, with measurement frequency of 4 Hz for about 900 measurements for each profile. The 2D resistivity data were recorded using the Syscal R1 Plus imaging system (IRIS Instrument, France). The data are classically presented in the form of pseudo-sections (Edwards, 1977), which give an approximate picture of the subsurface resistivity. Inversion of the data is required to obtain a vertical true resistivity section through the underlying structure (Loke and Barker, 1996). The field data depicted as contoured pseudoresistivity sections were inverted with software program RES2DINV written by Loke (1997).Furthermore, the constraints provided by the topographical variations have been incorporated in the inversion processing.
2D and 3D tomographic data and inversed models
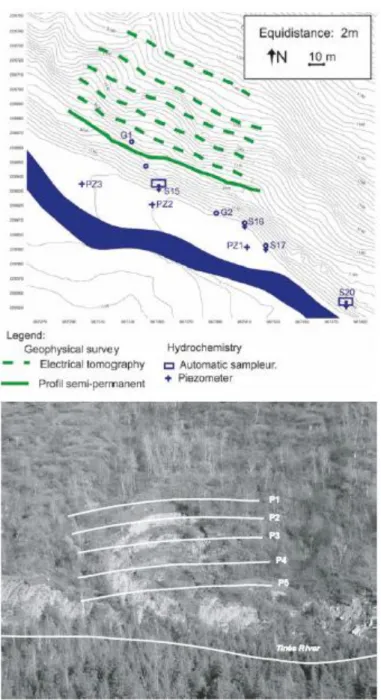
We obtained five parallel electrical tomographic profiles lines in 2D (with topography), of east–west orientation, with a spacing of 10–15 m (Fig. 4). The association of these five parallel profiles allows us to invert the data to obtain a 3D model of resistivity variations in and around the landslide studied. From these data the inversion software RES3D Inv (Loke, 1997) and Slicer Dicer 3.0 were used. Measurement of the evolution of the global resistivity variations was carried out between April 2003 and the middle of July 2003.
Resistivity calibration
The interpretation of electrical tomography profiles in terms of presence or absence of water requires an evaluation and calibration of resistivity values directly on rock samples. These field laboratory measurements allow us to distinguish different ranges of resistivity following the presence or absence of water. Our measurements give us the following indications. Morainic formations (dry or without water) are characterized by large resistivity variability (from about 500 X m to 3000 X m). With water the resistivity decreases strongly with increasing water content and is systematically lower than 50 X m. The gneissic substratum is characterized by high resistivity values (higher than 5000 X m). The weathered zones of this formation show lower resistivity around 2000–3000 X m.
2D results
The five 2D-electrical transverse tomographic profiles obtained in this study are characterized by the same pattern of resistivity. An example is given in Fig. 5a,b. We observe from dipole–dipole array (Fig. 5a) a very large resistivity variability from 20 X m to 5500 X m with a vertical distribution in two zones. The first, between 0 and 2 m of depth shows resistivity values higher than 3000 X m, and below 15 m higher than 700 X m. The second, intermediate in depth (between 2 m and 14 m depth) is characterized by very low resistivity (50 X m). This strong contrast can be associated with the presence of water and suggests a preferential circulation of water. The fact that this low resistivity zone is vertically limited by high resistivity could be interpreted as a perched watertable. Figure 5b also suggests the presence of vertical resistivity discontinuities that could be associated with drained faults. This suggestion is supported by a very good correlation between the interpreted geophysical data and the outcrop observations (Fig. 3).
3D results
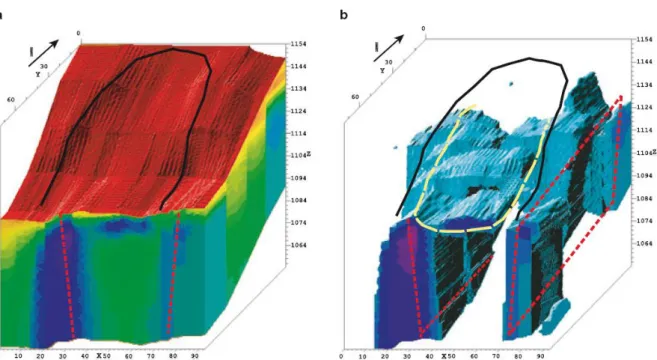
The compilation of the five 2D profiles allowed us to obtain a 3D image of the study area (Fig. 6a,b). Figure 6a presents the same information previously presented as 2D results (large variability of the resistivity, vertical discontinuities,…). This allows the definition of a 3D structure of the landslide and gives information about the spatial distribution of the saturated zone. The data set presented in its entirety in Fig. 6a, was substracting all data more than 50 X m (Fig. 6b). Two significant features appear: the first one corresponds to the upper horizontal distribution whose extension covers the sliding surface. This can be interpreted (as was mentioned previously in the section on 2D results) as the _signature_ of the perched watertable and/or as the sliding surface of the studied landslide (with preferential fluid circulation). The second feature is associated with two vertical draining discontinuities intrasubstratum of which one is apparently less draining that the other. The western discontinuity is very well defined and borders the sliding surface. Hence vertical drained discontinuity seems to be a fluid conduit. The second contact is located slightly further away from the sliding surface (approximately 20 m).
It is not possible to say if these two vertical discontinuities are connected at depth, but they probably contribute to the dynamic behaviour of this part of the landslide. Moreover, our results suggest a connection between the perched watertable and these draining faults. In order to verify the existence of this connection and assess how it evolves through time, resistivity measurements were carried out from April to July 2003 coupled with hydrogeological data.
4D measurements, example of profilenumber 6
Guglielmi et al. (2000) showed that based on chemical compositions of water it was possible to determine the origin of the water flowpath in the La Clapière landslide. Indeed, the change of water chemistry is the result of mass transfer between interstitial fluids and rockforming minerals. These mass transfers depend on several parameters involved in weathering processes (temperature, pH and Redox conditions, mineralogical composition, etc.), but also the residence time of water in contact with the mineral. Thus, during periods of low water flow rates, the water coming from the fractured aquifer has an important residence time, the interactions between water and rock are significant, and the signal is strong (Blavoux and Mudry, 1983). However, during a period of rain or snow melting, the consequent high flow rate results in low chemical signal (Table 1). The flow is concentrated in the main fractures of the rock mass. The residence time is smaller than the low water period and the interactions between rock and water are not sufficient to generate water with a strong chemical content in the springs (Mudry et al., 1994). On the _La Clapière_ slope, a part of this infiltrated water shows the foot of the landslide. It has been demonstrated that the sulphate content is a good marker of the infiltration periods in these instable areas (Compagnon et al., 1997; Guglielmi et al., 2000).
We present here the evolution of one resistivity profile through time (no. 5) compared with the hydrogeological rate of flow which has been evaluated by recording the concentration of chemical contents in spring 15, with measurement every 2 days (Table 1 and Fig. 2). The time evolution of the water content records the piezometric level of the spring which is at the base of the slip. These data were used to obtain Fig. 7a. During the recording period, the three major hydrogeological states during the water content evolution were observed. The first one between 4 April 2003 and 19 May 2003 where the sulphate content is constant around 650 mg L-1. It corresponds to a low water period. Between 19 May 2003 and 4 July 2003 values decrease around 500 mg L-1, linked to the snow melting in the upper part of the slope (>1800 m). The dilution is important (end of the snow superficial storage) and is delayed by about 20 days between the infiltration period and its effect on the springs (Guglielmi et al., 2002). In the study area, this phenomenon creates a deep arrival of water and creates an increase of pressure in the landslide (Cappa et al., 2004). The last period is after the 5 July 2004 for which the values of the resistivity quickly evolve between 450 and 650 mg L)1; the decreases are correlate with the rain events localized on the sliding area, the spring dilution is quasi-instantaneous after the rain event (<1 day) because water fell directly on the sliding area and arrived quickly at the spring. These flows occurred in the upper part of the sliding zone and had little influence on the acceleration of the landslide (Cappa et al., 2004). The west fault is always a draining conduit, the resistivity variations are weak, maybe linked with a regular flow rate of deep water (a spring drains this fault and it is interpreted to be draining deep water). The east fault shows important decrease of resistivity 15 m under the surface. The flood records of 14 July 2003 created flows in the moraine during 4 days (the chemical record shows a dilution over a 4-day period). We propose that the area is draining superficial flow, infiltrating during the rain event. This remark is confirmed by the temporary spring position. Water flows into the moraine and creates a perched water zone. Today, the rotational landslide is not connecting with this drain, but might possibly do so in the future. A connection could occur in the future if the drain has an important water volume to evacuate (Fig. 4).
Conclusion
This study enabled us to carry out a 3D resistivity imagery of a landslide body by taking into account the topography. This study made it possible to highlight the sliding surface and the water draining systems of the studied zone. We observe the presence of two vertical _draining_ structures which feed the perched watertable and the sliding surface. Maximum
displacements of the landslides generally follow the snow melt or after major episodes of rain. The temporal follow- up of a resistivity profile vs. hydrogeological data validate this observation. Broadly this study showed that resistivity measurements are a good indicator to evaluate the connection between the distribution and the temporal evolution of groundwater and geological structures. The comparison with hydrogeological data allowed us to evaluate the temporal evolution of this relation and determine the origin of the water in the soil. However, it is not possible to understand with these data the dynamics and the evolution of this landslide. We need 1-year period for this continuous geophysical acquisition. We can now start to rank the importance of different types of flow (deep water, perched water, etc.) contributing to the potential acceleration of the landslide, and overall model constrains on the stability of this zone.
Acknowledgements
This work is supported by the French INSU SAMOA project and RELIEF Project (French Ministry of Research). We acknowledge too Christopher Wibberley for his English review and comments.
References
Blavoux, B. and Mudry, J., 1983. Séparation des composantes de l_écoulement d_un exutoire karstique a` l’aide des méthodes physico-chimiques. Hydrogeologie, 4, 269–278.
Cappa, F. and Guglielmi, Y., 2004. Hydromechanical modeling of a large moving rock slope inferred from slope levelling coupled to spring long-term hydrochemical monitoring: example of the La Clapiere landslide (Southern Alps, France). J. Hydrol., 91, 67–90.
Compagnon, F., Guglielmi, Y., Mudry, J., Follacci, J-P. and Ivaldi, J-P., 1997. Chemical and isotopic natural tracing of seepage waters in an important landslide: example from La Clapière landslide (Alpes-Maritimes, France). C. R. Acad. Sci. Paris, 325, 565–570.
Edwards, L.S., 1977. A modified pseudosection for resistivity and IP. Geophysics, 42, 1020–1036.
Follaci, J.P., 1987. Les mouvements du versant de la Clapière a` Saint-Etienne de- Tinée (Alpes Maritimes). Bull. Lab. Ponts Chaussées, 150–151, 39–54.
Follaci, J.P., 1999. Seize ans de surveillance du glissement de la Clapière (Alpes Maritimes). Bull. Lab. Ponts Chaussées, 220, 35–51. Griffiths, D.H. and Barker, R.D., 1993. Two-dimensional resistivity imaging and modelling in areas of complex geology. J. Appl. Geophys., 29, 211–226.
Guglielmi, Y. et al., 2002. Hydrogeochemistry: an investigation tool to evaluate infitration into large moving rock masses (Case study of the La Clapière and Séchilienne alpine landslides). Bull. Eng. Geol. Env., 61, 311–324.
Guglielmi, Y., Bertrand, C., Compagnon, F., Follacci, J.P. and Mudry, J., 2000. Acquisition of water chemistry in a mobile fissured basement massif: its role in the hydrogeological knowledge of the La Clapière Landslide (Mercantour massif, southern alps, France). J. Hydrol., 229, 138–148.
Guglielmi, Y., Vengeon, J.M., Bertrand, C., Mudry, J., Follacci, J.P. and Giraud, A., 2003. Hydrogeochemistry: an investigation tool to evaluate infiltration into large moving rock masses (case study of La Clapière and Séchilienne alpine landslides). Bull. Eng. Geol. Environ., 61, 311–324.
Ivaldi, J-P., Guardia, P., Follacci, J-P. and Terramorsi, S., 1991. Plis de couverture en échelon et failles de second ordre associés a` un décrochement dextre de socle sur le bord nord-ouest de l’Argentera (Alpes-Maritimes, France). C. R. Acad. Sci. Paris, série II, 313, 361–368. Jongmans, D., Hemroulle, P., Demanet, D., Renardy, F. and Vanbrabant, Y., 2000. Application of 2D electrical and seismic tomography techniques for investigating landslides. Eur. J. Environ. Eng. Geophys., 5, 75–89.
Lebourg, T. and Frappa, M., 2001. Mesures géophysiques pour l’analyse des glissements de terrain. Revue Française de Géotechnique. Numéro spécial consacré aux mouvements de versant, 96,33–40.
Lebourg, T., Tric, E., Guglielmi, Y., Cappa, F., Charmoille, A. and Bouissou, S., 2003. Geophysical Survey to Understand Failure Mechanisms Involved on Deep Seated Landslides. EGS, Nice.
Loke, M.H., 1997. Res2DINV software user’s manual.
Loke, M.H. and Barker, R.D., 1996. Rapid least square inversion of apparent resistivity pseudosection by a quasi Newton method. Geophys. Prospect., 44, 131– 152.
Mudry, J., Lastennet, R., Puig, J. and Blavoux, B., 1994. Use of natural tracing to understand how an aquifer works. Basic and applied hydrogeological research in French karstic areas. COST 65, Brussels, Belgium, pp. 27–53.
Ritz, J.C., Parisot, S., Diouf, A., Beauvais, F., Dione, F. and Niang, M., 1999. Electrical imaging of lateritic weathering mantles over granitic and metamorphic basement of eastern Senegal, West Africa. J. Appl. Geophy., 41, 335–344.
Robain, H., Descloitres, M., Ritz, M. and Yene Atangana, Q., 1996. A multiscale electrical survey of a lateritic soil system in the rain forest of Cameroon. J. Appl. Geophy., 34, 237–253.
Sumanovac, F. and M. Weisser, 2001. Evaluation of resistivity and seismic methods for hydrogeological mapping in karst terrains. J. Appl. Geophys., 47, 13–28.
Fig. 2 Geological and geomorphological maps of Clapiere landslide and the study area (down part of Clapiere landslide). Terra Nova, Vol 17, No. 5, 399–406 T. Lebourg et al. • Geophysical surveys on La Clapière landslide
Fig. 5 (a) 2D dipole–dipole array profile no. 5; (b) pole–pole array profile no. 5 of the 16 July 2003. Slip surface and/or perched watertable (long dotted lines); draining contacts (medium dotted lines); probable extension of the slip (short dotted lines).
Fig. 6 Landslide limits (continuous feature); slip surface and/or perched watertable (long dotted lines); draining contacts (medium dotted lines). (a) 3D profile obtained from five 2D profiles; (b): same with values of very low resistivity (places probably saturated).
Table 1 Measurements of the composition of the fluid at period of low water content,flood water content and the mean average from March to August 2003
Fig. 7 Comparison of sulphate water content recorded as function of the time (of the 11 April and low profile of the 16 July) (a) in spring 15 with resistivity (log10 resistivity) profile no. 6 obtained at different time. In these profiles the dash line represents discontinuities.