Publisher’s version / Version de l'éditeur:
IEEE, pp. 1-6, 2010-03-19
READ THESE TERMS AND CONDITIONS CAREFULLY BEFORE USING THIS WEBSITE. https://nrc-publications.canada.ca/eng/copyright
Vous avez des questions? Nous pouvons vous aider. Pour communiquer directement avec un auteur, consultez la première page de la revue dans laquelle son article a été publié afin de trouver ses coordonnées. Si vous n’arrivez pas à les repérer, communiquez avec nous à [email protected].
Questions? Contact the NRC Publications Archive team at
[email protected]. If you wish to email the authors directly, please see the first page of the publication for their contact information.
NRC Publications Archive
Archives des publications du CNRC
This publication could be one of several versions: author’s original, accepted manuscript or the publisher’s version. / La version de cette publication peut être l’une des suivantes : la version prépublication de l’auteur, la version acceptée du manuscrit ou la version de l’éditeur.
For the publisher’s version, please access the DOI link below./ Pour consulter la version de l’éditeur, utilisez le lien DOI ci-dessous.
https://doi.org/10.1109/CISS.2010.5464966
Access and use of this website and the material on it are subject to the Terms and Conditions set forth at
Issues in acquiring, processing and visualizing large and detailed 3D
models
Godin, Guy; Borgeat, Louis; Beraldin, J.-Angelo; Blais, François
https://publications-cnrc.canada.ca/fra/droits
L’accès à ce site Web et l’utilisation de son contenu sont assujettis aux conditions présentées dans le site LISEZ CES CONDITIONS ATTENTIVEMENT AVANT D’UTILISER CE SITE WEB.
NRC Publications Record / Notice d'Archives des publications de CNRC:
https://nrc-publications.canada.ca/eng/view/object/?id=d7088230-4f57-4332-b736-57a6263fe41b https://publications-cnrc.canada.ca/fra/voir/objet/?id=d7088230-4f57-4332-b736-57a6263fe41bIssues in Acquiring, Processing and Visualizing
Large and Detailed 3D Models
Guy Godin
Louis Borgeat
J.-Angelo Beraldin
Franc¸ois Blais
National Research Council of Canada Ottawa, Ontario, Canada
Abstract—Modelling from reality using active optical geometric
sensing has been a very active research area in computer graphics and vision for the last twenty years. While most elements of the modelling pipeline have reached maturity and have been adopted in several application sectors, several issues remain, particularly in the modelling of large structures and environments, as well as in the management of large, complex and detailed 3D models. This paper describes some of these issues, and outlines some of the solutions that we have proposed. These methods and ap-proaches, as well as their current limitations, are described using different example applications: a monument (the Erechtheion), a painting (Mona Lisa), and a terrain model.
I. INTRODUCTION
Three-dimensional modelling from reality using active op-tical geometric sensing has been an important focus of ac-tivity in computer vision and computer graphics for the last twenty years, and particularly in the last decade. Since early demonstrations of the complete modelling pipeline (e.g. [1], [2]), most of its components have reached sufficient maturity for adoption in several application areas, particularly in those concerned with the modelling of small and medium size static objects, where several commercial solutions are now in wide use. However several issues remain, ranging from performance improvements to harder issues: challenging scenes due to clutter or material properties, limited automation of certain tasks, dynamic or deformable models, and of particular interest in this paper, difficulties posed by large sites or structures, complexity of surface details, and models with huge triangle count and texture size. Constant improvements in sensing and processor speed have meant that the huge models of a few years ago have now become manageable; nevertheless some applications continue to push the amount of data at a faster rate than the expansion of the pipeline’s capacity. Given that several processing elements in this pipeline exhibit non-linear complexities, issues linked to scene or model size and complexity remain the focus of active research.
This paper describes some of our work in addressing such issues. First, we describe a recent site modelling project, where questions of logistics, sensor selection and deployment, and data validation had to be addressed. We then discuss our cur-rent framework for integrating large amounts of photographic data onto very large models, still a challenging element of the modelling pipeline. We finally describe our solution for the interactive visualization and analysis of huge 3D models.
II. SITE ACQUISITION:THEERECHTHEION
A. Background
In 2007, as part of the project entitled “Development of Geographic Information Systems at the Acropolis of Athens” [3], members of our team worked on the acquisition and mod-eling of the Erechtheion, a monument located on the Acropolis next to the Parthenon. the Erechtheion was completed in 406 B.C.E., and underwent a restoration that ended in 1987. It is a large and complex structure (about 20m×10m×5m) with some walls up to 8m. On the north side, there is a large porch with columns and on the south side, the famous ”Porch of the Maidens” is composed of six draped female figures known as the Caryatids. The capitals and entablature show small carved decorations. The surface of the monument is also covered with some graffiti, cuttings, as well as damage due to gunshots and canonball impacts.
Our contribution to the project required the creation of a richly detailed and accurate 3D model [4]. The goal was to achieve resolution and visual quality of the rendered models that could match what is perceptible by the human eye on a site visit, preferably when at close range. Based on a planning visit in the months preceding the actual scanning work, the team determined the level of details needed for documentation, restoration and visualization applications. The target for the lateral data spacing of the 3D model was set at 5mm in most parts and 1-2mm on the highly detailed areas. The required local depth uncertainty and overall accuracy were estimated at 1mm and 10mm, respectively. To achieve such level of reso-lution and accuracy, validation tests on different 3D imaging systems were conducted at the 3D Imaging Metrology Lab-oratory of the National Research Council of Canada (NRC). Triangulation-based systems were ruled out because of the size of the monument and intrinsic performance characteristics of these systems [5]. Time-of-flight (TOF) laser-based technology offers a better speed/accuracy compromise for large sites such as the Erechtheion.
B. On-site acquisition
The size, setting, and the surface properties of the mon-ument (Fig. 1) posed several challenges. The height of the Erechtheion made coverage from ground level difficult on the top portions of the structure. Obstructions and terrain configuration caused delays and resulted in missed areas. Some
complex parts of the monument caused self-occlusions, and impediments from plants or trees created holes in the coverage. Deciding on the next best view was a time consuming step that could only be tackled by proper planning before the actual work: a preliminary photographic campaign helped the team plan the locations for 3D scanning and calculate the time necessary for the on-site work. Scanning took five tightly scripted days, preceded by 10 full days of site logistics planning.
To satisfy the target requirements of the project, the Surphaser R 25HSX TOF mid-range (i.e. less than 20m)
phase-shift based terrestrial laser scanner (TLS) was selected (see Fig. 1). It can acquire surface data with a noise level of 0.25mm at about 5m range (standard deviation on a coop-erative surface), and accuracy of less than 1mm (according to the manufacturer’s specification sheet). The quoted laser beam footprint could meet the target lateral data spacing. The adequacy of the sensor with regard to the target requirements was verified using artefacts with known dimensional charac-teristics during off-site tests in our 3D Imaging Metrology Lab [6], as well as by on-site work with calibration artefacts. A long-range TOF pulsed TLS, the Leica HDS3000 R, was used
as a complement. It provided the 3D data for missing areas at the top of the structure by placing the scanner on higher grounds and at 80-100 meters away from the monument.
Fig. 1. The Erechtheion with team members using the medium-range laser scanner.
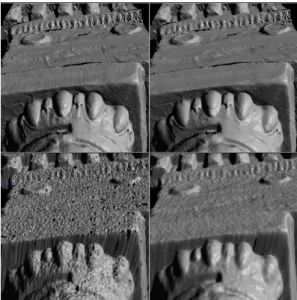
Some on-site stadia tests yielded a length error of the mid-range TLS of less than 1mm (as per specification sheet). With the long-range TLS, the observed errors were much less, i.e. 0.2mm, which is better than the manufacturer’s specifications. The difference between the two TLS was apparent with the local noise test on a small flat surface. The RMS fitting error for the mid-range TLS was estimated at 0.3mm (as per tests [6]) and with the long-range TLS, at 3.2mm. Figure 2 shows a qualitative comparison between the mid-range TLS and long-range TLS that illustrates the ability of the former to capture small details at close range. The long-range TLS showed its ability to acquire hard to reach areas from farther distances. In total, more than 3.2 billion points were acquired.
C. Material interaction and data validation
Due to many restorations, the monument marbles varied in age (from antiquity to very recent), surface finish and amount of surface deposits. Previous studies with triangulation-based scanners showed that laser spot scattering in marble crystals causes an increase in noise while laser penetration causes
Fig. 2. Qualitative comparison of 3D data on a highly detailed surface near a Caryatid. Top left: shaded view a raw 3D image acquired with the mid-range TLS from about 5m. Top right: same rendering after filtering the systematic waves present in the raw scan. Bottom left: shaded view of a raw 3D image acquired with the long-range TLS from about 10m. Bottom right: for comparison purposes, same rendering after filtering the raw scans with a short operator Gaussian-type filter.
systematic shifts: both vary with marble age, erosion, and surface dirt and incrustations [7]. Actual estimated values were obtained with on-site measurements. It was found that, with the TOF-based TLS used here, an apparent systematic offset of about 5-6mm occurred on marble, while the noise level was not affected. The mechanism behind this phenomenon is different from what we found with triangulation-based systems. Empirical compensation techniques were applied in order to reduce the impact of this systematic error on the modelling pipeline. Work is underway to further study and correct this effect.
D. Modelling
The scan data was assembled into a model using a combi-nation of the Polyworks RModeler suite and in-house custom
software. The initial geometric registration was facilitated by the use of targets. A triangular mesh model of 320 million polygons was produced (Fig. 3). It was then transformed into our multi-resolution representation, to be discussed in Section IV, in order to facilitate interactive display as well as manipulation and further processing in the pipeline. The next section will outline the method for mapping the photographic information.
III. PROCESSING:TEXTURE REGISTRATION
A. Context
Constructing large geometric models usually involves the necessity of affixing a comparable, and sometimes larger, amount of texture to the model. Thus, issues faced with the processing of the geometric data also appear at this stage, and often in a compound manner. The textures, especially
Fig. 3. Views of the Erechtheion model.
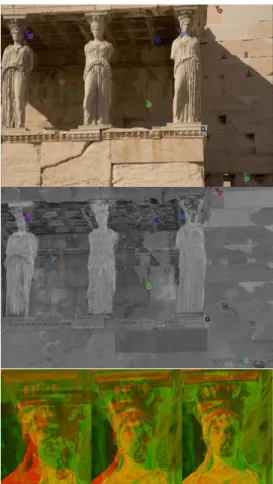
in the case of long distance scanning, are usually obtained from 2D digital photographs, which need to be registered and integrated with the 3D model. The problem of 2D/3D registration can vary significantly between types of applica-tions. If the 2D and 3D sensors are mutually attached in a rigid configuration, we get a good initial pose and camera calibration, but in other cases one must work only from an unstructured set of photographs. We have recently proposed [8] a framework applicable to most situations with minimal user intervention, designed for the specific case of large geometric models and huge texture quantities. It comprises an interactive graphical user environment to rapidly produce a good initial alignment/calibration and to validate results. It also provides a set of automatic tools to iteratively refine an initial estimate until sufficient accuracy is achieved. The implementation of this framework was used for the texturing of the Erechtheion model: difficulties arose not only from the quantity of data, but from large depth differences within single images causing important changes under pose rotation, strong cast shadows, and significant differences in intensity, as seen in Fig. 4.
B. Supervised approach
The interactive registration process that leads to a first pose and camera calibration goes as follows (some steps can be skipped or repeated depending on the quality of the initial alignment). First, the user aligns a semi-transparent version of the 3D model with the image using mouse-based navigation. The model is rendered using a a GPU shader that renders the 3D model using the intrinsic lens parameters, including distortion. A GPU implementation of the SIFT algorithm [9] produces on demand a set of candidate matches between the 3D model and the image rendered as positioned by the user (Fig. 4). The user can then manually select pairs of corresponding points in the SIFT set or select new pairs using the interface to improve the alignment. At any time, a new camera calibration based on the selected matches can be recomputed on request. This is done by running a Levenberg-Marquardt least-squares optimizer on the point pairs to pro-duce a full intrinsic and extrinsic camera calibration or just a new pose, depending on user selection. Projection errors for the points are provided in conjunction with the new rendering
Fig. 4. Registering images on the Erechtheion model: Top: 2D image (triangle SIFT points). Middle: 3D rendering (round SIFT points). Bottom: typical image difference for a small section after mouse (left), quick SIFT (middle), and image based (right) phases.
for rapid evaluation. The user can finally run the automatic alignment procedure at any point to attempt to refine the current alignment or iterate in the interactive process.
The performance of all phases of the processing is not affected by the size of the 3D model since they make use of the same multi-resolution model representation [10] discussed in Sect. IV. We use the intensity of the reflected laser beam directly as the color for the rendered surface. In order to make it easier to align the two images, this intensity value is corrected according to the distance to the sensor and the surface normal, assuming simple models of the photometric properties of the sensor and of the surface reflectance. Figure 5 shows such a corrected intensity image for an overlapping pair of scans in the Erechtheion dataset.
For the automatic phase of the alignment, we use a multi-step hybrid 2D/3D procedure. The 2D part builds on the image processing tools provided in the ITK [11] toolkit. For the 3D, we re-use the Levenberg-Marquardt least-squares optimizer used in the interactive phase to extract a calibration from a given image alignment transformation. In the first step of the process, the 3D model is rendered using the laser intensity. The automated pipeline first determines a rigid alignment between the 2D image and the rendering. A large sample
Fig. 5. Laser intensity in two merged 3D sensor viewpoints of the Erechtheion, before (left) and after (right) correction.
set of correspondence points is taken at random between the images, and a new calibration is computed from those points. The image is re-rendered based on that calibration, and two or more passes of that process are applied, but this time with an affine 2D transform followed by a deformable transform. Image comparison is done using an expectation maximization variation [12] that combines good adaptability for comparison of images of different modalities and a relatively linear search space to avoid falling into local minima, an issue for this kind of application when using this metric [13]. By rendering after each step, we ensure that the rendered part of the 3D model really corresponds to the part visible in the image, but also compensates for limitations in the deformation model used by the registration algorithm.
The 3D model will also contain errors which cannot be compensated only by the camera pose and calibration. Errors will vary depending on the sensor model and principle, but also as a consequence of registration and integration errors between different sensor viewpoints. Therefore, we add a final deformation to the photograph after the last calibration phase to account for spatial errors in the 3D model itself and for residual image deformations not included in the calibration model. Image data can then be texture-mapped onto the model or sampled to produce color-per-vertex data [10].
The 3D model on which the data was applied is composed of 350 million polygons. For the first 200 photographs, alignment followed the manual procedure, with mouse alignment being sufficient to seed the automatic process in some cases, but requiring selecting a few points to improve the initial pose in others. A frequent case encountered with those images was that the SIFT algorithm would select pairs that were concentrated in too small an area of the image, and the user would need to select one or two extra pairs to get a good calibration before launching the automated process. Even in this more difficult context, this approach did allow an expert operator to accelerate the processing of data by at least an order of magnitude. Figure 4 shows typical results for an image. Most difficulties in alignment are caused by shadows and occlusions. Work is still under way to improve the automated alignement component and the integration of the photographs.
IV. VISUALIZATION:REAL-TIME DISPLAY AND ANALYSIS
A. Multi-resolution for large mesh models
As 3D models increase in size and improve in detail and quality, there is a growing need for the development of more
advanced tools to visualize and analyze those datasets to be able to access all the valuable knowledge they contain: data must not only be displayable at various scales under various representations without creating any misleading artefacts, but it often needs to be transformed for visual and computational analysis. In spite of the improvement in graphics performance of off-the-shelf computers, the size of 3D models and their associated texture continues to grow at a faster rate, thus requiring advanced methods for manipulation and rendering
We have developed a general technique to interactively display very large scanned surface datasets [10] that can easily handle mesh models composed of hundreds of millions of triangles and tens of gigabytes of texture data. The method is an extension of view-dependent hierarchical levels of detail (LOD), where we use geomorphing to ensure temporal and spatial continuity between the different levels of detail and across the entire model. This rendering technique combines several important advantages. By using static pre-optimized geometry units as the primitives for the view-dependent com-putations, we strike a better balance between GPU and CPU usage and can benefit from on-GPU geometry and texture caching and from better use of the GPU vertex cache. We also minimize the visual artefacts associated with the view-dependent transformation of the displayed data through the use of geomorphing between levels of the hierarchy and adjacent patches. All the geomorphing being performed on the GPU, CPU is only required to cull the coarse hierarchical level-of-detail structure as with any scene graph, and to pre-fetch data during navigation. The method is particularly well adapted to models that contain massive amounts of associated image texture, such as in the case of the Erechtheion. The pre-processing can in these cases be optimized to adapt the created hierarchical structure to minimize the amount and size of texture units. Finally, one of the key aspects of this technique is that, when the maximum level of resolution is reached, we display the original data from the high-resolution model. Further details are found in [10], [14].
B. Interactive analysis
Current GPUs provide significantly more control on the image generation pipeline than their earlier counterparts. They are also significantly more powerful and can perform much more computations in real time. We already take advantage of their power and flexibility to accelerate the multi-resolution rendering. But one can also harness this additional power to further process the rendered multi-resolution model by im-plementing real-time transformations on the resulting images. Careful design of these transformations can yield powerful yet efficient analytical tools that naturally adapt to the rendering resolution and exploit the full precision of the data.
A first example of this type of filters is a high-pass filter on a grey coded representation of the depth from a chosen point of view. Such a filter is useful to enhance local depth variations in the models. This is achieved by first rendering the multi-resolution model from the current chosen viewpoint, using the same interpolation between levels of detail as described earlier
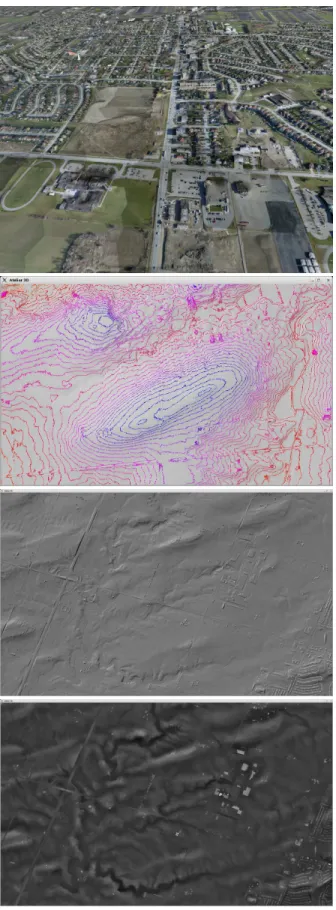
Fig. 6. From the top: Textured rendering of a dataset composed of 103
million LiDAR range samples and 6800 digital photographs. Another area of the model rendered using interactive contour lines. Two bottom images: a third area of the model first rendered using classic OpenGL shading with a raking light source, then rendered using monochrome relative depth rendering.
when processing the vertices. The main difference is that the target buffer is a single channel 32-bit float buffer. At the end of the vertex processing stage, we pass the position of the vertex in the observer’s reference frame as a full floating point value to the rasterizer, so that we get a precise depth value for each candidate fragment in the next stage, without the non-linear resolution distribution of the depth buffer under perspective transformation. The first pass yields a 32-bit depth image of the 3D data from the chosen observer viewpoint. The second step is to create a representation of the overall shape in the form of a second float image obtained by convolving the depth image with a large Gaussian blur kernel, implemented on GPU [15] by filtering sequentially with a 1-D kernel along both image axes, resulting in fewer texture fetches. In the following step, we simply subtract the original image from the filtered one in a new rendering pass. We now only need to remap those small variations into color values for display.
A second useful transformation shows the usual contour lines representation that is at the basis of 2D cartographic representations of terrain data. Again, implementing it on the GPU in a multi-resolution context comes with many advantages, the most important one being that computations are only performed at the visible resolution for every frame, therefore at very low cost. A variation of this technique is the color coding frequently used in scientific visualization where the range of values is mapped onto a full color spectrum.
The terrain model in Fig. 6 was produced from data gathered by TerraPoint Inc., using their proprietary airborne ALMIS350 LiDAR system and a digital camera. It is com-posed of 103 million data points and texture from 6800 photographs each at a resolution of 4 Mpixels. The resulting model can be displayed interactively on high-end workstations or portable computers, and various enhancement filters can be applied. For example the hydrographic network is clearly visible using the relative depth technique described above. The contour lines are also an obvious representation for such a dataset. The user can interactively manipulate the 3D model as well as the parameters of the filters.
As part of the largest scientific examination ever conducted on the Mona Lisa [16], we scanned and modelled the obverse (front), reverse and sides of the wood panel. We used a enhanced version [17] of NRC’s prototype high-resolution polychromatic 3D laser scanner[18], which simultaneously acquires 3D and color measurements for each sampled point. The scans were assembled into a 333 million polygon color-per-vertex model, with higher resolution (average sampling of 60 µm) on the obverse surface. The 3D modeling of the Mona Lisa aimed at documenting the state of the painting and at providing complementary information for the analysis of the pictorial layer, concerning both conservation issues and indications relative to the painting technique. Specific transformation techniques were required to enhance features of interest, such as wood grain, or measure local variations of the pictorial layer [19]. Figure 7 shows the 3D model with some of the processing results of interest to conservators and art historians.
Fig. 7. Aspects of the Mona Lisa: the global curvature of the wood panel from level curves; wood grain structure using the high-pass filter; pictorial layer depth, and restored areas on the back of the panel.
V. CONCLUSION
Important research issues still arise in the acquisition, processing and visualization of large, detailed and complex 3-D models. Our recent work has addressed some of them, and this paper outlines solutions, as well as work in progress on different components along the complete modelling and visualization pipeline. Further work is under way in order to characterize the performance and precision of the modelling chain, as well as in increasing the level of automation of key steps such as texture registration.
ACKNOWLEDGMENTS
We thank our colleagues Luc Cournoyer, Sabry El-Hakim, Philippe Massicotte, Michel Picard, and Guillaume Poirier for their contribu-tions to the research and projects described in this paper.
The Erechtheion project is part of Development of Geographic Information Systems at the Acropolis of Athens’, financed by the EU and the Government of Greece and supervised by the Acropolis Restoration Service, Hellenic Ministry of Culture. The partners are Elliniki Photogrammetriki Ltd (Elpho) and Geotech O.E., Athens; ETH (Swiss Federal Institute of Technology), Zurich; the National Research Council, Canada; the Institute for Mediterranean Studies, and the Foundation for Research & Technology (FORTH), Rethymno, Crete, with external co-operation from Leica Geosystems, Switzer-land, Basis Software Inc, USA, and Innovmetric Software Inc.
The Mona Lisa Project was realised as part of a study led by the Centre de recherche et de restauration des mus´ees de France at the request of the Paintings Department of the Louvre Museum.
The airborne terrain data was kindly provided by TerraPoint Inc.
REFERENCES
[1] M. Soucy, G. Godin, R. Baribeau, F. Blais, and M. Rioux, “Sensors and algorithms for the construction of digital 3-D colour models of real objects,” in Proceedings International Conference on Image Processing
(ICIP96), vol. II, Sep. 1996, pp. 409 –412.
[2] F. Bernardini and H. Rushmeier, “The 3D model acquisition pipeline,”
Computer Graphics Forum, vol. 21, no. 2, 2002.
[3] D. Moullou et al., “Recording, modeling, visualisation and GIS ap-plications development for the Acropolis of Athens,” in Proceedings
XXI Congress International Society for Photogrammetry and Remote Sensing, Beijing, China, Jul. 2008, pp. 1073–1076.
[4] S. El-Hakim, J.-A. Beraldin, M. Picard, and L. Cournoyer, “Surface reconstruction of large complex structures from mixed range data the Erechtheion experience,” in Proceedings XXI Congress International
Society for Photogrammetry and Remote Sensing, Beijing, China, Jul.
2008, pp. 1077–1082.
[5] S. El-Hakim and J.-A. Beraldin, “Sensor integration and visualization,” in Applications of 3D Measurement from Images (Fryer, Mitchell &
Chandler, eds.). Whittles Publishing, UK, 2007, pp. 259–298. [6] J.-A. Beraldin, F. Blais, S. F. El-Hakim, L. Cournoyer, and M. Picard,
“Traceable 3D imaging metrology: evaluation of 3D digitizing tech-niques in a dedicated metrology laboratory,” in Proceedings 8th Optical
3D Measurement Techniques Conference, Zurich, Switzerland, Jul. 2007,
pp. 310–318.
[7] G. Godin, J.-A. Beraldin, M. Rioux, M. Levoy, L. Cournoyer, and F. Blais, “An assessment of laser range measurement on marble sur-faces,” in Proceedings 5th Optical 3D Measurement Techniques
Confer-ence, Vienna, Austria, Oct. 2001, pp. 49–56.
[8] L. Borgeat, G. Poirier, J.-A. Beraldin, G. Godin, P. Massicotte, and M. Picard, “A framework for the registration of color images with 3D models,” in 16th IEEE International Conference on Image Processing
(ICIP2009), Nov. 2009, pp. 69 –72.
[9] C. Wu. (2009, Dec.) SiftGPU: A GPU implementation of scale invariant feature transform (SIFT). [Online]. Available: http://www.cs.unc.edu/ ccwu/siftgpu
[10] L. Borgeat, G. Godin, F. Blais, and C. Lahanier, “GoLD: Interactive display of huge colored and textured models,” in Proc. of SIGGRAPH
2005, Los Angeles, California, Jul. 31 - Aug 4 2005.
[11] “The Insight Segmentation and Registration Toolkit,” http://www.itk.org. [12] D. Mattes, D. R. Haynor, H. Vesselle, T. K. Lewellyn, and W. Eubank, “Nonrigid multimodality image registration,” in SPIE Conference Series, vol. 4322, Jul. 2001, pp. 1609–1620.
[13] C. Hantak and A. Lastra, “Metrics and optimization techniques for registration of color to laser range scans,” in Proceedings 3D Processing,
Visualization and Transmission Conference (3DPVT2006), Washington,
DC, USA, 2006, pp. 551–558.
[14] L. Borgeat, G. Godin, F. Blais, J.-A. Beraldin, P. Massicotte, and G. Poirier, “Visualizing and analyzing large and detailed 3D datasets,” in Proceedings of The International Workshop on 3D Virtual
Recon-struction and Visualization of Complex Architectures (3D-ARCH’2007),
Jul. 2007.
[15] R. Fernando, GPU Gems: Programming Techniques, Tips and Tricks for
Real-Time Graphics. Pearson Higher Education, 2004.
[16] J.-P. Mohen, M. Menu, and B. Mottin, Mona Lisa: Inside the Painting. Harry N. Abrams, 2006.
[17] F. Blais et al., “Ultra high-resolution 3D laser color imaging of paint-ings: the Mona Lisa by Leonardo da Vinci,” in The 7th International
Conference on Lasers in the Conservation of Artworks, Madrid, Spain,
Sep. 2007.
[18] R. Baribeau, M. Rioux, and G. Godin, “Color reflectance modeling using a polychromatic laser range sensor,” IEEE Transactions on Pattern
Analysis and Machine Intelligence, vol. 14, no. 2, pp. 263 –269, Feb.
1992.
[19] L. Borgeat, G. Godin, P. Massicotte, G. Poirier, F. Blais, and J.-A. Beraldin, “Visualizing and analyzing the Mona Lisa,” IEEE Computer