Publisher’s version / Version de l'éditeur:
Vous avez des questions? Nous pouvons vous aider. Pour communiquer directement avec un auteur, consultez la première page de la revue dans laquelle son article a été publié afin de trouver ses coordonnées. Si vous n’arrivez pas à les repérer, communiquez avec nous à [email protected].
Questions? Contact the NRC Publications Archive team at
[email protected]. If you wish to email the authors directly, please see the first page of the publication for their contact information.
https://publications-cnrc.canada.ca/fra/droits
L’accès à ce site Web et l’utilisation de son contenu sont assujettis aux conditions présentées dans le site LISEZ CES CONDITIONS ATTENTIVEMENT AVANT D’UTILISER CE SITE WEB.
Proceedings of the International MultiConference of Engineers and Computer
Scientists 2008 (IMECS'08) at the 2008 IAENG International Conference on
Bioinformatics (ICB'08), March 19-21, 2008, Hong Kong, China, 2008
READ THESE TERMS AND CONDITIONS CAREFULLY BEFORE USING THIS WEBSITE. https://nrc-publications.canada.ca/eng/copyright
NRC Publications Archive Record / Notice des Archives des publications du CNRC :
https://nrc-publications.canada.ca/eng/view/object/?id=47384da9-c7d2-41af-a3ef-13a49f0b3202
https://publications-cnrc.canada.ca/fra/voir/objet/?id=47384da9-c7d2-41af-a3ef-13a49f0b3202
NRC Publications Archive
Archives des publications du CNRC
This publication could be one of several versions: author’s original, accepted manuscript or the publisher’s version. / La version de cette publication peut être l’une des suivantes : la version prépublication de l’auteur, la version acceptée du manuscrit ou la version de l’éditeur.
Access and use of this website and the material on it are subject to the Terms and Conditions set forth at
Guide to Threshold Selection for Motif Prediction Using Positional
Weight Matrix
National Research Council Canada Institute for Information Technology Conseil national de recherches Canada Institut de technologie de l'information
Guide to Threshold Selection for Motif
Prediction Using Positional Weight Matrix *
Pan, Y., Phan, S.
March 2008
* published in the Proceedings of the International MultiConference of Engineers and Computer Scientists 2008 (IMECS'08) at The 2008 IAENG International Conference on Bioinformatics (ICB’08). March 19-21, 2008. Hong Kong, China. NRC 49881.
Copyright 2008 by
National Research Council of Canada
Permission is granted to quote short excerpts and to reproduce figures and tables from this report, provided that the source of such material is fully acknowledged.
Youlian Pan and Sieu Phan
Guide to Threshold Selection for Motif
Prediction Using Positional Weight Matrix
Institute for Information Technology, National Research Council Canada
1200 Montreal Road, Ottawa, Ontario, Canada K1A 0R6
e-mails: [email protected]; [email protected]
Key words:
Sequence motif
Positional Weight Matrix
Log-odd score
Statistical expectation
Goodness-of-fit
Correspondence:
Youlian Pan
Institute for Information Technology
National Research Council Canada
1200 Montreal Road,
Ottawa, Ontario
Canada K1A 0R6
e-mail:
[email protected]
Phone: 1-613-993-8556
Fax : 1-613-952-0215
Conference presented at:
1
Abstract—In biological sequence research, the positional
weight matrix (PWM) is often used to search for putative transcription factor binding sites. A log-odd score is usually applied to measure the closeness of a subsequence to the PWM. However, the log-odd score is motif-length-dependent and thus there is no universally applicable threshold. In this paper, we propose an alternative scoring index (G) varying from zero, where the subsequence is not much different from the background, to one, where the subsequence fits best to the PWM. We also propose a measure evaluating the statistical expectation at each G index. We investigated the PWMs from the TRANSFAC and found that the statistical expectation is significantly ( p < 0.0001) correlated with both the length of the PWMs and the threshold G value. We applied this method to two PWMs (GCN4_C and ROX1_Q6) of yeast transcription factor binding sites and two PWMs (HIC1-02, HIC1_03) of the human tumor suppressor (HIC-1) binding sites from the TRANSFAC database. Finally, our method compares favorably with the broadly used Match method. The results indicate that our method is more flexible and can provide better confidence.
Index Terms— Sequence motif, Positional Weight Matrix,
Log-odd score, Statistical expectation, Goodness-of-fit.
I. INTRODUCTION
The positional weight matrix (PWM) has been a popular method in modeling the transcription factor binding sites (TFBSs). A set of experimentally verified promoter sequences known to be bound by a transcription factor (TF) are collected and aligned. The frequency of each nucleotide A, C, G, or T at each column of the alignment is calculated in the matrix (see e.g. [1]). Once a PWM is constructed, it can be used to search for additional sites that are possibly bound by the TF. The match between a sequence and a PWM is usually described by a log-odd score. A subsequence is considered as a putative TFBS when its score passes a given threshold. Many PWM-based motif search tools have been developed over the past decades. These include Match [2], P-Match [3], MatInspector [4] and GAPWM [5]. Similarly, PWM methods could be used to find de novo motifs through identification of over represented motifs in the sequence dataset. For example, the expectation maximization methods
Manuscript received October 31, 2007. This work was supported in part by Genomics and Health Initiative at National Research Council Canada. This is National Research Council publication NRC 49881.
Both authors are with the Institute for Information Technology, National Research Council Canada, 1200 Montreal Road, Ottawa, Ontario, Canada K1A 0R6 (YP: corresponding author: 613-993-8556; fax: 613-952-0215; e-mail: youlian.pan@ nrc.ca. SP: e-mail: [email protected]).
were implemented in MEME [6]-[7]; a combination of expectation maximization with stochastic sampling was implemented in Gibbs Sampling family, such as CONSENSUS [8], AlignACE [9], motifSampler [10], and BioProspector [11].
As a research result from various laboratories around the world over the past few decades, many PWMs are available in public databases, such as TRANSFAC [12] and JASPAR [13]. These PWMs are extensively used to search for putative motif instances and the PWM-based methods are reviewed in [14]-[16]. The PWM-based methods commonly assume that the positions in a motif are mutually independent. A log-odd score is calculated for each base of a motif instance regardless of the content of the neighboring bases.
The main challenge in PWM-based methods is the determination of a threshold score. The score of a motif instance is usually the summation of the score on each base. Thus it is dependent on length of the motif and PWM models. There is no universally applicable threshold that can be used in PWM-based methods and this has been a major drawback of PWM-based methods. Several research groups have attempted solving the problem. For example, Match [2] takes the maximum and minimum scores and scales them between 0.00 and 1.00 for the entire PWM space as well as the five consecutive nucleotides whose maximum score is the best in any region of the PWM space. Hertzberg et al. [17] introduced a probability measure in predicting TFBSs. However, there is no significant breakthrough in this area. This paper proposes an alternative scoring index for PWM-based methods in the prediction of TFBSs. Each scoring index is associated with a measure of statistical expectation to indicate its significance. In the remainder of the paper, we first describe the algorithm, and then investigate yeast and vertebrate PWMs from TRANSFAC. Next, we provide application cases of two yeast PWMs to search the motif instances in yeast genome (Saccharomyces cerevisiae) and compare this method with Match [2] using 16 yeast genes. Finally, we use two human PWMs to search motifs in cancer-related genes.
II. ALGORITHMS
A. Goodness-of-fit between a subsequence and a PWM
The input to the algorithm is a subsequence S and a PWM, and the output is a goodness-of-fit index. The log-odd score,
V, of S (s1 s2 …sw) is:
∏
= = = = w i b i i m w i b i i m s p s p s p s p V 1 1 ) ) ( ) ( log( ) ) ( ) ( log( , si∈{A,C,G,T} (1)Guide to Threshold Selection for Motif
Prediction Using Positional Weight Matrix
2 where i is the location of the nucleotide si in S, w is the length
of S, pm(si) is the probability of the nucleotide si at position i
based on the PWM and pb(si) is the probability of the
nucleotide si based on the background. For simplicity, a
default background model is defined with pb(A) = pb(C) =
pb(G) = pb(T) = 0.25. However, a data specific background
model can be generated by enumerating the frequency of each base in the sequence dataset. A small value called pseudo-count is usually added to each pm(si) to avoid having
pm(si) = 0, which could result in (1) underflow.
The best possible log-odd score, Vmax, from (1) is the
summation of the best log-odd value at each column of the PWM: = = w i b i i m s p s p V 1 ,max max , max ) ) ( ) ( log( (2)
where si,max is the nucleotide of highest frequency at position i.
A subsequence S with V = Vmax means S is the best fit to the
PWM, which means S is most likely a TFBS that the PWM specifies; while a V = 0 indicate S is identical to the background, which means S is very unlikely to be a TFBS that the PWM specifies. Therefore, we define the goodness-of-fit (G) between S and the PWM as:
max
V
V , while V 0
0, while V < 0 (3) The value of G is between 0.00 and 1.00 since V Vmax and is
independent of pattern length. From the G value, one could easily tell the confidence level of the putative TFBS that is found by a PWM regardless of the length of the subsequence.
B. Measurement of statistical expectation
After receiving a goodness-of-fit index, it is necessary to know the statistical expectation of such index so that we can tell how conserved is the motif instance found, namely how significant is a log-odd score. Unlike the goodness-of-fit index described in the previous section, the statistical expectation is closely related with the length (number of columns) as well as the noisiness of the PWM. For example, a matrix M of length w would theoretically have 4w variants. Each motif variant has a statistical expectation of 4-w to appear in a sequence S of length w. For a given threshold, assume n motif variants of M satisfying the threshold, thus the statistical expectation of M appearing on S is 4-w × n and the statistical expectation of M appearing on a promoter sequence of length
L is 4-w × n(L-w+1).
III. APPLICATIONS
We applied the above method to generate the probability function for each of the 585 vertebrate PWMs and 56 yeast PWMs from TRANSFAC database [12]. The background probabilities are generated from enumeration of the nucleotides in all known genes’ promoters of each species. We also searched for the putative binding sites of yeast transcription factors GCN4 and ROX1 using the TRANSFAC yeast PWMs, GCN4_C and ROX1_Q6, respectively. Finally, we searched for putative binding sites of the human tumor
suppressor HIC-1 using the two vertebrate PWMs, HIC1_02 and HIC1_03, from TRANSFAC. In order to keep simplicity in calculation, no pseudo-count is applied in these applications. Therefore, all subsequences that contain a nucleotide with a 0.00 probability in the PWM are not considered in this study.
A. Yeast data
Among the available data, the yeast genome (Saccharomyces cerevisiae) is best studied. From the TRANSFAC database (Version 10.4), we retrieve two PWMs (GCN4_C and ROX1_Q6), which model the binding sites for transcription factors GCN4 and ROX1, respectively. The promoter sequences of all 5769 genes from SGDgene table were retrieved from the UCSC Genome Browser (http:// genome.ucsc.edu/). The promoter sequences contain 600 bp upstream of the transcription start site (TSS). In order to validate the result, we retrieved the known (documented) associations between the transcription factors and their respective target genes from YEASTRACT database [18].
We searched the promoter sequences by using the two PWMs and setting different thresholds of G values ranging from 0.40 to 1.00. At each threshold, we considered a putative association between a TF and a target gene if a putative binding site of the TF is found in the promoter sequence of this gene. The result of such putative association is validated by known associations obtained from the YEASTRACT database.
For the purpose of comparison, we apply the terminology of Sensitivity (Sn) and Positive Predictive Value (PPV) as defined in [19]-[20]. Sensitivity is the proportion of all known associations (TP+FN) that are accurately predicted (TP); and the Positive Predictive Value is the proportion of predicted associations (TP+FP) that are true (TP). Traditionally,
Specificity (proportion of negatives that are predicted false) is used in evaluation of a method. In genomic sequences, true negative (TN) is predominately higher than any of FP, TP or
FN. Specificity as defined in [19]-[20] would not be able to reveal signals effectively as its value would be very close to 1.00 in almost all instances [21]. Therefore, we adopted the
Positive Predictive Value instead of Specificity in this study so that the signals can be comparable.
B. Human cancer genes data
We retrieved 406 cancer gene entries from the CancerGenes Resequencing Resource [22]. These 406 entries represent 385 distinct genes. We retrieved promoter sequences of these cancer genes from the UCSC Genome Browser (http://genome.ucsc.edu/). The promoter sequences cover the range of 1000 bp upstream and 200 bp downstream of TSS with a total length of 1200 bp. We retrieved two PWMs (HIC1-02, HIC1_03) for a tumor suppressor gene HIC-1 from the TRANSFAC database and searched the promoter sequences for putative TFBSs that fit the two PWMs over the threshold between 0.40 and 0.90. There is no similar database to YEASTRACT for known associations between the transcription suppressor and its target genes in the human genome.
3 IV. RESULTS
A. Vertebrate and yeast PWMs
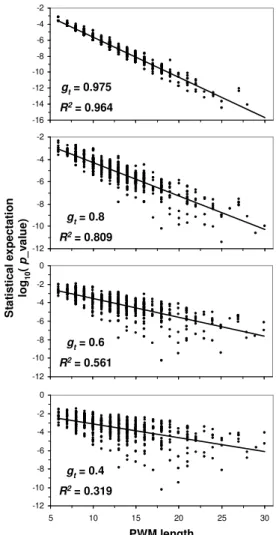
We retrieved 585 vertebrate PWMs and 56 yeast PWMs from TRANSFAC and calculated the log-odd score based on (1) and G value based on (3) for all motif variants in each PWM space. For a given threshold gt, we are interested to
know the probability of finding a motif variant having a G value higher than gt. This probability is called p_value
associated with the given gt. Theoretically, we calculate the
probability density function, f(g), for the entire PWM space. The probability distribution function, F(g), is then determined by
F
g
=
gf
d
0
(
)
)
(
τ
τ
(5).And the p_value is determined by
p_value(g) = 1 - F(g) (6). Fig. 1 shows the p-value function of the human PWM PAX2_01. With knowledge of p_value, we can now select a proper threshold with a desired level of confidence. This in turn suggests that for every PWM, we establish an accompanying p_value table. The G threshold is selected from the table according to the desired confidence level.
The establishment of the p-value function for a lengthy PWM is computationally expensive. For example, a PWM of 24 columns would need more than 100 days to complete the calculation by a PC in current state of technology. To alleviate this problem, we devised a random sampling scheme to perform the calculation. Intuitively,
) ( ) (g
lim
f g f n N n→ = (7) where n is the number of sampling variants from the entire PWN space of N = 4w (w is the length of PWM) and fn(g) isthe density function obtained by evaluating the G value of (3) over the selected n variants. We verified that our random sampler and ensured distinct motif variants with no single repeat within the PWM space (4w space) before it was used for random sampling. The p_value functions based on random sampling were verified to be technically identical as if the entire PWM space is sampled as long as sampling size was over 410 (Fig. 1). It is feasible to perform exact calculation for PWM of w <= 18. For a PWM of w > 18, we applied the random sampling scheme to perform the computation and the sample size is 414. The result indicates that the statistical
expectation is highly correlated (p < 0.0001) with both PWM length (w) (Fig. 2) and threshold G values (Fig. 3).
B. Yeast data
By decreasing the threshold, more known associations between TFs and their targets are found by the corresponding PWM as reflected by the Sensitivity values (Fig. 4). However, the number of false positives increases as reflected by the
Positive Predictive Values. Based on the p_value, users will be able to find a corresponding threshold. For example, the threshold (p 0.05) should be 0.87 for GCN4_C and 0.85 for
0.00 0.02 0.04 0.06 0.08 0 0.2 0.4 0.6 0.8 1 Similarity p _ v a lu e Exact P12 P10 P8 P6 Goodness of fit (G) S ta ti s ti c a l e x p e c ta ti o n ( p _ v a lu e ) 0.00 0.02 0.04 0.06 0.08 0 0.2 0.4 0.6 0.8 1 Similarity p _ v a lu e Exact P12 P10 P8 P6 Goodness of fit (G) S ta ti s ti c a l e x p e c ta ti o n ( p _ v a lu e )
Fig. 1. p_value function of human PWM PAX2_01. Exact:
all instances in the PWM space are evaluated, Px: 4x
instances from the PWM space are sampled.
-16 -14 -12 -10 -8 -6 -4 -2 5 10 15 20 25 30 length p ro b a b il it y -12 -10 -8 -6 -4 -2 5 10 15 20 25 30 length p ro b a b il it y -12 -10 -8 -6 -4 -2 0 5 10 15 20 25 30 length p ro b a b il it y -12 -10 -8 -6 -4 -2 0 5 10 15 20 25 30 length p ro b a b il it y S ta ti s ti c a l e x p e c ta ti o n lo g1 0 ( p _ v a lu e ) PWM length gt= 0.8 R2= 0.809 gt= 0.6 R2= 0.561 gt= 0.975 R2= 0.964 gt= 0.4 R2= 0.319 -16 -14 -12 -10 -8 -6 -4 -2 5 10 15 20 25 30 length p ro b a b il it y -12 -10 -8 -6 -4 -2 5 10 15 20 25 30 length p ro b a b il it y -12 -10 -8 -6 -4 -2 0 5 10 15 20 25 30 length p ro b a b il it y -12 -10 -8 -6 -4 -2 0 5 10 15 20 25 30 length p ro b a b il it y S ta ti s ti c a l e x p e c ta ti o n lo g1 0 ( p _ v a lu e ) PWM length gt= 0.8 R2= 0.809 gt= 0.6 R2= 0.561 gt= 0.975 R2= 0.964 gt= 0.4 R2= 0.319
Fig. 2. p_value of 585 vertebrate PWMs over various G values.
The length factor (L-w+1) has not been incorporated into these
p_values. For a sequence of length L, these p_values have to multiply the values by a factor of L-w+1.
-7 -5 -3 -1 0 0.2 0.4 0.6 0.8 1 Threshold lo g p ro b a b il it y S ta ti s ti c a l e x p e c ta ti o n lo g1 0 (p _ v a lu e ) Threshold (gt) -7 -5 -3 -1 0 0.2 0.4 0.6 0.8 1 Threshold lo g p ro b a b il it y S ta ti s ti c a l e x p e c ta ti o n lo g1 0 (p _ v a lu e ) Threshold (gt)
Fig. 3. Relationship between the statistical expectation and threshold gt value of five vertebrate PWMs (OCT_Q6, OCT1_Q5_01, YY1_Q6_02, MAF_Q6_01, PAX4_02). w = 11.
4 ROX1_Q6.
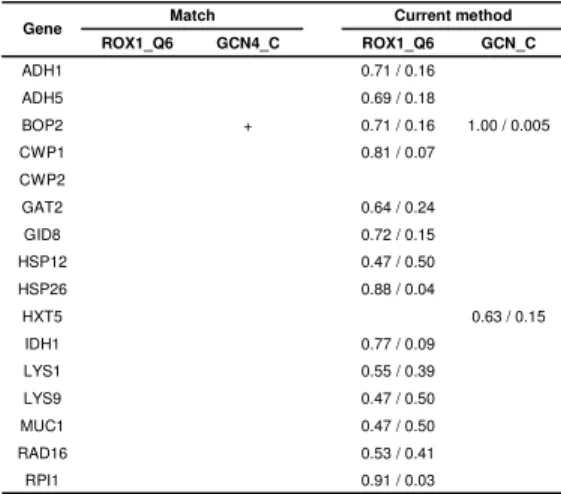
We identified 16 yeast genes (Table 1) that are known to be associated with both transcription factors GCN4 and ROX1 (YEASTRACT database [18]) and used them to validate our method and compare it with Match [2]. While using the default similarity threshold, Match could only find one of the 32 known associations. All associations are found by Match while decreasing the threshold because it considers
pseudo-count, which would guarantee to find all instances at a low threshold and to have a high number of false positive predictions. Without knowing their statistical expectation, we did not include those misleading predictions in Table 1. Our method found 16 of the 32 associations, of which 3 have p < 0.05.
C. Human cancer genes
We searched promoters of human cancer genes and predicted about 20% of these cancer gene have potential association with the transcription suppressor HIC-1 (Fig. 5, p 0.05). Since our promoter sequences are from a normal human individual (not a cancer patient), it is not unreasonable that 20% of the cancer genes are associated with the transcription suppressor.
V. DISCUSSION
Finding a threshold for the PWM-based methods has always been a challenge since their beginning. There is no substantial breakthrough so far in solving this problem. Match [2] appears more appealing than the others and widely used. Match takes the maximum and minimum score and scales them between 0.00 and 1.00 and it also takes into consideration five consecutive nucleotides whose maximum score is the best in any region of the PWM space. This method is generally applicable if the minimum score value of a PWM is around 0.00, which would basically be the same as the method proposed in this paper. The reality is that many PWMs have minimum score value far below (in the case of log-odd score) or higher than 0.00 (in the case of relative information content that that Match uses). For example, the PWM for the binding sites of the heat shock factor in yeast (HSF, Fig. 6) [23] has a Vmin= -10.22 and a Vmax= 7.47. A
subsequence with a log-odd score of 0.00 based on this matrix would have a misleading similarity score of 0.58 based on the method proposed in [2]. In fact, the log-odd score of 0.00 indicates the subsequence is basically identical to the background model. Our goodness-of-fit index (G) indicates how close a subsequence is to the PWM as compared to the background model rather than Vmin. With additional statistical
expectation at a threshold, users certainly understand the levels of confidence of the predicted motif instances.
P-Match [3] combines pattern matching and weight matrix approaches and claimed to be more accurate. We tried to search for the GCN4_C and ROX1_Q1 motifs using P-Match, but unable to find any by the default setting. It is expected to find all associations at a lower threshold, same as those predicted by Match. However, those potential associations would be buried in a large number of false positive
0 0.1 0.2 0.3 0.4 0.5 0.6 0.7 0.8 0.9 1 Goodness p / S n 0.0 0.1 0.2 0.3 0.4 p Sn PPV 0.0 0.2 0.4 0.6 0.8 0.4 0.5 0.6 0.7 0.8 0.9 1 Goodness p / S n 0.04 0.05 0.06 0.07 0.08 0.09 Threshold (gt) S ta ti s ti c a l e x p e c ta ti o n ( p _ v a lu e ) / S e n s ib il it y P o s iti v e p re d ic tiv e v a lu e A B 0 0.1 0.2 0.3 0.4 0.5 0.6 0.7 0.8 0.9 1 Goodness p / S n 0.0 0.1 0.2 0.3 0.4 p Sn PPV 0.0 0.2 0.4 0.6 0.8 0.4 0.5 0.6 0.7 0.8 0.9 1 Goodness p / S n 0.04 0.05 0.06 0.07 0.08 0.09 Threshold (gt) S ta ti s ti c a l e x p e c ta ti o n ( p _ v a lu e ) / S e n s ib il it y P o s iti v e p re d ic tiv e v a lu e A B
Fig. 4. Performance evaluation on yeast data application case.
The plot legends in panel A (GCN4_C) also apply to panel B (ROX1_Q6). Sn: sensitivity, PPV: positive predictive value, p: p_value (Equation 6).
Table 1. Validation and comparison with Match [Error! Reference source not found.]. The values in the current
method columns indicate that the associations were found at threshold of G / p_value. ROX1_Q6 GCN4_C ROX1_Q6 GCN_C ADH1 0.71 / 0.16 ADH5 0.69 / 0.18 BOP2 + 0.71 / 0.16 1.00 / 0.005 CWP1 0.81 / 0.07 CWP2 GAT2 0.64 / 0.24 GID8 0.72 / 0.15 HSP12 0.47 / 0.50 HSP26 0.88 / 0.04 HXT5 0.63 / 0.15 IDH1 0.77 / 0.09 LYS1 0.55 / 0.39 LYS9 0.47 / 0.50 MUC1 0.47 / 0.50 RAD16 0.53 / 0.41 RPI1 0.91 / 0.03
Gene Match Current method
P1 P2 P3 P4 P5
A 28 0 46 46 12
C 6 0 0 0 19
G 12 48 2 2 8
T 4 2 2 2 11
Fig. 6. One example PWM (HSF_01), which has a
low Vmin (-10.22) and a moderate Vmax (7.47).
0.0 0.2 0.4 0.6 0.8 1.0 0.4 0.5 0.6 0.7 0.8 0.9 Goodness 0.0 0.1 0.2 0.3 0.4 0.5 Threshold (gt) P re d ic ti o n p _ v a lu e 0.0 0.2 0.4 0.6 0.8 1.0 0.4 0.5 0.6 0.7 0.8 0.9 Goodness 0.0 0.1 0.2 0.3 0.4 0.5 Threshold (gt) P re d ic ti o n p _ v a lu e
Fig. 5. Prediction of association between the transcription factor
HIC1 and its target human cancer genes. Red: predicted by HIC1_02, Green: predicted by HIC1_03, Black: union prediction of HIC1_02 and HIC1_03. Solid curves: predicted percentage,
5 predictions. Without prior knowledge of these associations or statistical expectation, it would be nearly impossible to distinguish them from false positives.
Nucleotide frequency varies across genomes, for example, the frequencies of A, C, G, T in human promoter sequences are 0.23, 0.27, 0.27 and 0.23, respectively, which are not too much different from the default frequency (0.25 for each nucleotide). But in yeast promoter sequences, they are 0.31, 0.19, 0.19 and 0.31, respectively. For this reason, we use genome specific nucleotide frequency. Additionally, the nucleotide frequencies change over various regions of genomics sequences [24]-[25]. Fore more precise prediction, regional nucleotide frequencies should be applied.
Occasionally, the log-odd score of a motif instance could be dominated by one or a few positions because of their extremely high or low frequency values for certain nucleotide(s). Probably, one could argue that a log-odd value of 0.00 for a subsequence might not represent its identity with the background model because the influence of one or more high value(s) of the high frequency nucleotide(s) at certain position(s) is neutralized by the influence of one extremely low value derived from a low frequency nucleotide at another position. Nevertheless, because the overall log-odd score is close to 0.00, no matter if it is caused by the neutralization of frequencies across various positions or by overall values close to 0.00, this subsequence is not likely a true TFBS. Therefore, a 0.00 log-odd score indicate the subsequence is most unlikely a TFBS.
A transcription factor usually binds on a DNA sequence through several positions. Numerous previous studies indicated that the positions inside a motif are somewhat interdependent. For this reason, PWMs are converted to high order hidden Markov models [26]. The log-odd score of a motif instance can be calculated based on the state transition probability (e.g. Viterbi score) of the high order hidden Markov model. The same calculation proposed in (3) can be applied to scale the log-odd scores derived from hidden Markov models and statistical expectations can be calculated accordingly.
In evaluation of a method, we used Sensitivity and Positive
Predictive Value. These terminologies are extensively used in medical field [19]-[20]. To avoid potential confusion of the terminology, readers should be cautioned that some articles, such as [21], redefined Specificity by taking the
Positive Predictive Value. To keep with traditional usage of terminology, we take the definition as described in [19]-[20].
Many biological problems can not be easily revealed by simply measuring statistical significance. For example, in our application of yeast genome, too stringent goodness-of-fit threshold would exclude many potential candidates, such as the threshold set in Match for the two yeast PWMs (Table 1) and our work in ROX1_Q6 (Fig. 4B). With varying threshold incorporating both the G values and the distribution function of statistical expectation, we are able to find more motifs using the method proposed in this paper. Generally, a less stringent threshold would incur higher false positive prediction (Fig. 4). This can be complemented by incorporating other information such as microarray gene expression data [27] or through comparative genomic approaches [28]. Incorporating gene expression data is
certainly a boost in motif finding. However, such data are not always available. With comparative genomics approach, it is arguable even though some successes were shown. Our recent study indicates that promoters of most human genes are significantly different from their orthologues in mice or rats. Similarly, mapping of transcription factor binding sites in closely related yeast Saccharomyces cerevisiae, S. mikatae, and S. bayanus reveals extensive divergence [29].
Based on the two application cases, we suggest taking consideration of both goodness-of-fit index and statistical expectation in selecting a threshold. In choosing a threshold, length (number of columns) of a PWM should be considered; a higher G value and higher p_value should be considered for shorter PWM. For example, using a PWM of length 5 (e.g. Fig. 6) to search for motifs on a sequence of 1030 bp, it is statistically expected to find at least one instance of the PWM from the sequence no matter how high the G value is. With increasing length of the PWM, the weight of G value can be reduced while that of the statistical expectation can be increased. More details with regard to the weight distribution merits further study.
VI. CONCLUSIONS
We proposed an alternative scoring index for a positional weight matrix in finding transcription factor binding sites. This method normalizes the log-odd scores to a range between 0.00 and 1.00, which are representations of the background model and the position weight matrix, respectively. The statistical expectation is not considered by many previous methods such as Match, P-Match and others. Without p_value, it is hard to value the significance of a threshold and the found motif instance. For this reason, we associate each G threshold value with a statistical expectation value. We evaluated the proposed method in two application cases and compared the method favorably with the broadly used Match method using 16 yeast genes of known association with two transcription factors. We highly recommend a consideration of both G index and statistical expectation in choosing a threshold.
ACKNOWLEDGMENTS
We thank Bob Orchard and George Forester for their valuable comments on an earlier manuscript of this paper.
REFERENCES
[1] G. D. Stormo, “DNA binding sites: representation and discovery”.
Bioinformatics 16(1): 16-23, (2000).
[2] A. E. Kel, E. Gossling, I. Reuter, et al., “MATCH: A tool for searching transcription factor binding sites in DNA sequences”. Nucleic Acids
Res. 31(13): 3576-3579, (2003).
[3] D. S. Chekmenev, C. Haid, and A. E. Kel, “P-Match: transcription factor binding site search by combining patterns and weight matrices”.
Nucleic Acids Res. 33: W432-437, (2005).
[4] K. Cartharius, K. Frech, K. Grote, et al., “MatInspector and beyond: promoter analysis based on transcription factor binding sites”.
Bioinformatics 21(13): 2933-2942, (2005).
[5] L. Li, Y. Liang, and R. L. Bass, “GAPWM: a genetic algorithm method for optimizing a position weight matrix”. Bioinformatics 23(10): 1188-1194, (2007).
6 [6] T. L. Bailey and C. Elkan, “Fitting a mixture model by expectation
maximization to discover motifs in biopolymers”. In: R. B. Altman, D. L. Brutlag, P. D. Karp, R. H. Lathrop, and D. B. Searls (eds.)
Proceedings of the Second International Conference on Intelligent Systems for Molecular Biology, August; Menlo Park, CA: AAAI Press; pp. 28–36, (1994).
[7] T. L. Bailey, N. Williams, C. Misleh, and W. W. Li, “MEME: discovering and analyzing DNA and protein sequence motifs”.
Nucleic Acids Res. 34: W369-373, (2006).
[8] G. Z. Hertz and G. D. Stormo, “Identifying DNA and protein patterns with statistically significant alignments of multiple sequences”.
Bioinformatics 15(7-8): 563-577, (1999).
[9] J. D. Hughes, P. W. Estep, S. Tavazoie, and G. M. Church, “Computational identification of cis-regulatory elements associated with groups of functionally related genes in Saccharomyces
cerevisiae”. J. Mol. Biol. 296(5): 1205-1214, (2000).
[10] G. Thijs, M. Lescot, K. Marchal K, et al., “A higher-order background model improves the detection of promoter regulatory elements by Gibbs sampling”. Bioinformatics 17(12): 1113-1122, (2001). [11] X. Liu, D. L. Brutlag, and J. S. Liu, “BioProspector: discovering
conserved DNA motifs in upstream regulatory regions of co-expressed genes”. Pac. Symp. Biocomput. 2001: 127-138.
[12] V. Matys, O. V. Kel-Margoulis, E. Fricke, et al., “TRANSFAC and its module TRANSCompel: transcriptional gene regulation in eukaryotes”. Nucleic Acids Res. 34: D108-110, (2006).
[13] A. Sandelin, W. Alkema, P. Engstrom, W. W. Wasserman, and B. Lenhard, “JASPAR: an open-access database for eukaryotic transcription factor binding profiles”. Nucleic Acids Res. 32: D91-94. (2004).
[14] W. W. Wasserman and A. Sandelin, “Applied bioinformatics for the identification of regulatory elements”. Nat. Rev. Genet. 5(4): 276-287, (2004).
[15] M. Tompa, N. Li, T. L. Bailey, et al., “Assessing computational tools for the discovery of transcription factor binding sites”. Nat.
Biotechnol. 23(1):137-44, (2005).
[16] Y. Pan, “Advances in the Discovery of cis-Regulatory Elements”.
Current Bioinformatics 1: 321-336, (2006).
[17] L. Hertzberg, O. Zuk, G. Getz, and E. Domany, “Finding motifs in promoter regions”. J. Comput. Biol. 12:314-30, (2005).
[18] M. C. Teixeira, P. Monteiro, P. Jain, et al., “The YEASTRACT database: a tool for the analysis of transcription regulatory associations in Saccharomyces cerevisiae”. Nucleic Acids Res. 34: D446-451, (2006).
[19] D. G. Altman and J. M. Bland, “Statistics Notes: Diagnostic tests 1: sensitivity and specificity”. British Medical Journal 308: 1552, (1994).
[20] D. G. Altman and J. M. Bland, “Statistics Notes: Diagnostic Tests 2 - Predictive Values”. British Medical Journal 309: 102, (1994). [21] M. Burset and R. Guigo, Evaluation of gene structure prediction
programs. Genomics 34: 353–367, (1996).
[22] M. E. Higgins, M. Claremont, J. E. Major, C. Sander, and A. E. Lash, “CancerGenes: a gene selection resource for cancer genome projects”.
Nucleic Acids Res. 35:D721-726, (2006).
[23] M. Fernandes, H. Xiao, and J. T. Lis, “Fine structure analyses of the
Drosophila and Saccharomyces heat shock factor-heat shock element interactions”. Nucleic Acids Res. 22:167-173, (1994).
[24] Y. Pan, B. Smith, H. Fang, A. F. Famili, M. Sikorska, and P. R. Walker, “Selection of putative cis-regulatory motifs through regional and global conservation”. In: Proceedings of the 2004 IEEE
Bioinformatics Conference (CSB2004), pp. 684-685
[25] B. Smith, H. Fang, Y. Pan, P. R. Walker, A. F. Famili, and M. Sikorska, ”Evolution of motif variants and positional bias of the cyclic-AMP response element”. BMC Evolutionary Biology 7(Suppl 1):S15, (2007).
[26] A. Krogh, M. Brown, I. S. Mian, K. Sjolander, and D. Haussler, “Hidden Markov models in computational biology applications to protein modeling”. J. Mol. Biol. 235: 1501-1531, (1994).
[27] L. Hertzberg, S. Izraeli, and E. Domany, “STOP: searching for transcription factor motifs using gene expression”. Bioinformatics 23: 1737-1743, (2007).
[28] L. A. Newberg, W. A. Thompson, S. Conlan, T. M. Smith, L. A. McCue, and C. E. Lawrence, “A phylogenetic Gibbs sampler that yields centroid solutions for cis-regulatory site prediction”.
Bioinformatics 23: 1718-1727, (2007).
[29] A. R. Borneman, T. A. Gianoulis, Z. D. Zhang, et al., ”Divergence of transcription factor binding sites across related yeast species”. Science 317(5839):815-819, (2007)