Publisher’s version / Version de l'éditeur:
Vous avez des questions? Nous pouvons vous aider. Pour communiquer directement avec un auteur, consultez la première page de la revue dans laquelle son article a été publié afin de trouver ses coordonnées. Si vous n’arrivez Questions? Contact the NRC Publications Archive team at
[email protected]. If you wish to email the authors directly, please see the first page of the publication for their contact information.
https://publications-cnrc.canada.ca/fra/droits
L’accès à ce site Web et l’utilisation de son contenu sont assujettis aux conditions présentées dans le site LISEZ CES CONDITIONS ATTENTIVEMENT AVANT D’UTILISER CE SITE WEB.
Research Report (National Research Council of Canada. Institute for Research in
Construction), 2010-03-30
READ THESE TERMS AND CONDITIONS CAREFULLY BEFORE USING THIS WEBSITE. https://nrc-publications.canada.ca/eng/copyright
NRC Publications Archive Record / Notice des Archives des publications du CNRC : https://nrc-publications.canada.ca/eng/view/object/?id=b4a945a3-4cc4-4d2f-9b1e-4eee6ab3c7e4 https://publications-cnrc.canada.ca/fra/voir/objet/?id=b4a945a3-4cc4-4d2f-9b1e-4eee6ab3c7e4
Archives des publications du CNRC
For the publisher’s version, please access the DOI link below./ Pour consulter la version de l’éditeur, utilisez le lien DOI ci-dessous.
https://doi.org/10.4224/20374060
Access and use of this website and the material on it are subject to the Terms and Conditions set forth at
Office occupants: evaluations of an individually-controllable lighting
system
Veitch, J. A.; Donnelly, C. L.; Galasiu, A. D.; Newsham, G. R.; Sander, D. M.;
Arsenault, C. D.
Offic e Oc c upa nt s’ Eva lua t ions of a n I ndividua lly-Cont rolla ble Light ing
Syst e m
I R C - R R - 2 9 9
V e i t c h , J . A . ; D o n n e l l y , C . L . ; G a l a s i u , A . D . ;
N e w s h a m , G . R . ; S a n d e r , D . M . ; A r s e n a u l t , C . D .
March 30, 2010
The material in this document is covered by the provisions of the Copyright Act, by Canadian laws, policies, regulations and international agreements. Such provisions serve to identify the information source and, in specific instances, to prohibit reproduction of materials without written permission. For more information visit http://laws.justice.gc.ca/en/showtdm/cs/C-42
Les renseignements dans ce document sont protégés par la Loi sur le droit d'auteur, par les lois, les politiques et les règlements du Canada et des accords internationaux. Ces dispositions permettent d'identifier la source de l'information et, dans certains cas, d'interdire la copie de documents sans permission écrite. Pour obtenir de plus amples renseignements : http://lois.justice.gc.ca/fr/showtdm/cs/C-42
Office Occupants’ Evaluations of an
Individually-Controllable Lighting System
Jennifer A. Veitch, Cara L. Donnelly, Anca D. Galasiu, Guy R. Newsham, Dan M. Sander and Chantal D. Arsenault
Research Report No. 299
National Research Council Canada Institute for Research in Construction
Ottawa, Ontario
Office Occupants’ Evaluations of an Individually-Controllable Lighting System Jennifer A. Veitch, Cara L. Donnelly, Anca D. Galasiu,
Guy R. Newsham, Dan M. Sander and Chantal D. Arsenault Executive Summary
We conducted a field study on four floors of an office building in Burnaby, British Columbia, Canada. This was a typical deep-plan office building with cubicle accommodation and large windows. Individually-controllable workstation-specific suspended direct-indirect (WSDI-C) luminaires located centrally in each workstation provided lighting over most of the floor area. The luminaire had three control systems designed to reduce energy use (see Figure A):
• An integrated occupancy sensor (OS), used to detect the presence or absence of people and turn the direct downlight on and off accordingly.
• An integrated light sensor (LS), used to monitor the light levels and dim the direct downlight to maintain the occupant’s preset preferred light level; the primary purpose of this control was to use daylight to offset electric lighting.
• Individual control (IC), consisting of a graphical slider on the occupant’s computer screen allowing both on/off switching or dimming of the direct downlight to a preferred level.
One half of one floor featured a
conventional ceiling-recessed parabolic-louvered lighting system for comparison with zonal on-off switching. The installed lighting power density in office areas served by the WSDI-C system was approximately 5.6 W/m2, versus 10 W/m2 in the office area with conventional lighting. The illuminance in the centre of
the cubicles at desktop height was similar under both lighting systems, at 400 – 450 lux. Data were collected from more than 80 workstations throughout 2005 to examine how the controls were used, the magnitude of the energy savings attributable to the controls, and whether provision of controls (and access to windows) improved environmental
satisfaction, and job satisfaction-related outcomes. Data on control and energy use were collected during three distinct periods:
•
Phase 1: January 18 to March 11, light sensor was de-activated.•
Phase 2: March 12 and October 2, all controls were in operation.•
Phase 3: October 3 to December 31, all controls were in operation, and an awareness campaign was conducted in which monthly e-mails were sent from management reminding employees about the availability of the individual control system, and how to use it.The control and energy use data were reported elsewhere [Galasiu et al., 2007]. This report concerns the occupants’ evaluations of the office lighting as reported in three surveys:
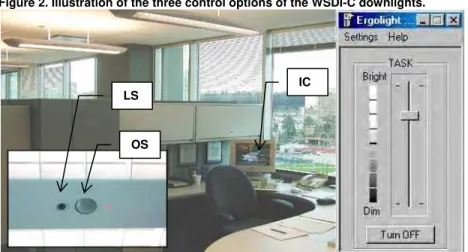
Figure A. Illustration of the WSDI-C installation, and the three control options of the WSDI-C downlights.
LS
OS
two during Phase 2, and one during Phase 3. The survey included items on office and lighting appraisals, environmental satisfaction, and questions related to job satisfaction.
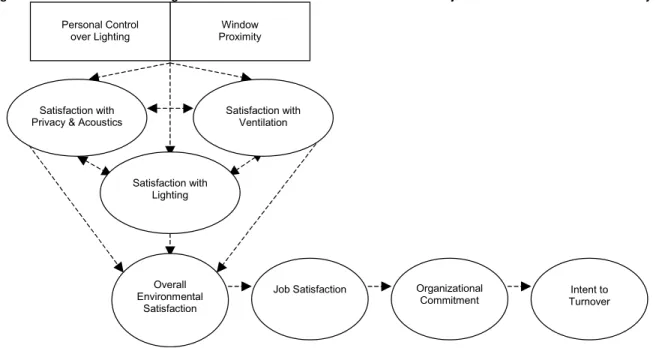
The WSDI-C system was associated with a superior indoor environment. Appraisals of the luminous environment and of environmental satisfaction were significantly and consistently higher for the occupants with WSDI-C compared to those with conventional lighting. For example, when presented with the statement, “Overall, the lighting is comfortable”, approximately 75% of respondents with the conventional lighting agreed, compared to ~95% of respondents with the WSDI-C. There was also a smaller beneficial effect for occupants seated in perimeter workstations. Although there was no direct link between provision of WSDI-C/window access and job satisfaction-related outcomes, there was an indirect link. Occupants with higher environmental satisfaction also had higher job satisfaction, higher organizational commitment, and lower intent to turnover (see Figure B).
Figure B. Full model of the linkages between indoor environment conditions and job satisfaction tested in this study.
The awareness campaign exhibited mixed results. It did stimulate occupants to use the controls more frequently. However, the tendency was for preferred light levels to increase, perhaps because the campaign was conducted in late Fall-early Winter. This resulted in diminished energy savings. The increased awareness did not improve occupant satisfaction, perhaps because satisfaction was already high for occupants with WSDI-C.
Window Proximity Personal Control over Lighting Satisfaction with Ventilation Satisfaction with Lighting Satisfaction with
Privacy & Acoustics
Overall Environmental
Satisfaction
Job Satisfaction Organizational
Table of Contents
1 Introduction ... 5
1.1 Lighting Controls and Energy Use ... 5
1.2 Environmental satisfaction... 5
2 Method ... 6
2.1 Site and Lighting ... 6
2.2 Research Design ... 8
2.3 Communications and Recruitment ... 10
2.4 Dependent Measures ... 11 3 Results ... 11 3.1 Participants ... 13 3.1.1 T1 dataset ... 13 3.1.2 T2 dataset. ... 13 3.1.3 T3 dataset. ... 14 3.1.4 BG dataset. ... 15 3.1.5 RM dataset. ... 16
3.2 Office Lighting Appraisals ... 17
3.2.1 T1 results. ... 17
3.2.2 T2 results. ... 22
3.2.3 T3 results. ... 27
3.2.4 Summary: Office lighting appraisals. ... 33
3.3 Environmental Satisfaction ... 33
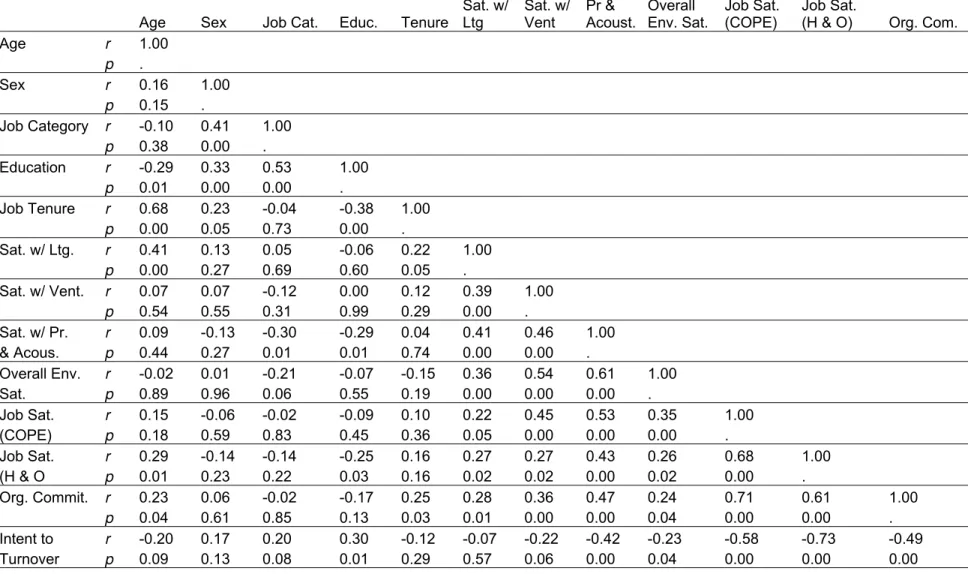
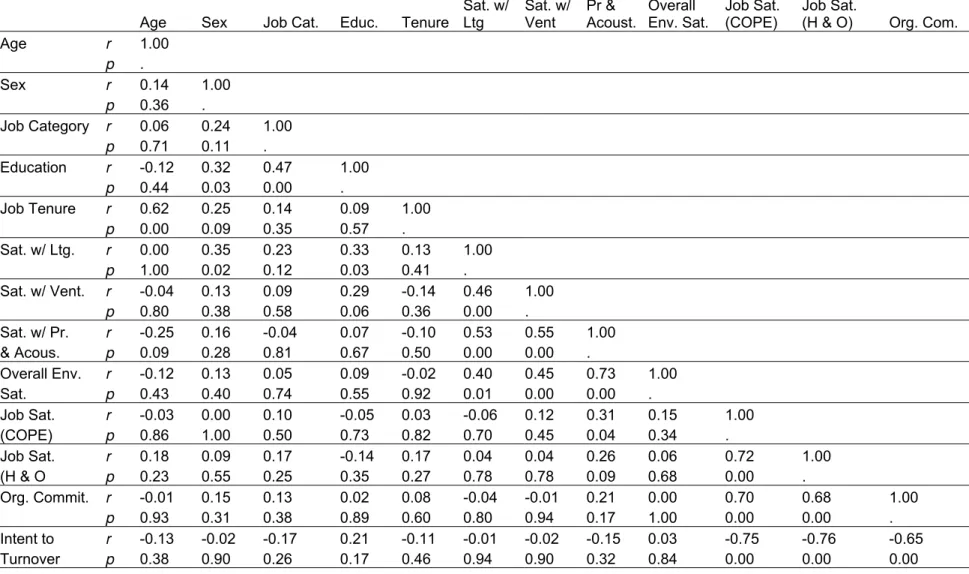
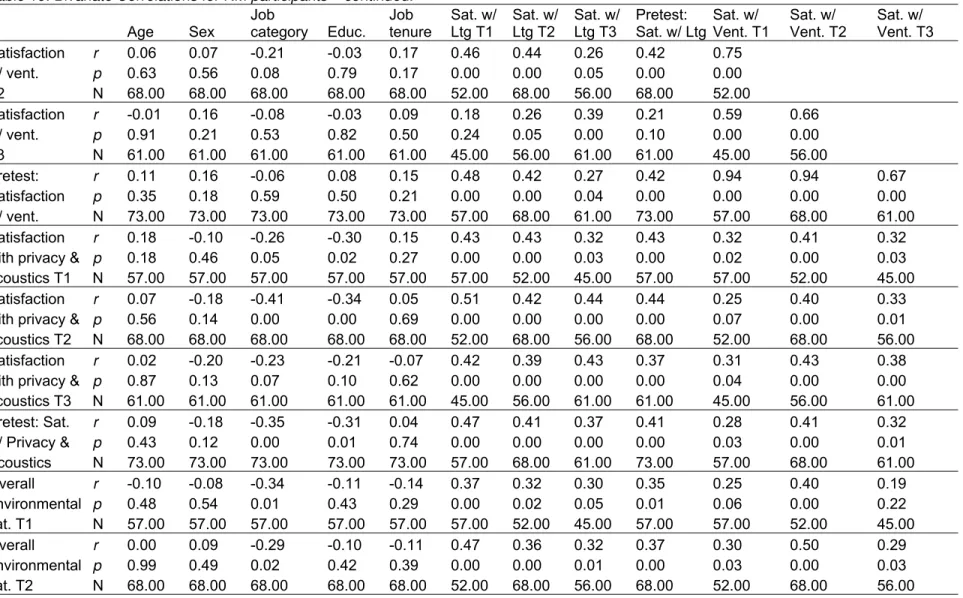
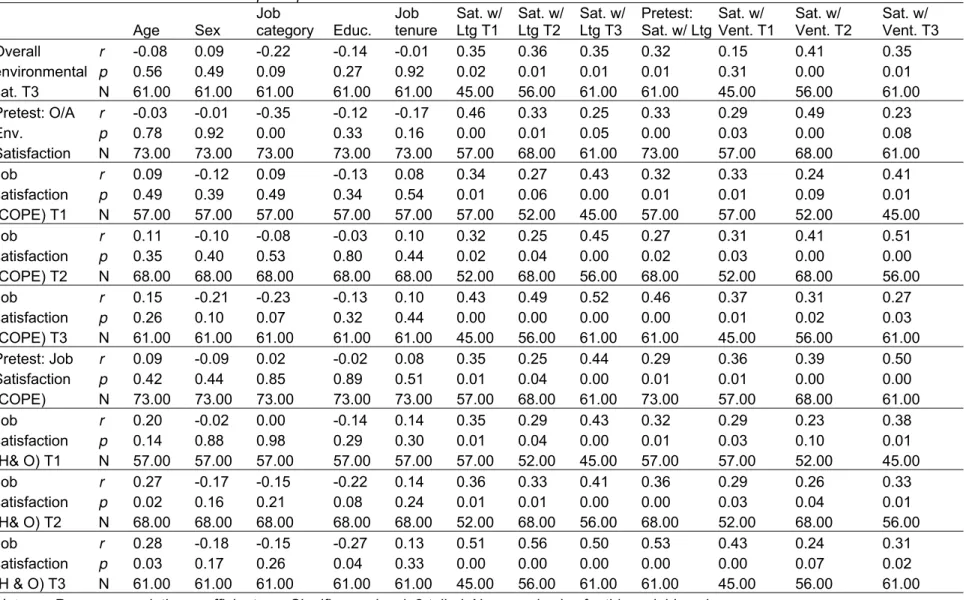
3.3.1 General MANCOVA model. ... 33
3.3.2 T1 results. ... 47
3.3.3 T2 results. ... 48
3.3.4 T3 results. ... 49
3.3.5 BG results. ... 50
3.3.6 RM results. ... 51
3.3.7 Summary: Environmental satisfaction. ... 52
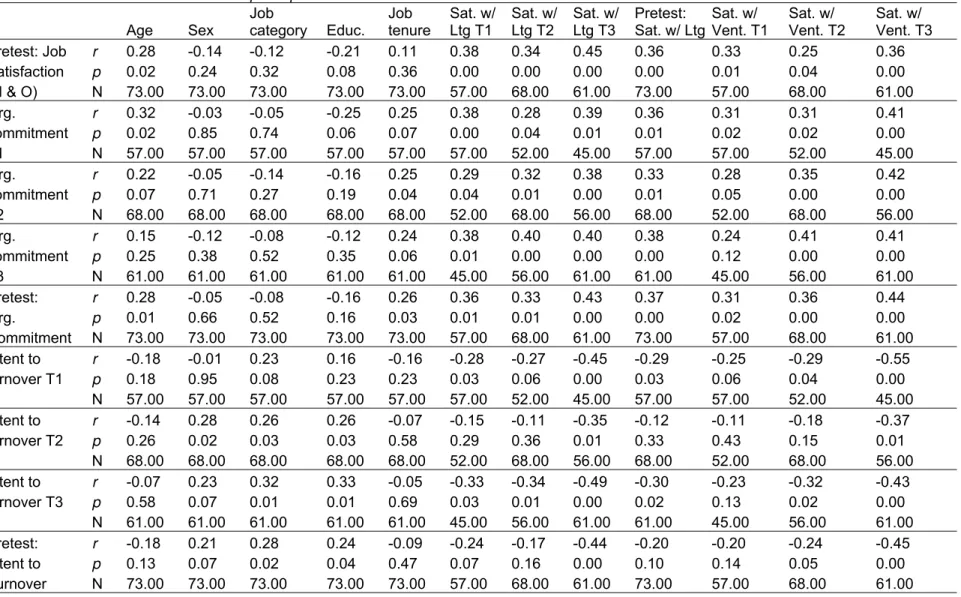
3.4 Job Satisfaction ... 53
3.4.1 Analytic model. ... 53
3.4.2 T1 results. ... 56
3.4.3 T2 results. ... 57
3.4.4 T3 results. ... 59
3.4.5 Summary: Job satisfaction. ... 61
3.5 Qualitative Office Appraisals ... 61
3.5.1 T1 results. ... 62
3.5.2 T2 results. ... 65
3.5.3 T3 results. ... 68
3.5.4 Summary: Qualitative appraisals. ... 71
4 Discussion ... 71
5 Conclusions ... 73
References ... 74
Acknowledgements ... 77
1 Introduction
1.1 Lighting Controls and Energy Use
As part of the national commitment to reduce greenhouse gas production and to improve the state of the natural environment, Canadian buildings need to use less energy. Offices were reported in 2003 to have used 42% of the total energy used by the
commercial/institutional sector, with lighting accounting for as much as 13.5% of the total building energy use, and 33% of the electricity use [NRCan, 2005]. Several research studies have generated promising results suggesting that large amounts of electrical energy can be saved by using good, optimized lighting control systems such as daylight-linked dimming and occupancy sensors [Maniccia et al., 1999; Jennings et al., 2000; Lee & Selkowitz, 2006]. Personal dimming controls were also shown to reduce energy use, while increasing occupant satisfaction [Boyce et al., 2003; Newsham et al., 2004].
Nevertheless, despite the fact that various energy saving technologies have been available to the building industry for some time, their implementation continues to be very slow. This is not surprising, however, given the scarcity of long-term performance
assessments of real lighting installations incorporating such technologies that show that these systems do work as asserted and justify their higher investment cost. Even fewer studies have surveyed concurrently the opinions and preferences of the users of these systems. Most investigations either took place in laboratory settings, or reported failures in attaining the projected energy savings, revealing significant problems with their calibration and user acceptability [Bordass et al., 1994; Love, 1995; Slater, 1995 &1996].
A review of the scientific literature to date showed that there is almost no information available on the long-lasting success of energy-saving control systems when used in
combination in real buildings. This project was designed to partially remedy this gap and to generate information that could improve the uptake of such lighting controls in buildings. The study took place in a real office building featuring an innovative lighting control system with the potential to save large amounts of electrical energy [Suvagau & Hughes, 2002]. It included the long-term monitoring of the lighting system, along with an evaluation of the building’s facades’ occlusion with internal blinds, and the evaluation of the occupants’
satisfaction with the lighting system and their work environment. The energy monitoring data have been previously reported elsewhere [Galasiu et al., 2007]. This report addresses only the occupants’ evaluation of the lighting system in their offices.
1.2 Environmental satisfaction
Herzberg’s theory of motivation suggested that satisfactory working conditions had no influence on positive employee attitudes and behaviour [Osland et al., 2000]. More recently, however, environmental psychology research has made clear that the physical work environment does influence various organizational outcomes, such as job satisfaction and individual and group performance [e.g., Brill, Weidemann, & BOSTI, 2001]. These attitudes and behaviours are essential to an organization’s bottom line. Therefore, the effects of the physical working environment can no longer be ignored.
NRC’s Cost-effective Open-Plan Environments (COPE) project, using survey data from 779 participants in 9 buildings, generated a statistically significant overall model linking satisfaction with lighting, ventilation, and privacy and acoustics to overall environmental satisfaction. Overall environmental satisfaction in turn was positively correlated with job satisfaction [Veitch et al., 2007]. Other aspects of the COPE research elucidated
workstation) revealed that closer proximity to a window was associated with higher rates of satisfaction with lighting. Previous research also showed that having personal control over lighting has a direct positive influence on overall environmental satisfaction [Boyce et al., 2003]. These findings suggest that the provision of lighting control systems and windows leads to more job satisfaction through their positive influence on environmental satisfaction.
Several studies have demonstrated the effect of job satisfaction on important aspects of organizational productivity. For example, using structural equation modeling, Williams and Hazer [1986], Gaertner [1999], and Yoon and Thye [2002] found that higher job satisfaction led to greater organizational commitment. Yousef [2002] demonstrated that job satisfaction mediated the relationship between job characteristics and organizational commitment. Research has also found that higher job satisfaction was correlated with lower employee turnover [Harter et al., 2002]. Likewise, lower levels of organizational commitment among employees have been linked to higher intent to turnover [Carlopio, 1996; Lambert et al., 2001]. Wilson et al. [2004] found job satisfaction and organizational commitment to be significantly related to turnover intentions.
Generally, the literature suggests an indirect path linking the provision of personal lighting control systems and windows to important organizational outcomes. That is, access to environmental controls and windows increases satisfaction with the environment [Boyce et al., 2003; Veitch et al., 2005]; satisfaction with the environment increases job satisfaction [Veitch et al., 2007]; job satisfaction increases organizational commitment [e.g., Yoon & Thye, 2002], and organizational commitment decreases turnover intentions [e.g., Carlopio, 1996]. Although there exists a logical chain of research findings linking environmental controls and window proximity to organizational outcomes, there has been as yet no direct test of this path in which a single sample provided data on all of these measures. This was the focus of the survey portion of the present study. The hypothesis tested was that
satisfaction with the physical environment will be higher among participants with personal control over lighting and window access, and that there will also be small benefits for job satisfaction, organizational commitment, and intent to turnover associated with having access to these office features.
2 Method
2.1 Site and Lighting
The office building incorporating the lighting control system investigated in this study was a 12-storey rectangular, curtain-wall, green-tinted glazed structure located at sea level in large urban area in southwestern British Columbia at a latitude of 49°11’ and a longitude of 123°10’.
The host organization occupied the upper four floors in this building, their offices consisting mostly of open-plan areas (75% of total floor area) furnished with cubicle-type workstations and no private offices. A few enclosed areas are located at the core of the building providing shared spaces for meeting rooms, break rooms, and storage. Each floor had an approximate area of 835 m2. The heightof the partitions between the workstations varied from 0.84 m next to the windows, to 1.25 m between two adjacent workstations, and 1.42 m next to the aisles.The building was remote from nearby constructions that could prevent ample daylight admittance into the open-plan space, and the fully-glazed façades offered in all four cardinal directions a distant view of both city and mountain landscape.
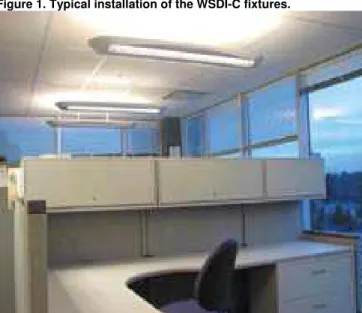
The lighting in the test areas consisted of individually controllable workstation-specific direct-indirect luminaires (abbreviated WSDI-C) suspended at about 0.3 meters below the ceiling and located centrally in each workstation (Figure 1). When fully on, each light fixture provided an average illuminance of 450 lux in the center of the workstation at 0.85 m above the floor (desktop height).
Figure 1. Typical installation of the WSDI-C fixtures.
Each WSDI-C luminaire (Figure 1) consisted of 3x32 W 3500 K fluorescent lamps connected by a network to a central control computer and to each occupant’s desktop computer. The fixture also included an occupancy sensor and a daylight photosensor.
The lamp in the center of the luminaire was equipped with a static electronic ballast and directed the light mainly upward, toward the ceiling, ensuring constant general lighting around the open-plan space. During the study, the uplights were controlled centrally based on a daily schedule that kept them continuously on at full power from 7:30 AM to 5 PM on workdays (Monday to Friday). During other times, the uplights were turned on by an integrated occupancy sensor when sensing occupancy in the vicinity.
The two lamps at the sides directed the light mainly downward, toward the desktop. The downlights were controlled during the study based on the following three control options (Figure 2):
•
An integrated occupancy sensor (OS), used to detect the presence or absence of people and turn the downlight on and off accordingly. It consisted of an infrared motion sensor mounted directly on the light fixture and connected to a single low-voltage dimmable ballast that controlled both lamps of the downlight at the same time. The motion sensor automatically detected vacancy in the workspace and if the occupant was absent during a preset time, the sensor prompted the downlight to gradually dim down to zero and switch-off. When presence was detected, the downlight was automatically restored to the previously set lighting level.•
An integrated light sensor (LS), used to monitor the surrounding light levels and dim the downlight when sufficient light (from either daylight or neighbouring electric light) was present to maintain the occupant preset light level. The light sensor consisted of a photocell mounted directly on the light fixture and connected to the dimmable ballast that controlled both lamps of the downlight simultaneously.•
An individual control (IC), consisting of an on-screen slider located on the occupants desktop computers that allowed both on/off switching or dimming of the downlight to a preferred level.Figure 2. Illustration of the three control options of the WSDI-C downlights.
The field installation comprised a total of 195 WSDI-C fixtures distributed over three and a half floors as shown in Table 1. A total of 104 WSDI-C fixtures were located in workstations situated at the perimeter of the building with direct access to windows; 56 WSDI-Cs were located in 2nd row workstations adjacent to the perimeter workstations at distances between 2.5 and 4.5 meters from the windows; and 35 WSDI-Cs were located at the core of the building at distances greater than 5.0 meters from the closest window.
The other half of floor D featured a conventional ceiling-recessed fluorescent lighting system comprising 2x4 parabolic-louvered luminaires with 2x32-T8 lamps (3500 K) and electronic ballasts. This area had zonal on/off switching, and the lights were on from 7:30 AM to 5 PM on workdays (Monday to Friday). The average illuminance provided by this system at desktop height in the center of the workstations was about 400 lux. The 195 WSDI-C fixtures replaced a total of 530 such lighting fixtures, which reduced the lighting power density in the areas where they were installed by almost half (5.6 W/m2 versus 10 W/m2).
Table 1. Distribution of the WSDI-C fixtures per floor and location relative to windows.
Perimeter Workstations 2nd Row Workstations Interior/Core Workstations Total WS per floor Floor A 31 19 3 53 Floor B 20 12 7 39 Floor C 35 19 19 73 Floor D 18 6 6 30
Total WS per distance to windows 104 56 35 2.2 Research Design
This was a quasi-experimental investigation in which non-random groups of participants were compared. Data on the demographic characteristics of the groups were used to ensure the approximate equivalence of the groups. Although this type of research does not permit the strong causal inference of a laboratory experiment, it has the potential for wider application because of its field setting [Cook & Campbell, 1979].
There were four independent variables of interest in this study: personal control over lighting, window proximity, an awareness campaign, and time.
Personal control over lighting consisted of two experimental groups:
• individuals who had personal control over lighting through the WSDI-C system at their workstation (control);
LS
OS
• individuals who had conventional ceiling-recessed lighting with no personal control at their workstation (no control).
Window proximity included three experimental groups:
• individuals working in perimeter workstations with direct access to windows (window row);
• individuals working in 2nd
row workstations adjacent to the perimeter workstations and located at distances between 2.5 to 4.5 meters from the nearest window (aisle 2);
• individuals working in workstations located at the core of the building at distances greater than 5 meters from the nearest window (aisle 3-5).
The effect of workstation orientation (North vs. South vs. East vs. West vs. Corner workstation) could not be examined due to the inadequate sample size of the experimental group in each category.
Survey data were collected at three times. The first survey administration took place in April 2005 (T1 dataset), the second in August 2005 (T2 dataset), and the third in
November 2005 (T3 dataset).
Some participants completed more than one survey administration, which enabled repeated-measures analyses to examine change in effects over time (RM dataset). Time was an additional independent repeated-measures variable of interest in this study (T1 vs. T2 ). Typically, no change in effects over time would have been predicted.
An awareness campaign was implemented between T2 and T3. The campaign consisted of monthly e-mail reminders to all employees having WSDI-C lighting, reminding them about the WSDI-C control system, providing them with information on how to use it, and encouraging them to save energy by using the on-screen lighting controls:
[Let's Walk the Talk].
Just a reminder about the lighting system we have here at work -- let's take full advantage of the benefits this system provides us...
Lighting represents one of the major end users of energy in office buildings, accounting typically for as much as 30% of the total building energy consumption. Energy use can be substantially reduced by using lighting control systems such as the one installed on our premises, which gives you personal control of the light level in your workstation via your computer. To learn more about the lighting system and to find instructions on installation and/or set up, please see the attached document.
The awareness campaign was intended to increase use of the lighting controls, and we expected that the increased awareness of the lighting controls should further increase lighting and environmental satisfaction. Therefore, the change in effects from
pre-intervention (T1 and T2) to post-pre-intervention (T3) was examined.
Because there were participants who only completed one survey administration either at T1, T2, or T3, between-groups analyses were also conducted to examine effects across time (BG dataset). Thus, time also served as a between-groups independent
variable. There were only 8 participants who solely participated at T2, which was too few to form a separate group for analysis. Therefore, the T2 participants were combined with the T1 participants to form a pre-intervention group. The effects across time were examined by comparing the pre-intervention group with the T3 group, or the post-intervention group.
(2) compared pre-intervention (T1 and T2) effects versus post-intervention (T3) effects using the BG dataset; and
(3) examined change in effects from T1 to T2 to T3, and from pre-intervention to post-intervention, using the RM dataset.
Table 2. Summary of research datasets.
Dataset T1 April 2005 (Pre-intervention) T2 August 2005 (Pre-intervention) Intervention (awareness campaign) T3 November 2005 (Post-intervention) T1 X T2 X T3 X
RM Participants who completed more than one survey administration BG Participants who completed only one survey administration
Organized in this way, this research design provided partial replications of the field investigation. Replication is important because it strengthens the reliability of the
conclusions of a study. For example, demonstrating once that personal control over lighting leads to satisfied employees would be interesting, but demonstrating it three times is convincing. In particular, comparisons using the BG and RM datasets were independent of one another. Obtaining similar results with these two datasets would provide strong
evidence of a reliable effect.
2.3 Communications and Recruitment
At each occasion, all occupants on the four floors were invited by e-mail to
participate in the survey. The e-mail message contained a link to the secure NRC site for the survey located on a server in Ottawa. Appendix A shows the online questionnaire.
The first page of the web site included a detailed consent form. The participants were asked to click on an “I consent” button to indicate that they understood and agreed to the conditions under which they took part in this research. Their decision to participate was voluntary and the participants were free to end their participation at any time during the survey. The questionnaire was administered over the Internet from a secure NRC website. Because it was essential for the outcome of the project to be able to link the responses of the participants with the location of their workstation in the open-plan workspace, each participant was provided with a unique ID access code to enter on the consent form when accessing the online survey. This was used together with information from the site to match the respondent to the unique IP address identifying each light fixture in the local area network. To increase the response rate, two reminder e-mails were sent to non-responding occupants at each survey occasion, at intervals of one week after the initial e-mail invitation.
Only the NRC project team had access to all the employees’ identifying information, and all the data conveying this information were held in secured storage controlled by the principal investigator.
The incentive to participate in the surveys was $1 per participating employee for the 1st survey, and $5 per participating employee for each of the 2nd and 3rd surveys. The
payment was made to a charity supported by the host organization at the completion of each phase of the project and totalled C$1066 over the life of the project.
A follow-up thank-you e-mail message was sent to all participants following the close of each survey administration.
2.4 Dependent Measures
There were four constructs of interest in this study: office lighting appraisals,
environmental satisfaction, job satisfaction, and overall office appraisals. The online survey was composed of scales designed to measure these constructs.
Office Lighting Appraisals. Office lighting appraisal was measured with the Office
Lighting Survey (OLS). The OLS items were developed by Eklund and Boyce [1996]. One strength of this survey is the availability of normative data for comparison. This scale was used in previous research where it was very useful in evaluating lighting conditions [Boyce et al., 2003]. These 10 items are in agree/disagree format.
Environmental Satisfaction. Four dependent variables were used as measures of
environmental satisfaction: satisfaction with lighting, satisfaction with ventilation, satisfaction with privacy and acoustics, and overall environmental satisfaction. The set of questions used in these scales were those used in previous NRC research, which resulted in a series of research reports detailing the inter-relationships between physical environmental conditions, satisfaction with the physical environment, and overall environmental satisfaction [Veitch et al., 2003 & 2007]. There were a total of twenty questions relating to environmental
satisfaction, all of which were rated on 7-point scales.
Job Satisfaction. Four dependent variables were used as measures of job
satisfaction: job satisfaction (COPE), job satisfaction [Hackman & Oldham, 1980], organizational commitment, and intent to turnover. The two-item job satisfaction (COPE) scale was used in previous NRC research [Veitch et al., 2003 & 2007]. The three-item job satisfaction scale was developed by Hackman and Oldham [1980], and is among the most popular tools to measure this construct. The six-item scale of organizational commitment was developed by Meyer et al. [1993]. This scale uses the Allen and Meyer
three-component conceptualization of organizational commitment [1990], which has been extensively tested and validated [Allen & Meyer, 1996]. The three-item scale of intent to turnover was developed by Colarelli [1984]. The fourteen items relating to job satisfaction were all measured on 7-point scales.
Overall Office Appraisals. Three open-ended questions were used to measure
overall office appraisals. These questions offered an opportunity for participants to provide more detailed information about their satisfaction with the office design. These qualitative data were analyzed using inductive content analysis.
The survey also included demographic questions: age, sex, education level, and job type. On average, participants completed the entire survey in eight minutes.
3 Results
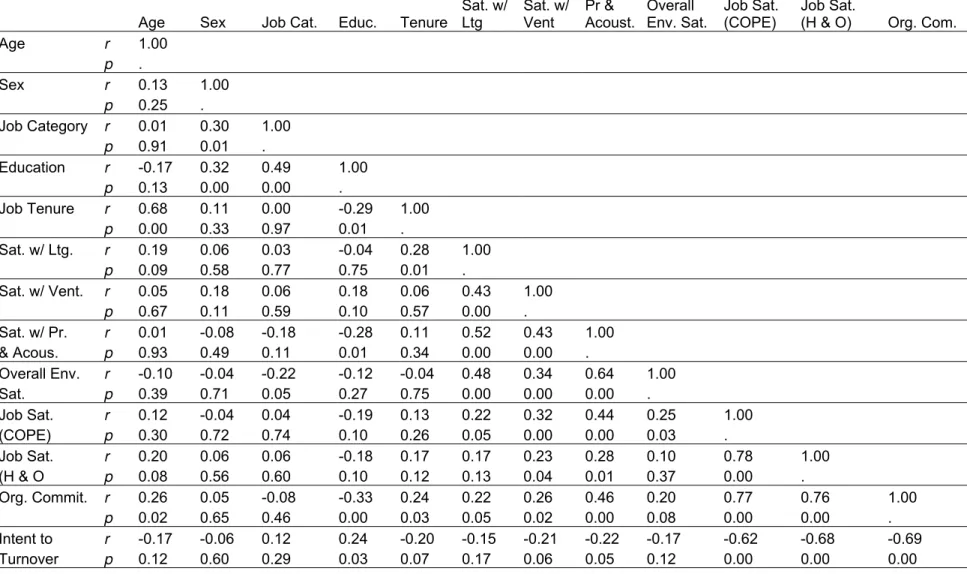
Table 3 summarizes the scales, the number of items used in each scale, each scale’s range, and the statistical techniques used to analyze the data. Conservative
practices from the behavioural sciences guided the data analysis. For in-depth discussions of the statistical techniques used in this study, consult general works such as those by Ghiselli et al. [1981]; Keppel [1982]; Kerlinger and Lee [2000]; and Tabachnick and Fidell [2001].
Analysis of each dataset began with data cleaning and screening using
recommended practices [e.g., Kerlinger & Lee, 2000; Kline, 1998; Tabachnick & Fidell, 2001]. Scale scores for the dependent variables were calculated using the rules for these established scales. Descriptive statistics were examined for all variables to test common statistical assumptions, such as normality of distribution, and also looked for outlying values and missing data. For missing data, if the number of cases was small, the analysis
The dependent variables were normally distributed after the removal of outliers; thus, no subsequent data transformations were necessary to convert the distributions to normality, which would have only complicated interpretation. The number of participants included varies slightly from one analysis to another because of missing data.
Table 3. Summary of dependent measures and analysis strategy.
Construct Dependent Measure
# of Items
Scale Range Cronbach's α Analysis Strategy Office Lighting
Appraisals
Office lighting survey 10 agree/disagree;
worse/same/better N/A Chi-squared Environmental
Satisfaction
Satisfaction with
lighting 5
1 (very unsatisfied)
to 7 (very satisfied) .55 - .82 MANCOVA Satisfaction with
ventilation 3
1 (very unsatisfied)
to 7 (very satisfied) .80 - .85 Satisfaction with
privacy & acoustics 10
1 (very unsatisfied) to 7 (very satisfied) .92 - .93 Overall environmental satisfaction 2 1 (very unsatisfied) to 7 (very satisfied); 1 (30% less productive) to 7 (30% more productive) .34 - .62
Job Satisfaction Job satisfaction
(COPE) 2
1 (very unsatisfied)
to 7 (very satisfied) .42 - .85 Job satisfaction
(Hackman & Oldham) 3
1 (very strongly disagree) to 7 (very strongly agree) .89 - .94 Organizational commitment 6 1 (very strongly disagree) to 7 (very strongly agree) .82 - .91 Intent to turnover 3 1 (very strongly
disagree) to 7 (very strongly agree)
.70 - .85 Overall Office
Appraisals
“What do you like most about your office?”
1 Open-ended N/A Content
Analysis “What do you like
least about your office?”
1 “What would you
change about your office?”
1
Note. Cronbach’s alpha (α) is a test of the reliability, or internal consistency reliability, of a scale and
has possible values from 0-1 [Kerlinger & Lee, 2000]. As a general rule of thumb, alpha coefficients of .5 or above are acceptable.
With two exceptions, all scales demonstrated acceptable internal consistency. Overall environmental satisfaction and job satisfaction (COPE) had low α coefficients in some of the datasets. However, for consistency, the scales were used in subsequent analyses because their respective items were inter-correlated in the expected direction, and their α coefficients were acceptable in most datasets.
For each dataset, outliers were identified by examining frequency distributions of standardised scores. Individuals with scores on any variable greater than 3 standard
deviations from the mean were excluded from analysis. Each dataset was also examined to see whether the participating employees were representative of the overall workplace composition, using workplace population statistics provided by the host organization to provide the expected cell counts for a chi-squared (Χ2) test.
3.1 Participants
Overall, the participants in this study were generally senior employees with more experience than the overall population at the host organization. This potential source of bias will be discussed below.
3.1.1 T1 dataset
E-mail invitations were sent to 207 employees at T1. Data were collected from 87 participants (3 incomplete surveys), yielding a response rate of 40.5%. After identifying and deleting three outliers, the final sample size was 81 for the T1 dataset. However, window location was unknown for six respondents.
Table 4 summarizes the T1 sample and the comparison to the workplace population. Findings revealed that the T1 sample had been employed by the host organization for a longer time than the overall workplace population.
Table 4. T1 sample characteristics.
Lighting Control
Window Proximity No Yes
Window 6 36 Aisle 2 3 12 Aisle 3-5 6 12 Location missing 3 3 T1 Sample % Population % Sex female 57 47 male 43 53 Χ2 (1) 3.12 Age 20-30 12 18 31-40 32 36 41-50 32 27 51-60 20 18 over 60 4 1 Χ2 (4) 8.62 Job Type administrative 25 22 technical 19 11 professional 35 47 managerial 21 20 Χ2 (3) 7.43 Tenure at host 0-1 15 10 2-5 21 27 5-10 16 10 11-15 19 32 16-20 7 7 20+ 22 14 Χ2 (5) 14.46* Note. N = 81. * p<=.05. ** p<=.01. *** p<=.001. 3.1.2 T2 dataset.
revealed that the T2 sample was older, had lower job status, and more tenure compared to the overall workplace population.
Table 5. T2 sample characteristics.
Lighting Control
Window Proximity No Yes
Window 8 37 Aisle 2 2 14 Aisle 3-5 4 8 Location missing 1 4 T2 Sample % Population % Sex female 53 47 male 47 53 Χ2 (1) 0.97 Age 20-30 11 18 31-40 31 36 41-50 28 27 51-60 22 18 over 60 8 1 Χ2 (4) 38.00*** Job Type administrative 29 22 technical 19 11 professional 32 47 managerial 19 20 Χ2 (3) 10.52* Tenure at host 0-1 15 10 2-5 18 27 5-10 13 10 11-15 22 32 16-20 6 7 20+ 26 14 Χ2 (5) 15.38** Note. N = 78. * p<=.05. ** p<=.01. *** p<=.001. 3.1.3 T3 dataset.
E-mail invitations were sent to 189 employees at T3. Data were collected from 91 participants (3 incomplete), yielding a response rate of 46.5%. After identifying and deleting two outliers, the final sample size was 86 for the T3 dataset. Workstation location was unknown for 11 participants. As shown in Table 6, Χ2 Goodness-of-Fit tests revealed that the T3 sample was older than the overall workplace population.
Table 6. T3 sample characteristics.
Lighting Control
Window Proximity No Yes
Window 10 40 Aisle 2 3 10 Aisle 3-5 6 6 Location missing 1 10 T3 Sample % Population % Sex female 53 47 male 47 53 Χ2 (1) 0.23 Age 20-30 11 18 31-40 26 36 41-50 33 27 51-60 23 18 over 60 7 1 Χ2 (4) 37.56*** Job Type administrative 27 22 technical 16 11 professional 32 47 managerial 25 20 Χ2 (3) 7.72 Tenure at host 0-1 12 10 2-5 28 27 5-10 10 10 11-15 22 32 16-20 6 7 20+ 22 14 Χ2 (5) 7.11 Note. N = 86. * p<=.05. ** p<=.01. *** p<=.001. 3.1.4 BG dataset.
The BG participants were those who only participated in one survey administration, either at T1, T2, or T3. There were 45 BG participants in total, none of whom were identified as outliers; however, window proximity was unknown for three participants at T1 and three at T3. As shown in Table 7, Χ2 Goodness-of-Fit tests revealed that the BG sample had a higher proportion of females with less tenure compared to the overall workplace population.
Table 7. BG sample characteristics.
T1 T2 T3
Lighting Control Lighting Control Lighting Control
Window Proximity No Yes No Yes No Yes
Window 2 4 2 1 6 4 Aisle 2 1 2 0 2 2 2 Aisle 3-5 0 6 0 2 1 2 Location missing 2 1 0 0 0 3 BG Sample Population Sex % female 67 47 % male 33 53 Χ2 (1) 6.99** Age % 20-30 18 18 % 31-40 29 36 % 41-50 38 27 % 51-60 13 18 % over 60 2 1 Χ2 (4) 3.79 Job Type % administrative 24 22 % technical 18 11 % professional 40 47 % managerial 18 20 Χ2 (3) 2.58 Tenure at host % 0-1 18 10 % 2-5 33 27 % 5-10 11 10 % 11-15 16 32 %16-20 16 7 % 20+ 7 14 Χ2 (5) 13.68* Note. N = 45. * p<=.05. ** p<=.01. *** p<=.001. 3.1.5 RM dataset.
The RM participants were those who participated in more than one survey administration. There were 79 RM participants in total, but six were identified as outliers. After deleting the outliers, the total sample size was 73, although window proximity was unknown for three participants. As shown in Table 8, Χ2 Goodness-of-Fit tests revealed that the RM sample was older, had fewer professionals, and were more tenured as compared to the overall workplace population.
Table 8. RM sample characteristics.
Lighting Control
Window Proximity No Yes
Window 4 41 Aisle 2 2 13 Aisle 3-5 4 6 Location missing 2 1 RM Sample % Population % Sex % female 49 47 % male 51 53 Χ2 (1) 0.16 Age % 20-30 12 18 % 31-40 32 36 % 41-50 29 27 % 51-60 19 18 % over 60 8 1 Χ2 (4) 39.90*** Job Type % administrative 25 22 % technical 19 11 % professional 33 47 % managerial 23 20 Χ2 (3) 8.17* Tenure at host % 0-1 15 10 % 2-5 19 27 % 5-10 15 10 % 11-15 19 32 %16-20 4 7 % 20+ 27 14 Χ2 (5) 19.39** Note. N = 73. * p<=.05. ** p<=.01. *** p<=.001.
We also compared the RM participants to the T1 and T2 participants who did not continue (those in the BG groups for those times). Participants who dropped out were not significantly different from those who remained in the study.
3.2 Office Lighting Appraisals
The OLS was used to measure office lighting appraisals. In this section, Pearson Χ2 tests were used to test for differences in the pattern of OLS responses across experimental groups. Particularly, the tables of responses for personal control over lighting conditions (control vs. no control), and then for window proximity conditions (window row vs. aisle 2 vs. aisle 3-5) were examined. In addition, Χ2 Goodness-of-Fit tests were used to compare the results for each of the above experimental groups against the normative data. The
normative values were used as the expected values, and the difference between the observed and the expected values was tested. OLS data from T1, T2, and T3 were each analyzed.
comfortable. Similarly, a smaller proportion of participants with control compared to those without control and to the normative data agreed that the lighting was uncomfortably bright (5% vs. 22% vs. 16%) and poorly distributed (11% vs. 22% vs. 25%). Likewise, 65% of those with control compared to 11% without control and 22% of the normative data agreed that lighting was better than lighting in similar workplaces in other buildings. Participants without control responded similarly to the normative data, except in regards to flicker: 22% of participants without control compared to 4% of the normative data agreed that the lights flicker throughout the day.
Table 9. T1 OLS appraisals by personal control over lighting.
1. Overall, the lighting is comfortable.
Between-Groups
Norm: 69% Agree Χ2(1) = 3.98*
Control Count of total 57 of 63
% Agree 90
Χ2
(1) 13.59***
No control Count of total 13 of 18
% Agree 72
Χ2(1) 0.09
2. The lighting is uncomfortably bright for the tasks that I perform.
Between-Groups
Norm: 16% Agree Χ2(1) = 5.41*
Control Count of total 3 of 63
% Agree 5
Χ2
(1) 5.92*
No control Count of total 4 of 18
% Agree 22
Χ2(1) 0.52
3. The lighting is uncomfortably dim for the tasks that I perform.
Between-Groups
Norm: 14% Agree Χ2(1) = 1.89
Control Count of total 4 of 63
% Agree 6
Χ2(1) 3.06
No control Count of total 3 of 18
% Agree 17
Χ2
(1) 0.11 4. The lighting is poorly distributed here.
Between-Groups
Norm: 25% Agree Χ2(1) = 1.47*
Control Count of total 7 of 63
% Agree 11
Χ2(1) 6.48*
No control Count of total 4 of 18
% Agree 22
Χ2
5. The lighting causes deep shadows.
Between-Groups
Norm: 15% Agree Χ2(1) = 0.02
Control Count of total 4 of 63
% Agree 6
Χ2
(1) 3.70
No control Count of total 1 of 18
% Agree 6
Χ2(1) 1.26
6. Reflections from the light fixtures hinder my work.
Between-Groups
Norm: 19% Agree Χ2(1) = 14.73***
Control Count of total 0 of 63
% Agree 0
Χ2
(1) 0
No control Count of total 4 of 18
% Agree 22
Χ2(1) 0.12
7. The light fixtures are too bright.
Between-Groups
Norm: 14% Agree Χ2(1) = 1.89
Control Count of total 4 of 63
% Agree 6
Χ2(1) 3.06
No control Count of total 3 of 18
% Agree 17
Χ2
(1) 0.11 8. My skin is an unnatural tone under the lighting.
Between-Groups
Norm: 9% Agree Χ2(1) = 0.02
Control Count of total 4 of 63
% Agree 6
Χ2(1) 0.54
No control Count of total 1 of 18
% Agree 6
Χ2
(1) 0.26 9. The lights flicker throughout the day.
Between-Groups
Norm: 4% Agree Χ2(1) = 10.29**
Control Count of total 1 of 63
% Agree 2
Χ2
(1) 0.96
No control Count of total 4 of 18
% Agree 22
10. How does the lighting compare to similar workplaces in other buildings?
Between-Groups
Norm: 19% worse – 60% same – 22% better Χ2(2) = 18.81***
Worse Same Better
Control Count 3 of 63 19 of 63 41 of 63
% 5 30 65
Χ2
(2) 69.90***
No control Count of total 5 of 18 11 of 18 2 of 18
% 28 61 11
Χ2(2) 1.72
Note. * p<=.05. ** p<=.01. *** p<=.001.
Table 10 shows that workstations located in a window row yielded more positive lighting appraisals overall. A larger proportion of window row participants compared to the normative data agreed that the lighting was comfortable (90% vs. 69%) and better than lighting in similar workplaces in other buildings (57% vs. 22%). Similarly, a smaller proportion of window row participants compared to the normative data agreed that the lighting was uncomfortably bright (5% vs. 16%) and hindered work (2% vs. 19%). Although a larger proportion of window row participants had more positive lighting appraisals compared to aisle 2-5 participants, the differences were not significant. Aisle 2-5 participants
responded similarly to the normative data with one exception: 61% of aisle 3-5 participants compared to 22% of the normative data agreed that the lighting was better than lighting in similar workplaces in other buildings.
Table 10. T1 OLS appraisals by window proximity.
1. Overall, the lighting is comfortable.
Between-Groups
Norm: 69% Agree Χ2(2) = 1.17
Window row Count of total 38 of 42
% Agree 90
Χ2
(1) 9.06**
Aisle 2 Count of total 12 of 15
% Agree 80
Χ2(1) 0.85
Aisle 3-5 Count of total 16 of 18
% Agree 89
Χ2
(1) 3.33 2. The lighting is uncomfortably bright for the tasks that I perform.
Between-Groups
Norm: 16% Agree Χ2(2) = 2.47
Window row Count of total 2 of 42
% Agree 5
Χ2(1) 3.95*
Aisle 2 Count of total 1 of 15
% Agree 7
Χ2(1) 0.97
Aisle 3-5 Count of total 3 of 18
% Agree 17
Χ2
3. The lighting is uncomfortably dim for the tasks that I perform.
Between-Groups
Norm: 14% Agree Χ2(2) = 2.37
Window row Count of total 3 of 42
% Agree 7
Χ2
(1) 1.64
Aisle 2 Count of total 2 of 15
% Agree 13
Χ2(1) 0.01
Aisle 3-5 Count of total 0 of 18
% Agree 0
Χ2
(1) 0 4. The lighting is poorly distributed here.
Between-Groups
Norm: 25% Agree Χ2(2) = 0.11
Window row Count of total 6 of 42
% Agree 14
Χ2(1) 2.57
Aisle 2 Count of total 2 of 15
% Agree 13
Χ2(1) 1.09
Aisle 3-5 Count of total 2 of 18
% Agree 11
Χ2(1) 1.85
5. The lighting causes deep shadows.
Between-Groups
Norm: 15% Agree Χ2(2) = 1.34
Window row Count of total 3 of 42
% Agree 7
Χ2(1) 2.03
Aisle 2 Count of total 1 of 15
% Agree 7
Χ2
(1) 0.82
Aisle 3-5 Count of total 0 of 18
% Agree 0
Χ2(1) 0
6. Reflections from the light fixtures hinder my work.
Between-Groups
Norm: 19% Agree Χ2(2) = 3.28
Window row Count of total 1 of 42
% Agree 2
Χ2(1) 7.54**
Aisle 2 Count of total 0 of 15
% Agree 0
Χ2(1) 0
Aisle 3-5 Count of total 2 of 18
% Agree 11
Χ2
7. The light fixtures are too bright.
Between-Groups
Norm: 14% Agree Χ2(2) = 4.70
Window row Count of total 2 of 42
% Agree 5
Χ2
(1) 2.98
Aisle 2 Count of total 1 of 15
% Agree 7
Χ2(1) 0.67
Aisle 3-5 Count of total 4 of 18
% Agree 22
Χ2
(1) 1.01 8. My skin is an unnatural tone under the lighting.
Between-Groups
Norm: 9% Agree Χ2(2) = 0.08
Window row Count of total 2 of 42
% Agree 5
Χ2(1) 0.92
Aisle 2 Count of total 1 of 15
% Agree 7
Χ2(1) 0.10
Aisle 3-5 Count of total 1 of 18
% Agree 6
Χ2(1) 0.26
9. The lights flicker throughout the day.
Between-Groups
Norm: 4% Agree Χ2(2) = 0.08
Window row Count of total 2 of 42
% Agree 5
Χ2(1) 0.06
Aisle 2 Count of total 1 of 15
% Agree 7
Χ2
(1) 0.28
Aisle 3-5 Count of total 1 of 18
% Agree 6
Χ2(1) 0.11
10. How does the lighting compare to similar workplaces in other buildings?
Between-Groups
Norm: 19% worse – 60% same – 22% better Χ2(4) = 3.97
Worse Same Better
Window row Count 3 of 42 15 of 42 24 of 42
% 7 36 57
Χ2(2) 31.11***
Aisle 2 Count of total 3 of 15 7 of 15 5 of 15
% 20 47 33
Χ2(2) 1.34
Aisle 3-5 Count of total 2 of 18 5 of 18 11 of 18
% 11 28 61
Χ2
(2) 16.38***
Note. * p<=.05. ** p<=.01. *** p<=.001.
3.2.2 T2 results.
Similarly to T1, T2 results revealed that personal control over lighting yielded more positive lighting appraisals overall (see Table 11). A larger proportion of participants with
control compared to the normative data agreed that the lighting was comfortable (95% vs. 69%) and better than lighting in similar workplaces in other buildings (66% vs. 22%). Likewise, a smaller proportion of participants with control compared to the normative data agreed that the lighting was uncomfortably bright (5% vs. 16%), poorly distributed (6% vs. 25%), caused deep shadows (2% vs. 15%), hindered work (5% vs. 19%), was too bright (2% vs. 14%), and caused unnatural skin tones (2% vs. 9%). Although a larger proportion of participants with control compared to those without control had more positive lighting
appraisals, results revealed only one significant between-groups difference: 66% of participants with control compared to 20% of participants without control agreed that the lighting was better than lighting in similar workplaces in other buildings. Participants without control responded similarly to the normative data.
Table 11. T2 OLS appraisals by personal control over lighting.
1. Overall, the lighting is comfortable.
Between-Groups
Norm: 69% Agree Χ2(1) = 1.48
Control Count of total 60 of 63
% Agree 95
Χ2
(1) 20.23***
No control Count of total 13 of 15
% Agree 87
Χ2(1) 2.19
2. The lighting is uncomfortably bright for the tasks that I perform.
Between-Groups
Norm: 16% Agree Χ2(1) = 0.09
Control Count of total 3 of 63
% Agree 5
Χ2
(1) 5.92*
No control Count of total 1 of 15
% Agree 7
Χ2(1) 0.97
3. The lighting is uncomfortably dim for the tasks that I perform.
Between-Groups
Norm: 14% Agree Χ2(1) = 0.00
Control Count of total 4 of 63
% Agree 6
Χ2(1) 3.06
No control Count of total 1 of 15
% Agree 7
Χ2(1) 0.67
4. The lighting is poorly distributed here.
Between-Groups
Norm: 25% Agree Χ2(1) = 2.76
Control Count of total 4 of 63
% Agree 6
Χ2(1) 11.69**
No control Count of total 3 of 15
% Agree 20
Χ2
5. The lighting causes deep shadows.
Between-Groups
Norm: 15% Agree Χ2(1) = 1.36
Control Count of total 1 of 62
% Agree 2
Χ2
(1) 8.72**
No control Count of total 1 of 14
% Agree 7
Χ2(1) 0.68
6. Reflections from the light fixtures hinder my work.
Between-Groups
Norm: 19% Agree Χ2(1) = 0.09
Control Count of total 3 of 63
% Agree 5
Χ2
(1) 8.30**
No control Count of total 1 of 15
% Agree 7
Χ2(1) 1.48
7. The light fixtures are too bright.
Between-Groups
Norm: 14% Agree Χ2(1) = 4.52
Control Count of total 1 of 63
% Agree 2
Χ2(1) 8.06**
No control Count of total 2 of 15
% Agree 13
Χ2
(1) 0.01 8. My skin is an unnatural tone under the lighting.
Between-Groups
Norm: 9% Agree Χ2(1) = 4.52
Control Count of total 1 of 63
% Agree 2
Χ2(1) 4.23*
No control Count of total 2 of 15
% Agree 13
Χ2
(1) 0.34 9. The lights flicker throughout the day.
Between-Groups
Norm: 4% Agree Χ2(1) = 4.12
Control Count of total 0 of 63
% Agree 0
Χ2
(1) 0
No control Count of total 1 of 15
% Agree 7
10. How does the lighting compare to similar workplaces in other buildings?
Between-Groups
Norm: 19% worse – 60% same – 22% better Χ2(2) = 12.43**
Worse Same Better
Control Count 1 of 62 20 of 62 41 of 62
% 2 32 66
Χ2
(2) 73.42***
No control Count of total 2 of 15 10 of 15 3 of 15
% 13 67 20
Χ2(2) 0.39
Note. * p<=.05. ** p<=.01. *** p<=.001.
In terms of window proximity, T2 results were also similar to those observed at T1. That is, workstations located in a window row yielded more positive lighting appraisals overall (see Table 12). A larger proportion of window row participants compared to the normative data agreed that the lighting was comfortable (98% vs. 69%) and better than lighting in similar workplaces in other buildings (62% vs. 22%). Similarly, a smaller proportion of window row participants compared to the normative data agreed that the lighting was uncomfortably bright (2% vs. 16%), uncomfortably dim (2% vs. 14%), poorly distributed (7% vs. 25%), hindered work (4% vs. 19%), and was too bright (2% vs. 14%). Only one significant between-groups difference was observed wherein 25% of aisle 3-5 participants compared to 0% in aisle 2 and 2% in the window row agreed that the lighting was uncomfortably bright for the tasks that they perform. Aisle 2-5 participants responded similarly to the normative data.
Table 12. T2 OLS appraisals by window proximity.
1. Overall, the lighting is comfortable.
Between-Groups
Norm: 69% Agree Χ2(2) = 3.84
Window row Count of total 44 of 45
% Agree 98
Χ2
(1) 17.42***
Aisle 2 Count of total 15 of 16
% Agree 94
Χ2(1) 4.58*
Aisle 3-5 Count of total 10 of 12
% Agree 83
Χ2
(1) 1.15 2. The lighting is uncomfortably bright for the tasks that I perform.
Between-Groups
Norm: 16% Agree Χ2(2) = 10.69**
Window row Count of total 1 of 45
% Agree 2
Χ2(1) 6.36*
Aisle 2 Count of total 0 of 16
% Agree 0
Χ2(1) 0
Aisle 3-5 Count of total 3 of 12
% Agree 25
3. The lighting is uncomfortably dim for the tasks that I perform.
Between-Groups
Norm: 14% Agree Χ2(2) = 2.63
Window row Count of total 1 of 45
% Agree 2
Χ2
(1) 5.19*
Aisle 2 Count of total 2 of 16
% Agree 13
Χ2(1) 0.03
Aisle 3-5 Count of total 1 of 12
% Agree 8
Χ2
(1) 0.32 4. The lighting is poorly distributed here.
Between-Groups
Norm: 25% Agree Χ2(2) = 1.69
Window row Count of total 3 of 45
% Agree 7
Χ2(1) 8.07**
Aisle 2 Count of total 2 of 16
% Agree 13
Χ2(1) 1.33
Aisle 3-5 Count of total 0 of 12
% Agree 0
Χ2(1) 0
5. The lighting causes deep shadows.
Between-Groups
Norm: 15% Agree Χ2(2) = 3.49
Window row Count of total 0 of 43
% Agree 0
Χ2(1) 0
Aisle 2 Count of total 1 of 16
% Agree 6
Χ2
(1) 0.96
Aisle 3-5 Count of total 0 of 12
% Agree 0
Χ2(1) 0
6. Reflections from the light fixtures hinder my work.
Between-Groups
Norm: 19% Agree Χ2(2) = 0.30
Window row Count of total 2 of 45
% Agree 4
Χ2(1) 6.20*
Aisle 2 Count of total 1 of 16
% Agree 6
Χ2(1) 1.69
Aisle 3-5 Count of total 1 of 12
% Agree 8
Χ2
7. The light fixtures are too bright.
Between-Groups
Norm: 14% Agree Χ2(2) = 5.89
Window row Count of total 1 of 45
% Agree 2
Χ2
(1) 5.19*
Aisle 2 Count of total 0 of 16
% Agree 0
Χ2(1) 0
Aisle 3-5 Count of total 2 of 12
% Agree 17
Χ2
(1) 0.07 8. My skin is an unnatural tone under the lighting.
Between-Groups
Norm: 9% Agree Χ2(2) = 3.79
Window row Count of total 1 of 45
% Agree 2
Χ2(1) 2.52
Aisle 2 Count of total 2 of 16
% Agree 13
Χ2(1) 0.24
Aisle 3-5 Count of total 0 of 12
% Agree 0
Χ2(1) 0
9. The lights flicker throughout the day.
Between-Groups
Norm: 4% Agree Χ2(2) = 3.49
Window row Count of total 0 of 43
% Agree 0
Χ2(1) 0
Aisle 2 Count of total 1 of 16
% Agree 6
Χ2
(1) 0.21
Aisle 3-5 Count of total 0 of 12
% Agree 0
Χ2(1) 0
10. How does the lighting compare to similar workplaces in other buildings?
Between-Groups
Norm: 19% worse – 60% same – 22% better Χ2(4) = 2.54
Worse Same Better
Window row Count 1 of 45 16 of 45 28 of 45
% 2 36 62
Χ2(2) 44.98***
Aisle 2 Count of total 1 of 16 8 of 16 7 of 16
% 6 50 44
Χ2(2) 5.13
Aisle 3-5 Count of total 1 of 12 5 of 12 6 of 12
% 8 42 50
Χ2
(2) 5.73
compared to those without control and to the normative data agreed that the lighting was comfortable (94% vs. 75% vs. 69%) and better than lighting in similar workplaces in other buildings (57% vs. 25% vs. 22%). Likewise, a smaller proportion of participants with control compared to those without control and to the normative data agreed that the lighting was uncomfortably bright (3% vs. 20% vs. 16%), poorly distributed (12% vs. 35% vs. 25%), and too bright (2% vs. 20% vs. 14%). Also, a smaller proportion of participants with control compared to the normative data agreed that lighting caused deep shadows (6% vs. 15%) and hindered work (5% vs. 19%). Participants without control responded similarly to the normative data.
Table 13. T3 OLS appraisals by personal control over lighting.
1. Overall, the lighting is comfortable.
Between-Groups
Norm: 69% Agree Χ2(1) = 5.88*
Control Count of total 62 of 66
% Agree 94
Χ2
(1) 19.19***
No control Count of total 15 of 20
% Agree 75
Χ2(1) 0.34
2. The lighting is uncomfortably bright for the tasks that I perform.
Between-Groups
Norm: 16% Agree Χ2(1) = 6.81**
Control Count of total 2 of 66
% Agree 3
Χ2
(1) 8.26**
No control Count of total 4 of 20
% Agree 20
Χ2(1) 0.24
3. The lighting is uncomfortably dim for the tasks that I perform.
Between-Groups
Norm: 14% Agree Χ2(1) = 0.83
Control Count of total 8 of 66
% Agree 12
Χ2(1) 0.19
No control Count of total 1 of 20
% Agree 5
Χ2
(1) 1.35 4. The lighting is poorly distributed here.
Between-Groups
Norm: 25% Agree Χ2(1) = 5.58*
Control Count of total 8 of 66
% Agree 12
Χ2(1) 5.84*
No control Count of total 7 of 20
% Agree 35
Χ2
5. The lighting causes deep shadows.
Between-Groups
Norm: 15% Agree Χ2(1) = 1.64
Control Count of total 4 of 66
% Agree 6
Χ2
(1) 4.14*
No control Count of total 3 of 20
% Agree 15
Χ2(1) 0.00
6. Reflections from the light fixtures hinder my work.
Between-Groups
Norm: 19% Agree Χ2(1) = 0.83
Control Count of total 3 of 66
% Agree 5
Χ2
(1) 8.96**
No control Count of total 2 of 20
% Agree 10
Χ2(1) 1.05
7. The light fixtures are too bright.
Between-Groups
Norm: 14% Agree Χ2(1) = 9.58**
Control Count of total 1 of 66
% Agree 2
Χ2(1) 8.54**
No control Count of total 4 of 20
% Agree 20
Χ2
(1) 0.60 8. My skin is an unnatural tone under the lighting.
Between-Groups
Norm: 9% Agree Χ2(1) = 1.78
Control Count of total 6 of 66
% Agree 9
Χ2(1) 0.00
No control Count of total 4 of 20
% Agree 20
Χ2
(1) 2.96 9. The lights flicker throughout the day.
Between-Groups
Norm: 4% Agree Χ2(1) = 3.34
Control Count of total 0 of 66
% Agree 0
Χ2
(1) 0
No control Count of total 1 of 20
% Agree 5
10. How does the lighting compare to similar workplaces in other buildings?
Between-Groups
Norm: 19% worse – 60% same – 22% better Χ2(2) = 17.87***
Worse Same Better
Control Count 2 of 65 26 of 65 37 of 65
% 3 40 57
Χ2
(2) 49.53***
No control Count of total 7 of 20 8 of 20 5 of 20
% 35 40 25
Χ2(2) 4.15
Note. * p<=.05. ** p<=.01. *** p<=.001.
Also consistent with T1 and T2, workstations located in a window row yielded more positive lighting appraisals at T3 (see Table 14). A larger proportion of window row
participants compared to the normative data agreed that the lighting was comfortable (92% vs. 69%) and better than lighting in similar workplaces in other buildings (54% vs. 22%). Also, a smaller proportion of window row participants compared to the normative data agreed that the lighting was uncomfortably bright (4% vs. 16%), hindered work (2% vs. 19%), and was too bright (2% vs. 14%). Two significant between-groups differences were observed: 2% of window row participants compared to 8% in aisle 2 and 25% in aisle 3-5 agreed that the reflections from the light hindered work; and 6% of window row participants compared to 31% in aisle 2 and 25% in aisle 3-5 agreed that lighting caused unnatural skin tones. Aisle 2-5 participants responded similarly to the normative data with one exception: 31% of aisle 2 participants compared to 9% of the normative data agreed that lighting caused unnatural skin tones.
Table 14. T3 OLS appraisals by window proximity.
1. Overall, the lighting is comfortable.
Between-Groups
Norm: 69% Agree Χ2(2) = 3.08
Window row Count of total 46 of 50
% Agree 92
Χ2
(1) 12.37***
Aisle 2 Count of total 12 of 13
% Agree 92
Χ2(1) 3.30
Aisle 3-5 Count of total 9 of 12
% Agree 75
Χ2
(1) 0.20 2. The lighting is uncomfortably bright for the tasks that I perform.
Between-Groups
Norm: 16% Agree Χ2(2) = 2.52
Window row Count of total 2 of 50
% Agree 4
Χ2(1) 5.36*
Aisle 2 Count of total 1 of 13
% Agree 8
Χ2(1) 0.67
Aisle 3-5 Count of total 2 of 12
% Agree 17
3. The lighting is uncomfortably dim for the tasks that I perform.
Between-Groups
Norm: 14% Agree Χ2(2) = 2.54
Window row Count of total 4 of 50
% Agree 8
Χ2
(1) 1.50
Aisle 2 Count of total 3 of 13
% Agree 23
Χ2(1) 0.89
Aisle 3-5 Count of total 1 of 12
% Agree 8
Χ2
(1) 0.32 4. The lighting is poorly distributed here.
Between-Groups
Norm: 25% Agree Χ2(2) = 0.39
Window row Count of total 9 of 50
% Agree 18
Χ2(1) 1.31
Aisle 2 Count of total 3 of 13
% Agree 23
Χ2(1) 0.03
Aisle 3-5 Count of total 3 of 12
% Agree 25
Χ2(1) 0.00
5. The lighting causes deep shadows.
Between-Groups
Norm: 15% Agree Χ2(2) = 4.18
Window row Count of total 3 of 50
% Agree 6
Χ2(1) 3.18
Aisle 2 Count of total 1 of 13
% Agree 8
Χ2
(1) 0.54
Aisle 3-5 Count of total 3 of 12
% Agree 25
Χ2(1) 0.94
6. Reflections from the light fixtures hinder my work.
Between-Groups
Norm: 19% Agree Χ2(2) = 8.25*
Window row Count of total 1 of 50
% Agree 2
Χ2(1) 9.39**
Aisle 2 Count of total 1 of 13
% Agree 8
Χ2(1) 1.09
Aisle 3-5 Count of total 3 of 12
% Agree 25
Χ2
7. The light fixtures are too bright.
Between-Groups
Norm: 14% Agree Χ2(2) = 4.30
Window row Count of total 1 of 50
% Agree 2
Χ2
(1) 5.98*
Aisle 2 Count of total 1 of 13
% Agree 8
Χ2(1) 0.43
Aisle 3-5 Count of total 2 of 12
% Agree 17
Χ2
(1) 0.07 8. My skin is an unnatural tone under the lighting.
Between-Groups
Norm: 9% Agree Χ2(2) = 7.16*
Window row Count of total 3 of 50
% Agree 6
Χ2(1) 0.55
Aisle 2 Count of total 4 of 13
% Agree 31
Χ2(1) 7.52**
Aisle 3-5 Count of total 3 of 12
% Agree 25
Χ2(1) 3.75
9. The lights flicker throughout the day.
Between-Groups
Norm: 4% Agree Χ2(2) = 5.32
Window row Count of total 0 of 50
% Agree 0
Χ2(1) 0
Aisle 2 Count of total 0 of 13
% Agree 0
Χ2
(1) 0
Aisle 3-5 Count of total 1 of 12
% Agree 8
Χ2(1) 0.59
10. How does the lighting compare to similar workplaces in other buildings?
Between-Groups
Norm: 19% worse – 60% same – 22% better Χ2(4) = 7.68
Worse Same Better
Window row Count 2 of 50 21 of 50 27 of 50
% 4 42 54
Χ2(2) 32.20***
Aisle 2 Count of total 3 of 13 4 of 13 6 of 13
% 23 31 46
Χ2(2) 5.47
Aisle 3-5 Count of total 3 of 11 4 of 11 4 of 11
% 27 36 36
Χ2
(2) 2.48