Anthropogenic Lead Emissions in the
Ocean: The Evolving Global Experiment
The MIT Faculty has made this article openly available.
Please share
how this access benefits you. Your story matters.
Citation
Boyle, Edward, Jong-Mi Lee, Yolanda Echegoyen, Abigail Noble,
Simone Moos, Gonzalo Carrasco, Ning Zhao, et al. “Anthropogenic
Lead Emissions in the Ocean: The Evolving Global Experiment.”
Oceanography 27, no. 1 (March 1, 2014): 69–75. © 2014 The
Oceanography Society
As Published
http://dx.doi.org/10.5670/oceanog.2014.10
Publisher
Oceanography Society
Version
Final published version
Citable link
http://hdl.handle.net/1721.1/87593
Terms of Use
Article is made available in accordance with the publisher's
policy and may be subject to US copyright law. Please refer to the
publisher's site for terms of use.
CITATION
Boyle, E.A., J.-M. Lee, Y. Echegoyen, A. Noble, S. Moos, G. Carrasco, N. Zhao, R. Kayser, J. Zhang, T. Gamo, H. Obata, and K. Norisuye. 2014. Anthropogenic lead emissions in the ocean: The evolving global experiment. Oceanography 27(1):69–75, http://dx.doi.org/10.5670/oceanog.2014.10.
DOI
http://dx.doi.org/10.5670/oceanog.2014.10 COPYRIGHT
This article has been published in Oceanography, Volume 27, Number 1, a quarterly journal of The Oceanography Society. Copyright 2014 by The Oceanography Society. All rights reserved. USAGE
Permission is granted to copy this article for use in teaching and research. Republication, systematic reproduction, or collective redistribution of any portion of this article by photocopy machine, reposting, or other means is permitted only with the approval of The Oceanography Society. Send all correspondence to: [email protected] or The Oceanography Society, PO Box 1931, Rockville, MD 20849-1931, USA.
O
ceanography
THE OFFICIAL MAGAZINE OF THE OCEANOGRAPHY SOCIETY
Oceanography
| March 2014 69Anthropogenic Lead Emissions
in the Ocean
B Y E D WA R D A . B O Y L E , J O N G - M I L E E , Y O L A N D A E C H E G O Y E N , A B I G A I L N O B L E , S I M O N E M O O S , G O N Z A L O C A R R A S C O , N I N G Z H A O , R I C H A R D K AY S E R , J I N G Z H A N G , T O S H I TA K A G A M O , H A J I M E O B ATA , A N D K A Z U H I R O N O R I S U Y ES P E C I A L I S S U E O N C H A N G I N G O C E A N C H E M I S T R Y »
A N T H R O P O C E N E : T H E F U T U R E … S O FA R
The Evolving Global Experiment
Oceanography
| March 2014 69 ABSTR ACT. We review the current distribution of lead and lead isotopes inthe ocean with regard to the evolving pattern of human emissions during the past decades and centuries.
the great “large scale geophysical experi-ments” whereby the human race alters the global environment and waits to observe the consequences (Revelle and Suess, 1957). Fortunately for the marine environment, lead emissions have not been high enough to cause harmful con-sequences in the open ocean. However, human and continental ecosystem health suffers the negative consequences of Pb emissions from a variety of sources that include lead-soldered cans; drinking
water from Pb-contaminated plumbing; lead components of paint on houses and other structures; paint scrapings and leaded gasoline consumption that con-taminates soils, including playgrounds and agricultural areas; and acute impacts from smelting, metal refining, and acid mine drainage (Nriagu and Pacyna, 1988). Studies of the fate of Pb in the open-ocean environment can be used to study ocean metal transport and reactiv-ity, just as harmless ocean fluorocarbons are used to trace and quantify ocean physical transport. Studies of the evolu-tion of the anthropogenic Pb transient in the ocean can also serve as an analogue
INTRODUCTION
Humans have increased the flux of reactive lead (Pb) into Earth’s surface environment by more than a factor of 10, as Caltech lead-research pioneer Clair Patterson, co-workers, and associ-ates pointed out in several cutting-edge publications (e.g., Murozumi et al., 1969; Shirahata et al., 1980; Schaule and Patterson, 1981; Flegal and Patterson, 1983). As such, this activity is, in the spirit of Roger Revelle’s words, one of
Boyle group at sea deploying the “weather-vaning” trace element sampler.
Oceanography
| Vol. 27, No. 1 70for other anthropogenic pollutants. Pb is a volatile element at high tem-peratures; it can be emitted as an atomic vapor when Pb-containing materials are heated to these temperatures. Pb is also emitted as reactive PbBrCl compounds upon the combustion of leaded gasoline. At low temperatures, Pb is not stable as a gas, and Pb atoms attach to the sur-faces of, or react chemically with, fine atmospheric aerosol particles (Cziczo et al., 2009). These particles are dispersed by the global atmospheric transport sys-tem and can travel to remote regions of Earth before they are deposited on land or the ocean surface (Reuer and Weiss, 2002). The residence time of atmospheric particles is short. Studies of the natural radioisotope 210Pb (Bacon et al., 1976;
Nozaki et al., 1976) show that the resi-dence time of Pb in the low-productivity waters of the central ocean gyres is about two years. Thus, surface water Pb concen-trations tend toward a steady state with atmospheric deposition fluxes during the previous few years, and Pb concen-trations in surface waters tend to follow recent deposition rates of contaminated atmospheric aerosols.
Patterns of lead production and utilization have been changing during the past two centuries, particularly for leaded gasoline consumption (Figure 1). As a result, we expect to see large tem-poral changes in Pb distribution in the ocean as anthropogenic sources wax
and wane and ocean circula-tion carries lead far from its deposition site.
Pb AND Pb
ISOTOPE SPATIAL AND TEMPOR AL VARIABILITY
During the last 10 years, the authors of this study have obtained Pb concentration and isotope ratio data from high-quality samples from almost all of the major ocean basins (North and South Atlantic, North and South Pacific, and Indian Ocean, including the Southern
Ocean), with the exception of the Arctic Ocean. Most of these data are yet to be published. Although we will include a nod to recent literature, in the fol-lowing discussion, any unreferenced data are from our yet-to-be-published work, and published work from our labs or others will be cited specifically. We will briefly summarize this work, showing that the impact of evolving anthropogenic Pb emissions on time scales of years through centuries can be seen in the Pb and Pb isotope composi-tion of the marine environment, either directly in seawater measurements or through the use of archive proxies that reflect past Pb changes in the ocean. As a result of the pervasive nature of Pb
contamination during sampling and analysis and the very low concentrations (sub-nanomolar) occurring in the ocean, there were no successful measurements of Pb in sea water prior to 1976 (Schaule and Patterson, 1981). So, it is only in the past four decades that we have direct observations on the evolution of anthro-pogenic Pb in the ocean. This period has seen reductions in Pb emissions in some regions (Japan, North America, and Europe) and rising Pb emissions in other regions (e.g., Southeast Asia). But, the history of significant environmental lead pollution extends throughout at least the past 200 years, and studies of Pb in annu-ally banded corals (e.g., Kelly et al., 2009) and laminated sediments (e.g., Lima et al., 2005) help provide century-scale perspective to three decades of seawater data. Our MIT lab has strived to develop highly efficient methods for the analysis of seawater Pb concentrations (Lee et al., 2011) and Pb isotope ratios (Reuer et al., 2003; Boyle et al., 2012) in small samples.
The North Atlantic Ocean was the region most heavily impacted by early industrializing economies, and Edward A. Boyle ([email protected]) is Professor, Jong-Mi Lee is a graduate student,
Yolanda Echegoyen was Postdoctoral Fellow, Abigail Noble is Postdoctoral Associate, Simone Moos is a graduate student, Gonzalo Carrasco is Postdoctoral Associate, Ning Zhao is a graduate student, and Richard Kayser is Research Specialist, all in the
Department of Earth, Atmosphere and Planetary Sciences, Massachusetts Institute of Technology, Cambridge, MA, USA. Jing Zhang is Professor, East China Normal University,
Shanghai, China. Toshitaka Gamo is Professor and Hajime Obata is Associate Professor,
University of Tokyo, Tokyo, Japan. Kazuhiro Norisuye is Associate Professor, Niigata
University, Niigata, Japan.
Figure 1. Gasoline lead consumption in the USA, Germany, France, United Kingdom, and Italy from 1930 through 1993. Note that the four European countries plotted account for ~ 70% of Western Europe gasoline consumption.
G asoline P b C onsumption (10 3 metr ic t ons yr –1) 1930 1940 1950 1960 1970 1980 1990 300 250 200 150 100 50 0 Year
Oceanography
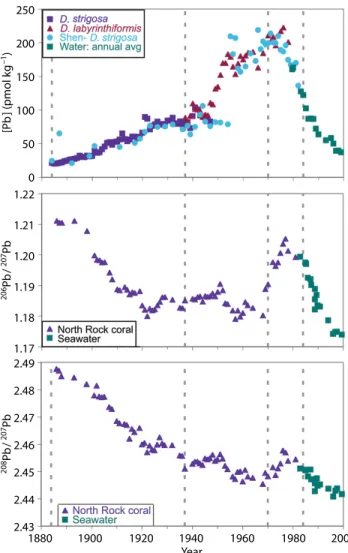
| March 2014 71there are far more studies of Pb in the North Atlantic Ocean than elsewhere. Beginning with the work of Schaule and Patterson (1983, on samples collected in 1979) through many other studies (Boyle et al., 1986; Shen and Boyle, 1987, 1988; Helmers et al., 1990, 1991; Helmers and van der Loeff, 1993; Veron et al., 1993, 1994, 1999; Hamelin et al., 1997; Wu and Boyle, 1997; Alleman et al., 1999; Weiss et al. 2003; Desfenant et al., 2006), we have significant information on the spatial and temporal variability of Pb in this ocean basin. Combining surface seawater observations near Bermuda with annually banded coral data, the century-scale temporal variability of Pb in the surface waters of the western North Atlantic can be seen in the data of Kelly et al. (2009) (Figure 2). This work combines data from three corals from the North Rock reef northeast of Bermuda island with annually averaged seawater data from near Bermuda from 1979–2000 (Hydrostation S, Bermuda Atlantic Time Series [BATS], and Bermuda Testbed Mooring, [BTM]).
Combined with data from another coral from the Southern Preserve, close to shore southeast of Bermuda island (see map in Kelly et al., 2009, data not shown here), we can describe Pb evolu-tion in the western North Atlantic sur-face waters. Pb in sursur-face waters began to rise from about 10 pmol kg–1 at the
beginning of the nineteenth century with the development of the US Upper Mississippi Valley lead district in the mid-1800s (Heyl et al., 1959) and the US industrial revolution, reaching a pla-teau of about 80 pmol kg–1 in the 1920s.
Seawater Pb concentrations began to soar in the late 1940s (Figure 2) with the end of World War II, rising US prosper-ity (“two cars in every garage” that ran on leaded gasoline), and, eventually,
European prosperity. Bermuda surface ocean lead levels peaked at more than 200 pmol kg–1 in the 1970s. The US Clean
Air Act of 1970 mandated catalytic con-verters to reduce atmospheric pollution, which required removal of tetraethyl Pb from gasoline because it poisoned the catalysts (Nriagu, 1989). Since then, western North Atlantic Pb concentrations have fallen continuously (Figure 2), with the lowest surface water Pb concentra-tions observed so far (17 pmol kg–1)
seen during the US GEOTRACES North Atlantic Transect cruise in November 2011 (recent work of authors Noble and Boyle).
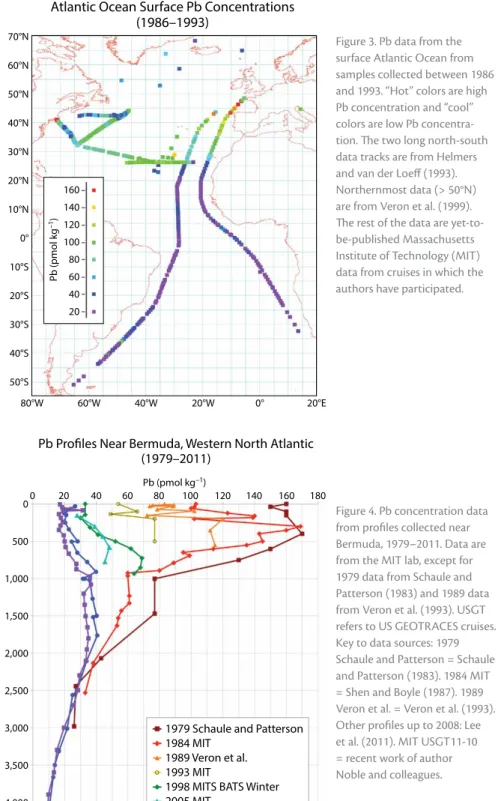
There is some spa-tial coverage of surface water Pb concentra-tions in the Atlantic Ocean. For example, during the period from 1986–1993 (Figure 3), the highest surface Pb concentra-tions during the past three decades occur in the subtropical gyre, downwind of both US and some European emissions. The atmo-sphere and North Atlantic Drift current carry that Pb north-ward where it is driven by wind (Ekman) pumping into the thermocline and winter cooling driving dense deep water for-mation during winter. South of the subtropi-cal/tropical boundary (~ 20°N), Pb concen-trations in the 1989– 1995 period rapidly
decrease to less than 20 pmol kg–1 and
occur at similar low levels all the way into the South Atlantic (e.g., Helmers and van der Loeff, 1993). Though not shown in Figure 3, there is an unusual peak in Pb concentration that occurs in the Atlantic coastal waters of southern Spain, where acid mine drainage from the Rio Tinto and Rio Odiel deliver water with Pb concentrations a million times more than measured in Atlantic surface waters (e.g., see van Geen et al., 1997). These high Pb levels flow into the Mediterranean Sea in the northern branch of the Gibraltar inflow (recent
1880 1900 1920 1940 1960 1980 2000 2.49 2.48 2.47 2.46 2.45 2.44 2.43 Year 208 Pb / 207 Pb 206 Pb / 207 Pb [P b ] (pmol kg –1) 1.22 1.21 1.20 1.19 1.18 1.17 250 200 150 100 50 0
Figure 2. Pb concentration and isotopic composition of Bermuda surface waters for the past 120 years (Kelly et al., 2009). Squares (1979–2000) represent annual averages of data from water samples. The other data are from three different coral cores, with Pb concentrations estimated from coral Pb/Ca converted by a partition coefficient as described by Kelly et al. (2009).
Oceanography
| Vol. 27, No. 1 72work of author Moos and author Boyle’s lab). Mediterranean surface water data from the 1980s shows very high values, up to 500 pmol kg–1, and in 1982 the
values from the deep Mediterranean that contribute to the Mediterranean Outflow
at Gibraltar are ~ 250 pmol kg–1 (recent
work of author Moos and colleagues). Thermocline ventilation and deep-water formation bring surface deep-waters into the ocean’s interior. In the North Atlantic, thermocline ventilation occurs
on time scales of years in the uppermost ocean to perhaps a century at 1,000 m (Jenkins, 1998). Near Bermuda, Pb profiles have been collected at roughly five-year intervals during the past 30 years (Figure 4). Waters that sank decades ago when surface Pb concen-trations were an order of magnitude higher are found at mid-depths, with a maximum occurring at ~ 400 m depth in 1979, deepening to 1–2 km in 2011. In addition to purely surface boundary/ advective-driven changes, it is likely that a component of the decrease in water column Pb is driven by scavenging onto sinking particles. The GEOTRACES program has obtained detailed sections of Pb in the Atlantic (GEOTRACES tracks GA02, GA03, and GA10; see map at http://www.bodc.ac.uk/geotraces/ cruises/section_maps/atlantic_ocean). A Pb maximum of > 60 pmol kg–1
is seen at ~ 1,000 m in the eastern North Atlantic in chlorofluorocarbon (CFC)-containing waters.
US gasoline dominantly used tetra-ethyl lead from the Ethyl Corporation that mainly relied on US Pb sources (with a 206Pb/207Pb ratio typically
> 1.17), whereas Europe dominantly used tetraethyl Pb from Associated Octel Ltd. that derived from Australian, Swedish, and Moroccan sources (with a 206Pb/207Pb ratio typically < 1.15; see
Grousset et al., 1994). The Pb isotope ratio of North Atlantic surface waters reflects the relative mixture of US and European sources, depending on total emissions, atmospheric wind patterns, and proximity. Westerlies dominate mid-latitude winds, and the United States used several times more Pb than Europe (Figure 1); hence, for a long time, high US 206Pb/207Pb ratios
domi-nated the North Atlantic (Weiss et al., 2003). But, as the United States phased
Figure 4. Pb concentration data from profiles collected near Bermuda, 1979–2011. Data are from the MIT lab, except for 1979 data from Schaule and Patterson (1983) and 1989 data from Veron et al. (1993). USGT refers to US GEOTRACES cruises. Key to data sources: 1979 Schaule and Patterson = Schaule and Patterson (1983). 1984 MIT = Shen and Boyle (1987). 1989 Veron et al. = Veron et al. (1993). Other profiles up to 2008: Lee et al. (2011). MIT USGT11-10 = recent work of author Noble and colleagues.
Pb (pmol kg–1) 0 500 1,000 1,500 2,000 2,500 3,000 3,500 4,000 4,500 D epth (m)
Pb Profiles Near Bermuda, Western North Atlantic (1979–2011)
0 20 40 60 80 100 120 140 160 180
1979 Schaule and Patterson 1984 MIT
1989 Veron et al. 1993 MIT
1998 MITS BATS Winter 2005 MIT
2008 MIT USGT08 2011 MIT USGT11–10
Atlantic Ocean Surface Pb Concentrations (1986–1993) 70°N 60°N 50°N 40°N 30°N 20°N 10°N 0° 10°S 20°S 30°S 40°S 50°S 80°W 60°W 40°W 20°W 0° 20°E Pb (pmol kg –1) 160 140 120 100 80 60 40 20
Figure 3. Pb data from the surface Atlantic Ocean from samples collected between 1986 and 1993. “Hot” colors are high Pb concentration and “cool” colors are low Pb concentra-tion. The two long north-south data tracks are from Helmers and van der Loeff (1993). Northernmost data (> 50°N) are from Veron et al. (1999). The rest of the data are yet-to-be-published Massachusetts Institute of Technology (MIT) data from cruises in which the authors have participated.
Oceanography
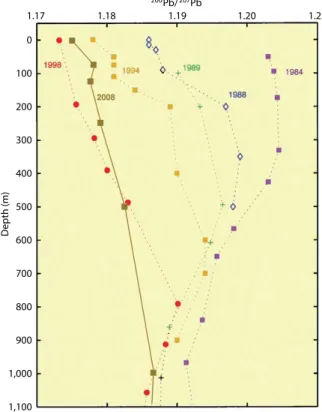
| March 2014 73out leaded gasoline faster than Europe (with a crossover in total Pb gas utiliza-tion in the early 1990s), the 206Pb/207Pb
ratio decreased in North Atlantic surface waters (Figure 2), and this lead reduc-tion influenced the upper ocean through thermocline ventilation (Figure 5).
Other factors affected surface Atlantic Pb isotope composition in previous decades. In 1973, a fire in the baghouse (dust-filtering system) at the Bunker Hill Pb smelter in Idaho, which produced 25–30% of US lead the time, resulted in particulate emissions that contami-nated the city of Kellogg, Idaho, and nearby communities with 1,000 tons of Pb and other toxic elements during a one-year period (Landrigan and Baker, 1981; Miller, 2000). The smelter shut down and became a US Environmental Protection Agency Superfund site. This Idaho smelter Pb had a lower 206Pb/207Pb
ratio (~ 1.15) than other US Pb sources (mainly Mississippi Valley), so the Pb isotope ratio of lead and leaded gasoline increased in the mid-1970s after the smelter was shut down. The consequence for rising Pb isotope ratios in US emis-sions is clearly illustrated in coral data (Figure 2). Another major influence on the Pb isotope record was the dominance of Upper Mississippi Valley lead in the middle of the nineteenth century. This deposit was easily worked and close to major water transport networks, so it was the all-but-exclusive source of Pb in the United States at that time (Lima et al., 2005). The smelting procedure (open charcoal fires) was rudimentary, with no emission controls. The emis-sions were transported downwind, and the influence of this Pb can be seen in sediments of the Great Lakes (Graney et al., 1995), Chesapeake Bay (Marcantonio et al., 2002), and offshore Rhode Island (Lima et al., 2005), as well
as in sediments from Canadian lakes in Quebec (Gobeil et al., 2013). This source of Pb has an unusual Pb isotope composition (206Pb/207Pb ~ 1.33 and 208Pb/207Pb ~ 2.51), so its influence also
can be seen in Bermuda coral records (Kelly et al., 2009). Its dominance as the US Pb source diminished in the latter nineteenth and early twentieth centuries, leading to decreasing 206Pb/207Pb and 208Pb/207Pb ratios into the early decades
of the twentieth century.
As a result of the evolving Pb iso-tope ratio of North Atlantic lead, some periods exhibit a unique Pb isotope ratio. For example, the Bermuda surface water 206Pb/207Pb ratio was ~ 1.19 and
the 208Pb/207Pb ratio was ~ 2.46 in the
1920s, which is the only time in the past 150 years where these ratios co-occurred. Hence, we have been able to identify lead that sank from the
sur-face of the North Atlantic Ocean in the 1920s in deep eastern Atlantic Ocean waters and in deep western South Atlantic waters near Rio de Janeiro.
There are fewer data on Pb in the North Pacific Ocean than in the North Atlantic, although it is still more data than is available elsewhere in the world. Schaule and Patterson (1981) obtained the first valid oceanic Pb data on samples collected in 1976. They observed Pb concentrations in surface samples near Hawaii of ~ 65 pmol kg–1. By the
late 1990s, Pb concentra-tions near Hawaii had declined by a factor of two (Boyle et al., 2005). But the
situation in the Pacific is not as simple as in the North Atlantic, where Pb emis-sions have been declining steadily for decades in almost all of the surrounding countries. Pb emissions by China and Southeast Asian countries have been increasing (dominantly derived from coal combustion, because Pb gasoline has not been used in China for the past 15 years; Flegal et al., 2013). Although there is scant older data for compari-son, Pb concentrations in the surface waters of the western North Pacific are quite high compared to those in the east (Gallon et al., 2011). To the extent that data are available in deep profiles from the North Pacific, any change in Pb concentration in the central North Pacific appears confined to the upper few hundred meters (Boyle et al., 2005, and confirming observations from SAFe and
0 100 200 300 400 500 600 700 800 900 1,000 1,100 D epth (m) 206Pb/207Pb
Bermuda Pb Isotope Profiles (1984–2008)
1.17 1.18 1.19 1.20 1.21
Figure 5. Pb isotope data from the upper 1,100 m from profiles near Bermuda, 1984–2008. Data from 1984 are from Shen and Boyle (1988), 1988 data from Sherrell et al. (1992), 1989 data from Veron et al. (1993), 1998 data from Reuer (2002) and Reuer et al. (2003), and 2008 data from Boyle et al. (2012).
Oceanography
| Vol. 27, No. 1 74GEOTRACES data in the eastern North Pacific [Wu et al., 2010; Ken Bruland, UC Santa Cruz, pers. comm., 2009, 2010; recent work of author Boyle’s lab]).
Data from the South Pacific Ocean are sparse; the only published data available are from the equatorial zone of the west-ern South Pacific (Flegal and Patterson, 1983; Wu et al., 2010), and author Boyle’s MIT laboratory has two yet-to-be-published profiles from the tropical southeastern Pacific. These profiles show Pb concentrations of 13–23 pmol kg–1
in the surface waters, decreasing to ~ 4 pmol kg–1 in the deep waters.
Pb concentrations from samples obtained during the 2009–2010 Japanese Indian Ocean GEOTRACES expedi-tion and analyzed at MIT (Internaexpedi-tional GEOTRACES track GI 04) show that the northern and central Indian Ocean now have higher surface Pb concentra-tions (40-80 pmol kg–1) than the North
Atlantic near Bermuda and the North Pacific near Hawaii. This is a result of the spurt of economic growth and industri-alization in this region, as well as a late phasing out of leaded gasoline compared to other parts of the world. The deep northern Indian Ocean has possibly the lowest seawater Pb concentration ever observed, 2 pmol kg–1. This is probably
the combined result of century-scale age (relative to the surface), plus scavenging of Pb along the flow path. Interestingly, there is a near-constant offset of the Pb isotope ratios throughout the water columns between the Bay of Bengal and Arabian Sea, even though the con-centrations are the same. Because the deep waters of both basins have similar ultimate origins in the Southern Ocean, some process along the way must change the isotopic composition without alter-ing the Pb concentration. This is a novel observation that needs further study.
In the nearby Persian Gulf, sea-water Pb concentrations range from ~ 100 pmol kg–1 near a major city
to 30 pmol kg–1 elsewhere. Peak and
phaseout of anthropogenic Pb in recent decades is observed in coral core records (recent work of author Zhao and colleagues).
Pb concentrations in the Indian Ocean sector of the Southern Ocean are relatively uniform and low, 5–12 pmol kg–1. The Pb isotope ratio
of the deep Southern Ocean profile is
206Pb/207Pb 1.18–1.19, suggesting that
a significant fraction of the Pb may be of natural crustal origin (~ 1.20, because anthropogenic Pb aerosols in the Southern Hemisphere are
206Pb/207Pb ~ 1.16 or lower; Bollhöfer
and Rosman, 2000).
CONCLUSIONS
Human emissions of Pb into the atmo-sphere have altered the Pb concentration and isotope composition of a large frac-tion of the ocean. Pb levels in surface waters have been changing in line with regional emissions, with North Atlantic Pb levels increasing from ~1830 to ~1975 and decreasing since then. Pb concentra-tions in the Atlantic thermocline reflect the decreasing surface water concentra-tions of the ventilating waters. Pb has decreased near Hawaii, but increased emissions from China paint a different story in the western Pacific. Recent eco-nomic development and a late phaseout of leaded gasoline in India, Indonesia, China, and some other southern Asian countries have led to relatively high con-centrations in the northern and central Indian Ocean. The isotope composition of deep Antarctic waters in the Indian sector may indicate a significant contri-bution of natural crustal Pb in addition to recent anthropogenic sources.
ACKNOWLEDGEMENTS
This work was funded by grants from the US National Science Foundation (OCE-1233749 to MIT and Z792093-06 to the University of Hawaii), Singapore National Research Foundation, Kuwait Foundation for the Advancement of Science, and grants from the Steel Foundation for Environmental Protection Technology and from Grant-in-Aid of Scientific Research, the Ministry of Education, Culture, Sports, Science, and Technology of Japan.
REFERENCES
Alleman, L.Y., A.J. Veron, T.M. Church, A.R. Flegal, and B. Hamelin. 1999. Invasion of the abyssal North Atlantic by modern anthropogenic lead.
Geophysical Research Letters 26:1,477–1,480, http://
dx.doi.org/10.1029/1999GL900287. Bacon, M.P., D.W. Spencer, and P.G. Brewer. 1976.
210Pb/226Ra and 210Po/210Pb disequilibria in
sea-water and suspended particulate matter. Earth
and Planetary Science Letters 32:277–296, http://
dx.doi.org/10.1016/0012-821X(76)90068-6. Bolllhöfer, A., and K.J.R. Rosman. 2000. Isotopic
source signatures for atmospheric lead: The Southern Hemisphere. Geochimica et
Cosmochimica Acta 64:3,251–3,262, http://
dx.doi.org/10.1016/S0016-7037(00)00436-1. Boyle, E.A., B.A. Bergquist, R.A. Kayser, and
N. Mahowald. 2005. Iron, manganese, and lead at Hawaii Ocean Time-series station ALOHA: Temporal variability and an intermediate water hydrothermal plume. Geochimica et Cosmochimica
Acta 69:933–952, http://dx.doi.org/10.1016/
j.gca.2004.07.034.
Boyle, E.A., S.D. Chapnick, G.T. Shen, and M.P. Bacon. 1986. Temporal variability of lead in the western North Atlantic Ocean. Journal of Geophysical
Research 91:8,573–8,593, http://dx.doi.org/10.1029/
JC091iC07p08573.
Boyle, E.A., S. John, W. Abouchami, J.F. Adkins, Y. Echegoyen-Sanz, M. Ellwood, A.R. Flegal, K. Fornace, C. Gallon, S. Galer, and others. 2012. GEOTRACES IC1 (BATS) contamination-prone trace element isotopes Cd, Fe, Pb, Zn, Cu, and Mo intercalibration. Limnology and Oceanography:
Methods 10:653–665, http://dx.doi.org/10.4319/
lom.2012.10.653.
Cziczo, D.J., O. Stetzer, A. Worringen, M. Ebert, S. Weinbruch, M. Kamphus, S.J. Gallavardin, J. Curtius, S. Borrmann, K.D. Froyd, and others. 2009. Inadvertent climate modification due to anthropogenic lead. Nature Geoscience 2:333–336, http://dx.doi.org/10.1038/NGEO499.
Desfenant, F., A.J. Veron, G.F. Camoin, and J. Nyberg. 2006. Reconstruction of pollutant lead inva-sion into the tropical North Atlantic during the twentieth century. Coral Reefs 25:473–484, http:// dx.doi.org/10.1007/s00338-006-0113-x.
Oceanography
| March 2014 75Flegal, A.R., C. Gallon, C.H. Conaway, and P. Ganguli. 2013. All the lead in China.
Critical Reviews in Environmental Science & Technology 43:1,869–1,944, http://dx.doi.org/
10.1080/10643389.2012.671738.
Flegal, A.R., and C.C. Patterson. 1983. Vertical concentration profiles of lead in the Central Pacific at 15°N and 20°S. Earth and Planetary
Science Letters 64:19–32, http://dx.doi.org/
10.1016/0012-821X(83)90049-3. Gallon, C., M.A. Ranville, C.H. Conaway,
W.M. Landing, C.S. Buck, P.L. Morton, and A.R. Flegal. 2011. Asian industrial lead inputs to the North Pacific evidenced by lead concen-trations and isotopic compositions in surface waters and aerosols. Environmental Science &
Technology 45:9,874–9,882, http://dx.doi.org/
10.1021/es2020428.
Gobeil, C., A. Tessier, and R.-M. Couture. 2013. Upper Mississippi Pb as a mid-1800s chronostratigraphic marker in sediments from seasonally anoxic lakes in Eastern Canada. Geochimica et Cosmochimica
Acta 113:125–135, http://dx.doi.org/10.1016/
j.gca.2013.02.023.
Graney, J.R., A.N. Halliday, G.J. Keeler, J.O. Nriagu, J.A. Robbins, and S.A. Norton. 1995. Isotopic record of lead pollution in lake sediments from the northeastern United States. Geochimica
et Cosmochimica Acta 59:1,715–1,728, http://
dx.doi.org/10.1016/0016-7037(95)00077-D. Grousset, F.E., C.R. Quetel, B. Thomas, F. Buat-Menard, O.F.X. Donard, and A. Bucher. 1994. Transient Pb isotopic signatures in the Western European atmosphere. Environmental Science
& Technology 28:1,605–1,608, http://dx.doi.org/
10.1021/es00058a011.
Hamelin, B., J.L. Ferrand, L. Alleman, and E. Nicolas. 1997. Isotopic evidence of pollutant lead trans-port from North America to the subtropical North Atlantic gyre. Geochimica et Cosmochimica
Acta 61:4,423–4,228, http://dx.doi.org/10.1016/
S0016-7037(97)00242-1.
Helmers, E., L. Mart, and O. Schrems. 1991. Lead in Atlantic surface waters as a tracer for atmo-spheric input. Fresenius Journal of Analytical
Chemistry 340:580–584, http://dx.doi.org/10.1007/
BF00322433.
Helmers, E., L. Mart, M. Schulz-Baldes, and W. Ernst. 1990. Temporal and spatial variations of lead concentrations in Atlantic surface waters. Marine
Pollution Bulletin 21:515–518, http://dx.doi.org/
10.1016/0025-326X(90)90298-M.
Helmers, E., and M.M.R. van der Loeff. 1993. Lead and aluminum in Atlantic surface waters (50°N to 50°S) reflecting anthropogenic and natural sources in the eolian transport. Journal of Geophysical
Research 98:20,261–20,273, http://dx.doi.org/
10.1029/93JC01623.
Heyl, A. Jr., A. Agnew, E. Lyons, and C. Behre Jr. 1959. The geology of the Upper Mississippi Valley zinc-lead district. US Geological Survey
Professional Paper 309. Available online at: http://
pubs.er.usgs.gov/publication/pp309 (accessed November 26, 2013).
Jenkins, W.J. 1998. Studying subtropical thermocline
ventilation and circulation using tritium and 3He.
Journal of Geophysical Research 103:15,817–15,831,
http://dx.doi.org/10.1029/98JC00141.
Kelly, A.E., M.K. Reuer, N.F. Goodkin, and E.A. Boyle. 2009. Lead concentrations and isotopes in cor-als and water near Bermuda, 1780–2000. Earth
and Planetary Science Letters 283:93–100,
http://dx.doi.org/10.1016/j.epsl.2009.03.045.
Landrigan, P.J., and E.L. Baker. 1981. Exposure of chil-dren to heavy metals from smelters: Epidemiology and toxic consequences. Environmental
Research 25:204–224, http://dx.doi.org/10.1016/
0013-9351(81)90090-6.
Lee, J.-M., E.A. Boyle, Y. Echegoyen-Sanz,
J.N. Fitzsimmons, R. Zhang, and R.A. Kayser. 2011. Analysis of trace metals (Cu, Cd, Pb, and Fe) in seawater using single batch nitrilotriacetate resin extraction and isotope dilution inductively coupled plasma mass spectrometry. Analytica Chimica
Acta 686:93–101, http://dx.doi.org/10.1016/
j.aca.2010.11.052.
Lima, A.L., B.A. Bergquist, E.A. Boyle, M.K. Reuer, F.O. Dudas, C.M. Reddy, and T.I. Eglinton. 2005. High-resolution historical records from the Pettaquamscutt River basin sediments: Pb iso-topes reveal a potential new stratigraphic marker.
Geochimica et Cosmochimica Acta 69:1,813–1,824,
http://dx.doi.org/10.1016/j.gca.2004.10.008. Marcantonio, F., A. Zimmerman, Y. Xu, and E. Canuel.
2002. A Pb isotope record of mid-Atlantic US atmospheric Pb emissions in Chesapeake Bay sediments. Marine Chemistry 77:123–132, http:// dx.doi.org/10.1016/S0304-4203(01)00081-0. Miller, K., 2000. Kellogg still strives to get the lead
out. Idaho Statesman, July 2, 2000, http://www2. uvawise.edu/pww8y/Supplement/-ConceptsSup/ EnvSupp/Mining/MiningID/Kellogg.htm. Murozumi, M., T.J. Chow, and C. Patterson. 1969.
Chemical concentrations of pollutant lead aero-sols, terrestrial dusts and sea salts in Greenland and Antarctic snow strata. Geochimica et
Cosmochimica Acta 33:1,247–1,294, http://
dx.doi.org/10.1016/0016-7037(69)90045-3. Nozaki, Y., J. Thomson, and K.K. Turekian. 1976. The
distribution of 210Pb and 210Po in the surface waters
of the Pacific Ocean. Earth and Planetary Science
Letters 32:304–312, http://dx.doi.org/10.1016/
0012-821X(76)90070-4.
Nriagu, J.O. 1989. The history of leaded gasoline. Pp. 361–366 in Heavy Metals in the Environment. J.-P. Vernet, ed., Page Bros, Norwich, UK. Nriagu, J.O., and J.M. Pacyna. 1988. Quantitative
assessment of worldwide contamina-tion of air, water and soils by trace met-als. Nature 333:134–139, http://dx.doi.org/ 10.1038/333134a0.
Reuer, M.K. 2002. Centennial-scale elemental and isotopic variability in the tropical and subtropical North Atlantic Ocean. PhD thesis, Massachusetts Institute of Technology and Woods Hole Oceanographic Institution, Cambridge, MA, 187 pp.
Reuer, M.K., E.A. Boyle, and B. Grant. 2003. Lead isotope analysis of marine carbonates and sea-water by multiple collector ICP-MS. Chemical
Geology 200:137–153, http://dx.doi.org/10.1016/
S0009-2541(03)00186-4.
Reuer, M.K., and D.J. Weiss. 2002. Anthropogenic lead dynamics in the terrestrial and marine envi-ronment. Philosophical Transactions of the Royal
Society of London A 360:2,889–2,904, http://
dx.doi.org/10.1098/rsta.2002.1095. Revelle, R., and H.E. Suess. 1957. Carbon dioxide
exchange between atmosphere and ocean and the
question of an increase of atmospheric CO2 during
the past decades. Tellus 9:18–27, http://dx.doi.org/ 10.1111/j.2153-3490.1957.tb01849.x.
Schaule, B., and C.C. Patterson. 1981. Lead concentra-tions in the northeast Pacific: Evidence for global anthropogenic perturbations. Earth and Planetary
Science Letters 54:97–116, http://dx.doi.org/
10.1016/0012-821X(81)90072-8.
Schaule, B., and C.C. Patterson. 1983. Perturbations of the natural lead depth profile in the Sargasso Sea by industrial lead. Pp. 487–504 in Trace Metals in
Seawater. C.S. Wong, E.A. Boyle, K.W. Bruland,
J.D. Burton, and E.D. Goldberg, eds, Plenum, NY. Shen, G.T., and E.A. Boyle. 1987. Lead in corals:
Reconstruction of historical industrial fluxes to the surface ocean. Earth and Planetary Science
Letters 82:289–304, http://dx.doi.org/10.1016/
0012-821X(87)90203-2.
Shen, G.T., and E.A. Boyle. 1988. Thermocline ventilation of anthropogenic lead in the west-ern North Atlantic. Journal of Geophysical
Research 93:15,715–15,732, http://dx.doi.org/
10.1029/JC093iC12p15715.
Sherrell, R.M., E.A. Boyle, and B. Hamelin. 1992. Isotopic equilibration between dissolved and suspended particulate lead in the Atlantic Ocean:
Evidence from 210Pb and stable Pb isotopes.
Journal of Geophysical Research 97:11,257–11,268,
http://dx.doi.org/10.1029/92JC00759. Shirahata, H., R.W. Elias, and C.C. Patterson. 1980.
Chronological variations in concentrations and iso-topic compositions of anthropogenic atmospheric lead in sediments of a remote subalpine pond.
Geochimica et Cosmochimica Acta 44:149–162,
http://dx.doi.org/10.1016/0016-7037(80)90127-1. van Geen, A., J.F. Adkins, E.A. Boyle, C.H. Nelson,
and A. Palanques. 1997. A 120 year record of metal contamination on an unprecedented scale from mining of the Iberian Pyrite Belt.
Geology 25:291–294, http://dx.doi.org/10.1130/
0091-7613(1997)025<0291:AYROWC>2.3.CO;2. Veron, A.J., T.M. Church, A.R. Flegal, C.C. Patterson,
and Y. Erel. 1993. Response of lead cycling in the surface Sargasso Sea to changes in tropospheric input. Journal of Geophysical
Research 98:18,269–18,276, http://dx.doi.org/
10.1029/93JC01639.
Veron, A.J., T.M. Church, C.C. Patterson, and A.R. Flegal. 1994. Use of stable lead isotopes to characterize the sources of anthropogenic lead in North Atlantic surface waters. Geochimica
et Cosmochimica Acta 58:3,199–3,206, http://
dx.doi.org/10.1016/0016-7037(94)90047-7. Veron, A.J., T.M. Church, I. Rivera-Duarte, and
A.R. Flegal. 1999. Stable lead isotope ratios trace thermohaline circulation in the subarctic North Atlantic. Deep Sea Research Part II 46:919–935, http://dx.doi.org/10.1016/S0967-0645(99)00009-0. Weiss, D., E.A. Boyle, J. Wu, V. Chavagnac, A. Michel, and M. Reuer. 2003. Spatial and temporal evolu-tion of lead isotope ratios in the North Atlantic Ocean between 1981 and 1989. Journal of
Geophysical Research 108, 3306, http://dx.doi.org/
10.1029/2000JC000762.
Wu, J.F., and E.A. Boyle. 1997. Lead in the western North Atlantic Ocean: Completed response to leaded gasoline phaseout. Geochimica et
Cosmochimica Acta 61:3,279–3,283, http://
dx.doi.org/10.1016/S0016-7037(97)89711-6. Wu, J., R. Rember, M. Jin, E.A. Boyle, and A.R. Flegal.
2010. Isotopic evidence for the source of lead in the North Pacific abyssal water. Geochimica
et Cosmochimica Acta 74:4,629–4,638, http://