Auditory Pathway Responses to Parametrized Vowels in Autism
Spectrum Disorders
MASSACHUSETTS INSTITUTE
by
O F T E'6ICNLOGYBennett Bullock
B.A. Classics
LIBRARIES
Brown University, 1998
M.Sc. Arabic Language, Literature, and Linguistics
ARCHNES
Georgetown University, 2005
SUBMITTED TO THE HARVARD/MIT DIVISION OF HEALTH SCIENCES AND
TECHNOLOGY IN PARTIAL
FULFILLMENT OF THE REQUIREMENTS FOR THE DEGREE OF
MASTER OF SCIENCE IN HEALTH SCIENCES AND TECHNOLOGY
AT THE
MASSACHUSETTS INSTITUTE OF TECHNOLOGY
SEPTEMBER 2010
@2010
Bennett Bullock. All rights reserved.
The author hereby grants to MIT permission to reproduce
and to distribute publicly paper and electronic
copies of this thesis document in whole or in part
in any medium now known or hereafter created.
Signature of Author:
Harvard/MIT Division of Health Sciences and Technology
September 3, 2010
Certified by:
___Nicholas Lange, Sc.D.
Associate Professor of Psychiatry and Biostatistics
Harvard University Schools of Medicine and Public Health
Director, Neurostatistics Laboratory, McLean Hospital
Thesis Supervisor
Accepted by:
Ram Sasisekharan, Ph.D.
Director, Harvard-MIT Division of Health Sciences and Technology
Edward Hood Taplin Professor of Health Sciences & Technology and Biological Engineering
Harvard/MIT Program in Health Biosciences and
Technology
S.M.
THESIS
Auditory Pathway Responses to
Parametrized Vowels in Autism
Spectrum Disorders
Author: Bennett BULLOCK [email protected] Advisor: Nicholas LANGE, Sc.D. Associate Professor of Psychiatry and Biostatistics Harvard University Schools of Medicine and Public Health Director, Neurostatistics Laboratory, McLean HospitalABSTRACT
Autism spectrum disorder (ASD) is characterized by many behavioral symptoms, including delays in social and communicative development. A cluster of
symptoms concentrate on speech and language development, especially manipulation of non-verbal information conveyed in prosody. It is largely unknown whether this is due to functional or structural differences in the brain regions involved in auditory and speech processing, although recent studies have shown that ASD individuals do exhibit different activation patterns in various brain regions in response to speech stimuli. This study investigated responses in regions of the auditory pathway to short recorded and synthesized vowel stimuli. These regions were the Inferior Colliculus, the Left Thalamus, the left Posterior Insula, the Auditory Cortex, Wernicke's area, and Broca's area. The stimuli were parametrized so as to target different signal processing capabilities associated with each region. They were presented to ASD and typically developing (TD) subjects while the salient regions were subject to a functional magnetic resonance imaging (fMRI). The results suggest that there were not gross differences in how ASD individuals responded from TD individuals in the subcortical regions. Results from the Auditory Cortex, however, showed a significant hemisphere dominance in TD subjects with more temporally complex stimuli that did not appear in ASD subjects. Moreover, the results showed that it was temporally-measured
periodicities in the signal that were responsible for this difference. The results also show slightly different activation patterns in cortical regions which could have implications for attentiveness, and semantic and emotional processing. These results suggest that deficiencies in the temporal processing capabilities of the left Auditory Cortex play a major role in ASD speech processing.
ACKNOWLEDGEMENTS
I would like to thank Nicholas Lange, Sc.D., Janet Lainhart, M.D., Jeff Anderson, M.D., Ph.D., for their support and invaluable advice in this study. I would also like to thank Charles Bullock, Marie Bullock, Ph.D., Ryan Bullock, John Rosowski, Ph.D., Ana Luisa Abras, Ph.D., and Coco Hernandez, Ph.D., for their encouragement and support, without whom this project would not have been possible.
Contents
Glossary 6
1 Introduction 8
1.1 The Source-Filter Model of Speech . . . . 10
1.1.1 Sound Sources in Speech . . . . 10
1.1.2 The Vocal Tract Filter . . . . 11
1.1.3 Extraction of Information about the Source and Filter . . . 15
1.2 Neural Representations of Speech . . . . 18
1.2.1 Representations of Sound in the Cochlea . . . . 18
1.2.2 Representation of Sound in the Upper Auditory Pathway . 23 1.2.3 Speech Processing in AC . . . . 28
1.2.4 Effects of Sound and Speech on Other Regions . . . . 29
1.3 ASD and Speech . . . . 31
1.3.1 ASD Symptoms Pertaining to Language Development . . 32
1.3.2 ASD and Auditory Processing . . . . 33
1.3.3 Neural Underpinnings of ASD Sound Processing . . . . . 34
1.4 Specific Aim s . . . . 35
2 Methods 37 2.1 Subjects and Scanning . . . . 37
2.2 Brain Regions . . . . 37
2.3 Auditory Stimuli . . . . 38
3 Results 45 3.1 Group 1 (Inferior Colliculus, left Thalamus) . . . . 45
3.1.1 Inferior Colliculus . . . . 45
3.1.2 Left Thalamus . . . . 47
3.2 Group 2(Auditory Cortex, left Posterior Insula) . . . . 47
3.2.2 3.3 Group
3.3.1 3.3.2
Left Posterior Insula . . . . 50
3 (Wernicke's area, Broca's area) . . . . 51
Wernicke's area . . . . 51
Broca's area. . . . . 54
4 Discussion 56 4.1 Significant Group Differences . . . . 56
4.1.1 Interaction of Global and Local Attentive Processes . . . . 56
4.1.2 Hemispheric Differences . . . . 57
4.1.3 Differences in Response Stimulus Parameters . . . . 58
4.2 A "Deficient Input" Model for ASD Speech Processing . . . . 60
4.3 Conclusion . . . . 61
5 Appendix: The Source-Filter Model in an Acoustic Medium 63 1.1 Propagation of Sound in an Acoustic Medium . . . . 63
1.1.1 Molecular Collisions Propagating Energy. . . . . 63
1.1.2 The 1-Dimensional Wave Equation to Model Propagation of Energy. . . . . 63
1.1.3 Time and Frequency Domain Representations . . . . 67
1.2 Classifying Sound Sources . . . . 69
1.2.1 Clicks and Click-like Sounds . . . . 69
1.2.2 Periodic Sounds . . . . 69
1.2.3 N oise . . . . 72
1.3 The Source-Filter Model . . . . 73
1.3.1 Time Domain Models of Convolution . . . . 73
1.3.2 Frequency Domain Models of Convolution . . . . 74
1.4 Digital Signal Processing Basics . . . . 74
1.4.1 Representing a Time-Domain and Frequency-Domain Sig-nals . . . . 74
1.4.2 Implementations of the Source-Filter Model . . . . 75
Glossary
AC Auditory Cortex
Al Primary Auditory Cortex
AIC Akaike Information Crtierion
All Belt of Auditory Cortex
AIII Parabelt of Auditory Cortex
AM Amplitude Modulation
ANF Auditory Nerve Fiber
ASD Autism Spectrum Disorder
autocorr Autocorrelation BM Basilar Membrane
BOLD Blood Oxygen Level-Dependent ERP Event-Related brain Potentials FI Front angular belt of Insula
FM Frequency Modulation
fMRI functional Magnetic Resonance Imaging
fs Frequency Similarity
HG Heschl's Gyrus
IC Inferior Colliculus
IQ Intelligence Quotient
LPC Linear Predictive Coding
MEG Magnetic Encephalography
Posterior Insula Pitch Variation Phase Modulation
REML Restricted Maximum Likelihood
ROI Region of Interest
stimit Stimulus Iteration
TD Typically Developing
TMG Transcranial Magnetic Simulation
TR Time of Repetition PI
pitchvar PM
Chapter 1
Introduction
Autism Spectrum Disorder (ASD) is a brain-based disorder that underlies symp-toms largely related to delays in social and linguistic development [48]. It is be-lieved that ASD involves different strategies of sensory processing. Although it sometimes corresponds to mental retardation, ASD does not necessarily affect IQ, and many high-functioning ASD indivuals are successful in fields which require a facility with abstractions and extreme attention to detail. For example, the widely known autistic Temple Grandin revolutionized the meat industry by noticing how minute and previously unnoticed details of the slaughterhouse affected the behavior of the animals [25].
Classified as DSM IV, is divided into three major categories -Autism, Asperger syndrome, and Pervasive Developmental Disorders Otherwise Not Specified [48]. Although ASD is defined in terms of behavioral symptoms [48, 5], the consistency of these symptoms over different patients and the apparent heritability of ASD have led to the belief that ASD has a neuropathology with genetic origins. This is sup-ported by the fact that symptoms appear in the same periods of child development, from 6 months onward [61]. Although no genetic cause has been identified, studies of siblings and twins show that autism is highly heritable [1].
Although the neural mechanisms for autism are not known, hypotheses about the neuropathology of autism often focus on cytological differences which have global repercussions for the functionality of the brain [12, 65, 7]. In these hypothe-ses, many brain regions show strong internal cohesion and functionality but weaker connectivity with other regions. For example, Schmitz and Rezaie [65] postulate a degree of connectivity within the cerebral cortex and weaker connections between this region and the frontal lobe. This would have wide-spread implications for
at-tention, orientation of auditory and visual stimuli, and novelty detection. Other hypotheses are an inbalance in excitatory and inhibitory networks, and an under-development in the mirror neurological system, which activates when an animal observes another animal performing the same action [56].
The neural mechanisms for speech and language are highly distributed across the brain [47] and many symptoms of autism specifically involve speech and language development [5]. Therefore, it is reasonable to investigate how the mechanisms of auditory and speech processing differ between autistic and typically develop-ing (TD) subjects. Magnetic encephalography (MEG) and neuroimagdevelop-ing studies have shown that there are significant differences in ASD responses to entire sen-tences in various brain regions [4, 36, 60, 8]. There have also been behavioral and neuroimaging studies on how ASD subjects respond to simpler sounds such as pure tones, amplitude-modulated (AM) tones, and frequency-modulated (FM) tones [9, 11]. These studies implicate ASD subject's ability to process wideband stimuli which have a high amount of variation across time, and that it is a combina-tion of spectral and temporal complexity which elicits ASD-specific responses. To our knowledge, no study has yet quantitatively related ASD responses to temporal complexity in the speech stimulus. By imaging different regions along the auditory pathway in response to stimuli which systematically vary along varius source-filter parameters, it may be possible to localize regions where there are significant sub-ject group differences and to relate these differences to these regions' known signal
processing capabilities.
Section 1.1 of this chapter reviews the source-filter model of speech as it per-tains to the design of the stimuli of this study. Section 1.2 reviews salient regions on the auditory pathway for investigating autism's relationship to speech. Section
1.3 reviews autism's relation to auditory processing, speech, and language. Section
1.4 states the specific aims and hypotheses of this study. In this study, the terms
ASD and autistic will be used interchangeably, due to the prevalence of similar
language-related symptoms across all categories of ASD [48, 5]. A thorough in-troduction to the basics of acoustic theory and digital signal processing is included at the end of this study, in the Appendix. This Section covers the basic models for propagation of sound, the characterization of click-like, periodic, and noisy sound sources, mathematical models for convolution of the source and filter, and basic digital signal processing concepts.
1.1
The Source-Filter Model of Speech
The source-filter model of speech models the acoustic interactions of various sound sources with the vocal tract. This model relates a sound source, which a physical event which originates the propagation of acoustic energy, and a filter, which is a physical structure which somehow transforms this acoustic energy. In this model, the glottis serves as the source and the vocal tract serves as a filter. The speech signal is a convolution of this glottal source and vocal tract filter.
1.1.1 Sound Sources in Speech
The sound sources in speech can be broadly characterized as periodic, noisy, or click-like. Periodic sources arise from the glottis. Noisy sound sources are turbu-lence at an obstruction in the glottis or vocal tract. Click-like sources depend on the sudden release of air after a complete obstruction of air has been released, in
either the glottis or the vocal tract.
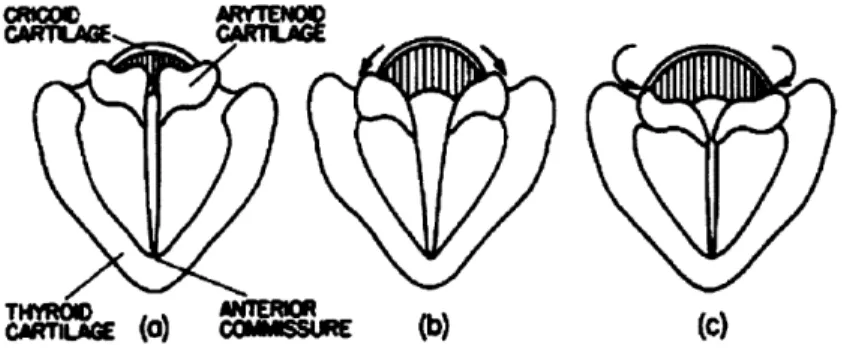
The glottis is a sound source for vowels and any consonant requiring voicing. It is a cartilagenous structure situated above the epiglottis and the trachea, and below the pharynx. Two strips of elastic tissue, the vocal folds, connect the arytenoids to the thyroid cartilage on the anterior of the glottis. These are two pointed carti-lagenous structures on the posterior ridge of the glottis which can rotate inwards or outwards. Because the points connect to the vocal folds, inward rotation of the points spreads the vocal folds apart, while outward rotation brings them in contact with one another. [71]
When the vocal folds are brought together, airflow from the lungs can exert pres-sure on them. This prespres-sure moves them upward while spreading them apart. After they are spread apart, the tension in the folds brings them downward and back together. Steady airflow ensures that these excursions occur periodically. These periodic excursions create a series of pulses of volume velocity which propagate upwards into the vocal tract. Because the vocal folds have a greater excursion than incursion, the waveform they produce has distortion, and therefore is a harmonic complex in which the frequency of the pulses is the fundamental frequency. Funda-mental frequency is controlled by the height of the glottis. The glottis can move up the spinal chord, stretching the vocal folds and increasing tension. This decreases the time it takes for the vocal folds to come together after an excursion, and thus increases the frequency of the excursions [71].
Figure 1.1: A view of the glottis from the back of the oral cavity looking down-ward, showing the vocal folds and arytenoids. (a) shows the arytenoids in their resting position. (b) shows the points of the arytenoids moving inward and draw-ing the vocal folds apart. (c) shows the points of the arytenoids movdraw-ing outward and drawing the vocal folds together. From Stevens [71].
Speech also depends on other sound sources in constrictions of the vocal tract and the glottis under certain configurations. One major class of sound sources is noisy turbulence arising from air flow through constrictions in the vocal tract. The other major type of sound source is a single click-like pulse of volume velocity arising from releasing the complete obstruction of the airflow.
Different phonemes -or discrete units of sound in language -depend on different sound sources. A vowel depends entirely on the glottis, although breathy vowels, such as those found in Gujarati, also depend on turbulence in the glottis. Voiced consonants, such as /z/ or /g/, feature the periodicity generated by the vocal folds. Fricatives, such as /h/, /th/, /dh/, /s/, or /sh/, feature noisy turbulence generated in the glottis or a constriction in the vocal tract. Stops, such as /t/, /d/, /p/, or /k/, result from a released obstruction in the vocal tract, which resembles a click followed by a brief period of turbulence. In affricates, such as /ch/ or /j/, the release after a complete obstruction of airflow is followed by more turbulence in the constriction.
1.1.2
The Vocal Tract Filter
The vocal tract, extending from the glottis to the lips, can be portioned into tube-like cavities by the pharynx and tongue. The vocal tract can increase the amplitude of different frequency components in the sound source, in a process called reso-nance. In source-filter terms, the glottis and noisy constrictions in the vocal tract serve as sources, while the vocal tract serves as a filter. It is important to note that
the sound source can be any physical event which introduces acoustic energy into a medium and the filter is an environment which alters this energy. For example, if someone is speaking in a room, it is also possible to define the vocal tract excited
by the glottis as a source and the room as the filter. 1.1.2.1 Boundary Conditions for Resonance
Certain constrictions in the vocal allow the vocal tract to be modelled as a series of concatenated tubes. A major property of a tube is resonance. This occurs when a tube is exposed to a sinusoid at certain frequency which causes the tube to
am-plify this sinusoid. This frequency depends on the length of the tubes and whether
the ends of the tubes are open or closed. These open or closed openings man-date boundary conditions, and these boundary conditions determine the resonant frequency. The boundary condition for an open end of the tube is that the pres-sure must be 0 and the volume velocity must be at a maximum. This is because Newton's law is encoded in the wave equations (see Equations 1.3, 1.1, and 1.2). As was shown above, pressure is analogous to force and acceleration involves particle velocity. Since volume velocity is particle velocity over a cross-sectional area, acceleration implies a change in volume velocity. A point where pressure is
0 is a point where the acoustic medium has fully accelerated, and volume velocity
is at its maximum. The enclosure of this medium inside the tube ensures that the wave's energy drives the medium back and fourth in a directed fashion. If this is done at maximum velocity, the maximum amount of energy will enter the tube. If the 0 point for pressure were outside the tube, not all of this energy would enter the tube. In this way, the medium at the open end of the tube can act as a vibrating piston-like sound source.
At a closed end, the medium cannot move, and volume velocity at this point is 0. A point where volume velocity is 0 is also a point where pressure has not accelerated the medium, and is therefore at its maximum value. A wave where pressure is at its maximum at the closed end and minimum at the open end is a wave where the most energy is conserved in the system.
The effects of resonance on a wave are understood by the relation of pressure to volume velocity, p = zu, where z is an acoustic impedance. Impedance is the loss of energy in the propagation of the wave. At an open end of a resonating tube, if pressure is 0 and volume velocity is at a maximum, then impedance is 0. Therefore, as the wave enters the tube, energy will accumulate in the tube. As
Ip(xfl
lu
,me
0x
VVW.
X
Figure 1.2: A diagram of a tube closed at one end, showing amplitudes of pressure and volume velocity waves that meet the boundary conditions for resonance. From Stevens [71]
energy accumulates, maximum volume velocity at the open end increases. The piston-like motion of the medium at the open end then acts as a sound source at this resonant frequency, thus amplifying the original stimulus frequency.
1.1.2.2 Types of Resonators
Tube Resonators. In a resonating tube of length L, which is open at both ends, pressure is 0 and volume velocity is maximum at these ends. A pressure and vol-ume velocity wave of a resonant frequency must have at least a half-wavelength fit into the tube. Therefore, the resonant frequencies will be integer multiples of
'. In a tube closed at both ends, the conditions will also be satisfied by these resonant frequencies, although the 0 point in pressure will be in the middle of the tube. In a tube open at one end and closed at the other, a wave must have a quarter-wavelength fit into the tube. The resonant frequencies are odd-numbered multiples
of ,.
Helmholz Resonators. The other major type of resonance is the Helmholz
res-onance. This occurs when a tube open at one end is concatenated to a tube open at both ends, and the cross-sectional area of the tube open at both ends is large enough to create a mass-spring effect in the acoustic medium. There are two con-ditions for the pressure wave. First, its wavelength must be large enough to create
MA
CAFigure 1.3: A diagram of a Helmholz resonator. MA refers to the mass-like behav-ior of the medium in the tube open at both ends, while CA refers to the spring-like behavior of the medium in the tube closed at one end. From Stevens [71]
only a minor pressure drop across the resonator. In such a situation, the medium in the tube open at both ends behaves similarly to a rigid-body mass moved by a force, and the medium in the tube closed at one end behaves as a spring which is compressed by the mass. Energy from the mass is transfered to the spring as it compresses, and transferred back to the mass as it extends. Secondly, the wave must accelerate the mass at the same time that the spring has fully extended. A wave which meets these two conditions allows the maximum amount of energy to accumulate in the resonator. The mass at the open end of the tube behaves as a piston-like sound source for this amplified stimulus. The frequency which causes this behavior depends on both the length of the mass-like element, the spring-like element (LM and Ls, respectively), and the cross-sectional areas of these elements
(AM and As, respectively) - FH = AsSLu '
Concatenated Tube Resonators. Resonators formed from concatenations of tubes have the resonances of the individual tubes, and any Helmhoz interactions which the concatenation may produce. Therefore, a Helmholz resonator has the Helmholz resonance and the resonances of the two tubes.
1.1.2.3 Modeling the Vocal Tract Modeling the Filter.
Vocal-Tract Configurations for Vowels. The cardinal vowels of English can be
modeled in terms of these tubes. The model for i/ is a concatenation of a tube open
at both ends and a tube closed at one end. This has a Helmholz resonance and the resonances of the individual tubes. The models for /a/ and /e/ are two tubes closed at one end. /o/ is three tubes closed at both ends, concatenated against one another, and /u/ is two tubes closed at both ends.
Vocal Tract Configurations for Consonants. It is important to note that
cer-tain consonants are also steady-state activations of the vocal tract filter. If they are voiced, as in the case of /d/ or lgl, or if there is a noise source in the glottis, as in the case of /h/, the entire vocal tract will be excited, showing the resonances of the vocal tract. However, if the noise source comes from an obstruction in the vocal tract, as in the case of /sh/, /s/, /th/, and /f/, only the portion of the vocal tract an-terior to the constriction will resonate. The posan-terior portion will serve as a source of zeros, or anti-resonances, which attenuate the signal at certain frequencies. The frequencies where the noise band attenuates indicate the length of the back cavity,
and therefore the constriction.
Temporal Information in Speech. Clearly, speech is not a series of steady-state sounds, and there is just as much information conveyed by transitions in the vocal tract. Some vowels convey information in the change in the vocal tract configu-ration. /ay/, /ey/ or /ow/, for example, are dipthongs which are characterized by their change. Stop consonants such as /t/ or /k/ involve a complete obstruction of airflow, followed by a short burst of air. The change in the vocal tract resonances preceding and following the constriction indicates the position of the constriction. This is what is referred to as temporally significant information in speech.
1.1.3 Extraction of Information about the Source and Filter
Speech processing depends on extracting information about the filter and the source -especially regarding pitch. The interaction of a glottal source and a vocal tract filter can be modeled mathematically as a convolution. Extracting a spectrum for both the source and the filter is done by deconvolution.
1.1.3.1 Extraction of Information About the Filter
The neural mechanisms for deconvolution of the source and filter are not known, but a brief review of the engineering solutions demonstrates the complexity of the task.
Smoothing the Spectrum. One of the simplest auditory processing algorithms
is to smooth the convolved spectrum. The spectrum of the speech signal is repre-sented as the magnitudes of a discrete set of amplitudes for Fourier coefficients. The magnitude for each coefficient in the spectrum of the filter is the mean of the last N coefficients, the coefficient, and the next N coefficients [73].
Cepstral Analysis. Cepstral analysis (a term formed by reversing the first four letters of the word "spectrum") performs a Fourier Transform on values computed from the convolved spectrum. First, the magnitudes of the Fourier coefficients of the convolved signal are squared. The logarithm is taken from these coefficients, and a Fourier transform is performed on them. The squared magnitude of these coefficients compose the cepstrum. The equivalents to frequencies in this scheme are termed quefrencies, a play on the word "frequency". Since the fine structure of the convolution arises from the glottal source, it corresponds with higher que-frency coefficients in the cepstrum. The filter corresponds to lower quefrencies. Therefore, isolating the lower and higher quefrencies has the effect of separating the source and filter [50].
Linear Predictive Coding. Linear Predictive Coding (LPC) is a mean-squares
method. A discretized speech signal x(n) is compared to an estimation of this signal from the previous M components and a set of coefficients a: f(n) =
iZM aix(n - i). The mean-squared error, e2(n) = (x(n) - (n)) 2 is
mini-mized to solve for the coefficients. These coefficients are then used to estimate a transfer function for the filter, the peaks of which are the resonances. [50]
1.1.3.2 Detection of other Features
There are other relevant features of a sound which have a variety of strategies for detection. Although the neural mechanisms of pitch perception are largely unknown, the methods applied in signal processing demonstrate the complexity of the task. There are two major classes of algorithms for these tasks used in signal processing -spectral and temporal.
Pitch. Pitch detection involves making a reliable judgement on fundamental
fre-quency, and there are spectral and temporal approaches to this. Temporal algo-rithms focus on the signal in the time domain. If all harmonics have the same phase, they will all have maximum and minimum amplitude at the same time as the tone at the fundamental frequency. Therefore, the maxima and minima of each harmonic sum to produce the maxima and minima in the entire signal. They can therefore be used to infer the fundamental frequency. Similar inferences can be made from zero-crossings in the signal. The envelope of the waveform, or its gen-eral trajectory over time, is another means of identifying pitch. One of the more sophistocated methods of temporal analysis involves autocorrelation, a measure for the degree of periodicity in the stimulus. The fundamental frequency defined with a time constant T as -. Because periodicity from the fundamental frequency can
be found in individual harmonics, the time constant which maximizes the integral:
r(T) =
J
x(t)x(t - T)dt(1.1)
is also the time constant corresponding to the fundamental frequency [13].
Spectral algorithms analyze the spectrum of the speech signal. A common class of algorithms for pitch recognition is comb-fitting, in which a comb-like template, whose "teeth" are at the harmonic frequencies, is fit to the spectrum of the signal.
A signal for a harmonic complex will fit each template to a certain degree, and
pitch is determined by the template which maximizes this fit [13]. This requires multiple templates for multiple pitches. Another important feature of comb-fitting algorithms is that wideband signals like noise and clicks can also activate these templates.
Detection of AM and FM. Speech depends highly on temporal variation.
There-fore, mechanisms to detect changes in amplitude and frequency are crucial. These mechanisms can be detected using AM and FM stimuli. Although their amplitude and frequency modulate periodically, the mechanisms which detect this modulation may also be able to detect transient modulations. Because it must track changes in amplitude, the AM-sensitive mechanism would account for any differences in am-plitude of vocalization, and transitions from high-amam-plitude intervals of the signal, such as vowels, to low amplitude portions of the signal, such as certain fricatives or stops. An FM-sensitive mechanism would be needed to track changes in frequency associated with modulations in pitch and vocal tract resonances.
Spectrally, AM can be detected by taking advantage of the equivalence:
sin(2w fAt) sin(2w
f
t) = sin(2 ft) + sin(2(f + fA)t )+sin(27(f - fA)t) (1.2)where
f
> fA. These three components appear in the spectrum, and it is possibleto infer these frequencies. Temporally, if the modulator frequency is known, dif-ferences in consecutive peaks of amplitude in the wave can be used to track AM gradients. Another means of detecting AM is to analyze its time-domain "enve-lope". An envelope is the gradual pattern of AM, independent of the fine structure of the modulator wave. The envelope can be taken by extracting a Hilbert trans-form of the wave, defined in Equation 1.5, taking its absolute value, and low-pass filtering the signal. Then, AM can be extracted by performing a Fourier Transform on the envelope.
A widely used method for tracking FM to detect phase modulation. The fFM sinusoid in Equation 1.11 could also be interpreted as a phase modulation, as long as the amplitude of this term were sufficiently small (< E). In situations where
#3
<it would be possible to take advantage of the trigonometric identity sin a -a - /3. To do this, a sinusoid at the carrier frequency must be taken sin(27rft),
and then compared with a phase-shifted sinusoid with a phase modulation term cos(27rft + xpM(t)). It is also to obtain cos(27rft) and sin(27rft + xPM(t)).
Applying a trigonometric identity yields:
sin(27rft) cos(27rf t + xpMN(t)) - cos(27rft) sin(27rft + xpM(t) (1.3)
= sin(27rft - 27rft - xPM(t)) -xPM(t)X sin(27rf t) cos(27rf t + XPM (t)) sin(27rft - 27rft + xpM(t)) sin(27rft + 27Tft + XPM(t)) 2 2 sin(27rft - 27rft + xpM(t)) sin(47rft + xpM (t)) 2 2 XPM(t)
Because the second term of the difference is twice the carrier frequency, it can be filtered out, and xpM(t) can be computed as if there were no second term. Equation 1.3 can also be used to compute amplitude modulation, if the carrier sinusoid in Equation 1.2 is subtracted.
1.2 Neural Representations of Speech
In the auditory pathway, there is evidence for both temporal and spectral repre-sentations of the acoustic signal. In a spectral representation, there are a series of mechanico-neural channels, each of which represent a stimulus at a different range of frequencies. At rest, these neurons have a spontaneous firing rate. When a chan-nel is activated by a stimulus, the neuron's firing rate is above the spontaneous rate. The temporal representation preserves the periodicity of the stimulus in the firing patterns of the neurons [23].
1.2.1
Representations of Sound in the Cochlea
The ear is a transducer which represents a signal acoustically, mechanically, electro-chemically, and neurally. An acoustic signal enters the ear canal. The signal com-presses the tympanic membrane, which is coupled to the bones of the middle ear.
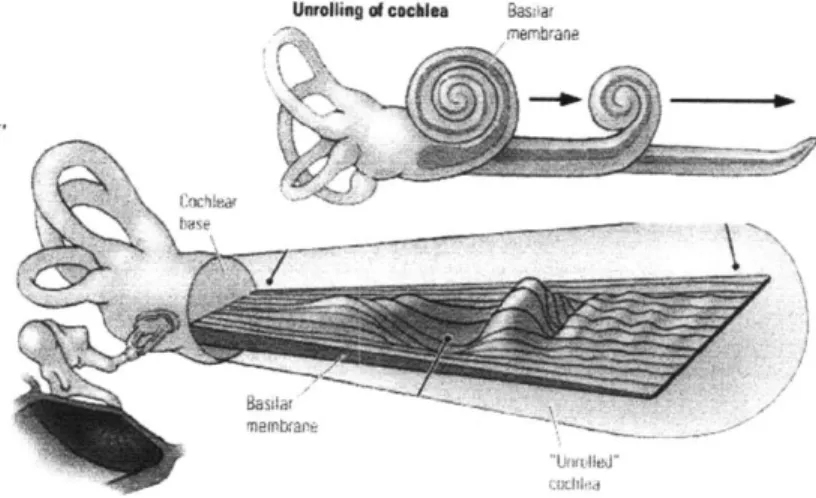
Unrolling of cochlea Bas'ar
rnernbranp
Figure 1.4: A schematic diagram of the cochlea, showing the position of the basilar membrane. The unfolded portion shows the vibration patterns in response ot an acoustic stimulus. From [54]
A B 0 E T A a C 0
440 Hz
00,r "Po' I~rf ni~ s 4" t
P3090 HI 440 KN 20 HI
Figure 1.5: A schematic diagram of an unfolded basilar membrane, with a concep-tual model as a series of discrete resonators, in which each region responds to a frequency determined by the mass and springiness of the membrane at that region. From [67].
These bones mechanically transduce the signal to the round window of the cochlea. The cochlea is a spiral fluid-filled tube which is internally bisected by the basilar membrane (BM).
1.2.1.1 Transduction in the Cochlea
Acoustic-to-Mechanical Transduction. The BM is an acoustic-to-mechanical
transducer. Consecutive regions of this membrane can be modeled as a series of discrete mechanical resonators, as shown in Figure 1.5. The mass and stiffness of one of these regions can be modeled as two springs which connect a mass to op-posite sides of the tube. In this way, regions of the BM behave as mass-spring os-cillators similar to Helmholz resonators, and each region has a resonant frequency which derives from the mass and stiffness. From the base of the cochlea to its apex, the mass and stiffness vary such that the BM represents a contiguous range of frequencies, with higher frequencies at the base. The range of the human ear is
20-20000 Hz [23].
The signal enters the fluid of the cochlea at the round window. This fluid acts as an acoustic medium. As the signal displaces the BM, frequency components in the signal activate the corresponding resonant BM regions. Because of the mechanics of the BM, the wave travels from base to apex. At the regions corresponding with frequency components in the signal, the membrane oscillates upwards and down-wards at the resonant frequency. The degree of displacement is proportional to the amplitude of the frequency component. In this sense, the entire BM represents a spectrum mechanically, with different regions representing different frequency in-tervals. This strategy of spatially representing a spectrum is called tonotopy [23].
Mechanical-to-Neural Transduction. On the BM, there are inner hair cells which
act as mechanical-to-electrochemical transducers. These are epithelial cells with a bundle of stiff connected tubes, or stereocilia, on their apex. As the membrane dis-places, these tubes deflect, opening ion channels which allow potassium to enter the cell. This potassium depolarizes the cytoplasm, causing ion channels selec-tive for calcium to open at the base of the cell. Each inner hair cell is innervated
by nerve fibers, the auditory nerve fibers (ANF's) At each synapse, the inner hair
cell contains a structure which binds several vesicles together. Incoming calcium causes this structure to release vesicles into the synapse, as well as the release of vesicles which are not attached to this structure. These vesicles travel across the synapse, causing the auditory nerve fiber to hyperpolarize and fire an action poten-tial. It is important to note that vesicles can also be released spontaneously without depolarization. Therefore, the neuron has a spontaneous firing rate when the hair
cell is at rest, and a higher-than-spontaneous rate when the hair cell is depolarizing
[23].
noe-Now
Figure 1.6: A diagram of an inner hair cell. Basilar membrane displacement causes stereocilia to deflect, allowing an influx of potassium ions. These ions promote vesicle release to the afferent nerve fiber. From [71].
1.2.1.2 Spectral and Temporal Representations
Spectral Representations. The cochlea's method of transduction allows for a
spectral representation of the signal. Because inner hair cells associate consecu-tive regions of the BM to consecuconsecu-tive ANF's, there is a tonotopy in which ANF's act as filtering channels for a given frequency interval. An ANF's firing at the spontaneous rate represents a lack of frequency components in this interval, while a higher-than-spontaneous firing rate in an ANF represents the presence of a fre-quency component [23].
Temporal Representation. The temporal strategy for representing frequency
com-ponents in a signal is called phase locking. Because a region of the BM oscillates at its resonant frequency, because hair cells depolarize with the displacement of a BM
region, and because vesicles can be released upon displacement, it is possible to reproduce the signal's periodicity in the ANF. However, the transduction process of the inner hair cell introduces certain temporal limitations, which make it possible for an ANF to fire at a maximum rate of approximately 250-300 spikes/sec. There-fore, it is possible for an ANF to fire with every cycle in a stimulus at or below
250-300 Hz. Although an ANF cannot completely follow the stimulus above this
frequency, it will probably spike at some cycles, preserving some of the stimulus' periodicity. This could appear in a histogram as a fluctuation in the average firing rate at the same frequency of the cycle. For example, a stimulus of 300 Hz or 900 Hz could have an average firing rate at at 150 spikes/sec, although there will not be a spike for every cycle of the sinusoid [23].
1.2.1.3 Lower Auditory Pathway Representation of Other Sound Features Pitch. Because the ANF can preserve periodicity in the stimulus, pitch can be
represented in the ANE. ANF's at a harmonic of the fundamental frequency under
250 Hz can completely follow the stimulus. With harmonics above this frequency,
the spikes can reproduce some of the periodicity of fundamental frequency and some of the periodicity of other harmonics. Pitch can also be inferred from multiple ANF's. If a single ANF at a harmonic can represent periodicity of lower harmonics
and the fundamental frequency, then the frequency at which multiple ANF's fired simultaneously would be the fundamental frequency. A mechanism designed to detect this could then serve as a way to derive pitch [69].
AM and FM. The spectral and temporal representations of sound in the cochlea
can also encode other features of a stimulus as well. An AM stimulus with a fre-quency can be spectrally represented by tone shown in Equation 1.2. In a temporal representation, the ANF will most likely phase-lock to the AM frequency. This is because the greatest amplitude in an AM stimulus will occur periodically with the AM frequency. Because the ANF's firing rate is limited to 250 Hz, times of maxi-mum amplitude in the waveform will be most likely to cause the ANF's to fire. FM has spectral and temporal representations as well. An FM tone could be spectrally represented by alternating increases in firing rates in adjacent groups of ANF's. Phase-locking in the ANF could also represent FM. In a phase-locked firing pat-tern, consecutive ANF spikes may repeat consecutive spikes that occur because of changes in frequency.
1.2.1.4 Other Auditory Pathway Structures
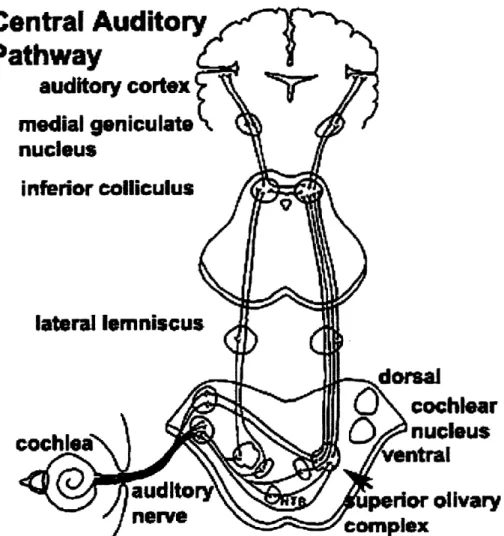
As shown in Figure 1.7, the auditory pathway is composed of several stages, many of whose functionality is still not fully understood. One common feature of the lower auditory pathway is the preservation of tonotopy. The ANF's in the spiral ganglion relay the signal to the cochlear nucleus. Like the cochlea, the cochlear nucleus contains a tonotopic representation of the spectrum. The signal is relayed through the cochlear nucleus' projections through lateral lemniscus to the inferior colliculus (IC). From here, the signal travels through the medial geniculate body and the thalamus, into auditory cortex (AC).
The IC is important because all auditory information must pass through this structure to get to higher brain regions. In doing so, the evidence suggests that it acts as a sensory integrator for auditory and other sensory information. Moreover, there is evidence that this region is sensitive to both AM and FM frequencies [57]
and to higher-order processes in AC [59].
1.2.2 Representation of Sound in the Upper Auditory Pathway
There is evidence that both the tonotopic and spectral representation of the signal propagate upwards into AC. However, from here other brain regions involved in auditory perception do not demonstrate this representation, suggesting that regions connected to AC are involved in higher-order cognitive processing of the signal.
1.2.2.1
Spectral and Temporal Representations in AC
The lower auditory pathway's spectral and temporal representations are repeated in AC, whose neurons demonstrate both tonotopy and extreme sensitivity to spike timing that allows it to detect temporal components in the signal precisely. Since changes in a signal's frequency and amplitude can be encoded in AM and FM, these temporal mechanisms are predominantly specialized to detect these two quantities in a signal.
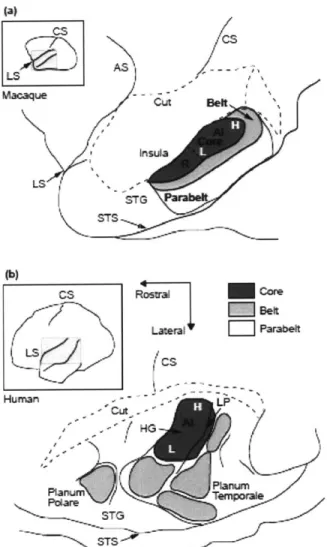
The Neuroanatomy of AC. Located on the superior temporal gyrus, this region is divided into a core (AI), a belt surrounding the core (AII), and a parabelt (AIII). AI has extensive two-way connectivity with AII, and AIII has connectivity with the contralateral AIII. There is no known connectivity between Al or All and the contralateral AC. At the anterior is Heschl's Gyrus (HG) [68].
Central Auditory
Pathway
auditory cortex
medial geniculate
nucleus
inferior colliculus
U
cochlear
cochleanucleus
cochleantraI
uditor
perior
olivary
onervecope
Figure 1.7: A diagram of the auditory pathway, showing the major structures from the cochlea to auditory cortex. From [33].
(a)
CSRora 4S
LSS
STS
Cs Rostral Cone
(a)andhumn uba(bIn ths sceai-lutainahdlnsidct -Latera . Parabelt cs -LP-{HG Planumn - TG
Figure 1.8: A diagram of auditory cortex, showing a lateral view of the macaque (a) and human brain (b). In these schematic illustrations, dashed lines indicate where overlyingparietal cortex has been removed. From Semple [68].
Spectral and Temporal Representations in the AC. There is evidence that the spectral and temporal representations of a signal have propagated into AC. Single-cell recordings of various mammals show that Al has several rostro-caudal tono-topic gradients which place higher frequencies caudally [68].
There is also evidence that this frequency axis corresponds with a lateral axis which is sensitive to temporal changes in the signal [68]. Cells along this axis demonstrate sensitivity for AM and FM. In recording from Al in cats, Egger-mont [17] has demonstrated that AM tones, clicks, gamma tones (tones which rise rapidly and attenuate gradually), and AM noise, and time-reversed gamma tones -all of which have different temporal envelopes -have unique representations in
Al. In this study, the uniqueness of these responses depended on the degree of
syn-chronization of cortical nerve firing patterns to the envelope of the waveform. The most reliable synchronization occured with stimuli with a rapid onset -clicks and gamma tones. Synchronization decreased significantly with time-reversed gamma tones, AM noise, FM tones, and AM tones, respectively. The decreased sensitivity to periodicity in the latter two cases suggests that this mechanism is most respon-sive to changes in the envelope of the stimulus -which are more apparent in noisy, click-like, and rapid-onset periodic stimuli.
Possible Mechanisms for Temporal Sensitivity. The evidence for the exact
mech-anism of FM sensitivity presents a complex picture, and there is strong evidence that AM and FM detection rely on the same mechanism. Ding and Simon [14] used MEG to observe responses to FM and AM modulation, finding distinct au-ditory steady states for AM and AM-FM stimuli, the latter of which shows phase modulation with AM and FM. Luo et al. [44] performed a similar experiment, ar-riving at a comparable conclusion. Drawing on the fact that phase modulation can encode both AM and FM, as is shown in Equation 1.3, they suggested that one type of neuron uses this method to encode FM and AM at lower AM frequencies. These neurons account for synchronization to the temporal envelope. The authors also noticed that higher AM frequencies produce a different auditory steady state response. This led the authors to suggest that there were neurons which could encode AM and FM through phase modulation and neurons sensitive only to AM. These results are supported by Elhilali et al. [18], who based on their study on the paradoxical observation that cortical neurons, whose cytoarchitecture seemed specialized for temporal precision, could only encode AM of up to 20 Hz. Record-ing from ferrets, they demonstrated that cortical neurons show a remarkable tem-poral precision in response to AM tones, such that they can follow a carrier
stim-ulus of above 200 Hz. However, this response dissappears when there is a lower AM amplitude. They attributed this to a cortical inhibitory mechanism or cortico-thalamic excitatory mechanism which acted as a gateway for an AM signal. When the AM amplitude was sufficient, they noticed that not only could the cortical neu-ron follow the carrier, but that differences in spike phase could encode FM. The interaction of cortical neurons with this inhibitory mechanism allowed for a tem-porally precise representation of both AM and FM.
1.2.2.2 Hemispheric Specialization for Temporal Precision
Although both left and right AC have tonotopy and sensitivity to FM and AM, there is evidence for hemispheric differences which result in specialization of the left AC for temporal precision and the right for spectral precision.
fMRI Studies. Functional magnetic resonance imaging (fMRI) studies
demon-strate this specialization in humans. Zatorre and Belin [75] presented subjects with tone complexes with differences in the number of tones and frequency transitions. They found that more spectrally complex stimuli disproportionately activated the right AC, while the more temporally complex stimuli disproportionately activated the left AC. This has implications for speech perception. Zatorre [76] showed that the left HG activated with more temporal precision in response to a speech
stimu-lus.
Physiological Indications. While speculating as to the causes of this hemispheric
difference, Zatorre and Belin [75] suggested that there are differences in the makeup of the cortical cells themselves. In-vivo volumetric measures from HG from MRI scanning have suggested that there is a greater concentration of white matter in the left Heschl's gyrus (HG) than the right [52]. Since white matter is myelinated tissue, and greater myelination corresponds with greater conductivity, there is a potential phyisiological basis for the functional differences between left and right
Al.
1.2.2.3 AC and Pitch
A third property of a speech signal which could have temporal and spectral means
of representation in AC is pitch, although the exact strategy is not known. There is physiological evidence for brain regions devoted to pitch processing, but the exact role of spectral and temporal forms of pitch processing is unknown [13]. Although it was originally believed that HG contained a mechanism for pitch processing due to the region's response to dichotic noise [55], a subsequent study by Hall and
Plack [28] showed other regions responding to pitch, such as the temporo-parieto-occipital junction or prefrontal cortex. The evidence strongly suggests the use of a spectral algorithm, but it is not known whether this is performed in conjunction with a temporal algorithm. The pure "template" model faces the difficulty that harmonic templates are shown to arise in pre-natal mammals [13]. Shamma and Klein [69] developed an algorithm which exploits the periodicity coming from the cochlear filters. Their algorithm postulates a series of coincidence detectors. Syn-chronous spikes coming from cochlear filters at the harmonics indicates a harmonic structure. This allows harmonic templates to be learned from non-harmonic sounds such as physiological noise.
1.2.3 Speech Processing in AC
Although spectral and temporal representations play a role in speech perception, there is ample evidence for the promenence of temporal information over spectral information.
1.2.3.1 Perceptual Evidence for Temporal Information
Research on cochlear implants has demonstrated the prominence of temporal in-formation in speech. Cochlear implants use channels, which sum the amplitude of a series of frequency bands and run a proportional electric current onto the ANF's corresponding to this frequency band. Friesen et al. [21] have demonstrated that only seven channels are adequate for speech perception in cochlear implants, and that similar results can be achieved by presenting hearing subjects with AM noise whose AM is proportional to the amplitude within a series of channels associated with contiguous frequency bands. Moreover, Shannon et al. [70] have demon-strated that many consonants can be effectively perceived when represented with as few as three AM channels.
1.2.3.2 AM and FM Sensitivity in Speech Processing
AM and FM sensitivity seem to play a key role in perceiving this temporal in-formation. Tallal et al. [72] have shown that subjects with language impairment do not have difficulty perceiving steady-state vowels, but do have difficulty with consonants and dipthongs. Moreover, Drullman et al. [15] show that filtering the temporal envelope from a speech signal seriously affects perception of consonants and dipthongs. Both consonants and dipthongs with a steady-state pitch require a transition within the vocal tract filter. In the spectrum, changes in the vocal tract filter result in changes in the amplitude of the harmonics.
As was stated above, pitch is a major component in speech processing, and per-ceiving changes in pitch seems to depend on temporal sensitivity. Sayles and Win-ter [64] studied pitch perception by running a harmonic structure through various channels that preserve both the spectral and temporal indications of pitch, and de-grade the temporal information by introducing reverberation. Reverberation in-terferes with the representation of periodicity in the ANF. The study found that degrading temporal information in the channels seriously degraded pitch percep-tion.
1.2.4 Effects of Sound and Speech on Other Regions
AC is the highest region in the auditory pathway in which there is a known
tono-topic representation of the spectrum. This being said, there are regions which respond to auditory stimuli in ways that suggest higher-level tasks such as syntac-tic parsing, lexical access, semansyntac-tic computation, and pattern recognition. Deter-mining the functionality of these regions is a very difficult task which is prone to
speculation.
1.2.4.1 The Insula
In mammals in which the region has been investivated, the Insula (Brodmann areas
13 and 16) serves a number of sensory regions, including the visceral sensory,
motor, motor association, vestibular, and somatosensory areas. Its role in auditory processing has yet to be defined [6].
Brain Architecture and Connectivity. Humans possess a larger left than right
insula [6]. Immunostaining reveals that it is divided into a frontal agranular belt (FI), a middle dysgranular belt, and a posterior agranular belt (PI) [6]. Its connec-tivity to the auditory pathway suggests that it processes several levels of represen-tation of the input. Recording auditory evoked potentials frin tge medial genicu-late body shows significant connectivity with the parainsular field and the PI [10]. Moreover, PI receives projections from AII, and has some limited connectivity to AI and All [68]. Each insula projects fibers across the corpus callosum in close proximity to fibers from the auditory cortex [68].
Bilateral Functionality. There is limited evidence that some of the insula's
func-tionality in auditory processing depends on bilateral interaction. In Hyman and Tranel [34], a patient had two strokes affecting both PI's, the right opercular cor-tex and the right temporal lobe. Immediately after the first stroke, she had rapidly improving hemiparesis. After the second, she did not react to any sound or speech
stimuli and was totally mute. She eventually recovered but still had receptive aprosodia, receptive amusia, poor pitch discrimination, poor tone discrimination, and poor identification of environmental sounds and recognition of famous voices. The insula seems to activate bilaterally when a subject performs higher-order pattern recognition. Engelien et al. PET-scanned stroke victims and healthy sub-jects [19]. For the latter, passive listening to sounds activated the auditory cortices bilaterally. One stroke victim had two consecutive strokes in the perisylvian areas that included the insulae bilaterally, resulting in auditory agnosia immediately after the second stroke. Eight years later, he could discriminate all sounds and occas-sionally identify environmental sounds, but had problems with speech perception. fMRI studies by Kiehl et al. showed greater activation of the insulae with target stimuli than with novel stimuli [37]. Paulesu et al. assessed the role of verbal short-term memory [51]. When subjects were presented with letters and produced rhymes, there was significant bilateral activation of the insulae. The authors con-cluded that the insulae were involved in sub-vocal processing.
Unilateral Functionality. There is evidence that the left insula is involved in
processing rhythm stimuli and temporal aspects of prosody. Platel et al. scanned the cerebral structures involved in the appreciation of music, finding that the left
insula was involved in rhythm detection [53]. Rumsey et al. examined the neural pathway involved in phonological versus orthographic strategies of word recogni-tion, sounding out the word versus visually and linguistically analyzing the written word in order to read it [62]. Orthographical and phonological pronunciation tasks activated the left insula. Moreover, the left insula in non-human primates demon-strates sensitivity to vocalization. Remedios et al. have shown that rhesus monkeys exhibit marked activation of the left-lateral insula in response to vocalization [58].
These results seem to indicate that left PI is highly responsive to temporal stim-uli, whereas the bilateral functionality of the insula seems more associated with more stationary sounds. However, the insula is so multi-faceted in its sensory functionality that it is difficult to draw any conclusions.
1.2.4.2 Posterior Superior Temporal Gyru(Wernicke's Area)
This area, located in the posterior section of the superior temporal gyrus, in Brod-mann area 22, encircles AC along the Sylvian fissure. This area is traditionally believed to be associated with language, since it was discovered that lesions in this region caused receptive aphasia [47]. Patients with this condition tend not have
difficulty with grammar or prosody, but produce meaningless, nonsense sentences and display difficulty comprehending words [47]. Moreover, Harpaz et al. [30] used Transcranial Magnetic Simulation (TMG) to suggest that Wernicke's area in the non-dominant hemisphere is used to resolve lexical ambiguities.
One major issue with any research in Wernicke's area is that its anatomical boundaries, and to some degree its functionality, are highly ambiguous. Wise et al. [74] identify three distinct regions with unique response patterns. One region, directed along the supratemporal cortical plane, responded to both non-linguistic vocalization and speech sounds. The most posterior and medial region was linked to speech production. The third region, in the posterior left superior temporal sul-cus, responded to external sources of speech and recall of lists of words in verbal fluency tasks. It is not safe to conclude that Wernicke's is associated primarily with lexical access. Rather, it displays a much wider range of functionalitites which may include lexical access.
1.2.4.3 Inferior Frontal Gyrus(Broca's Area)
Broca's area is located near the inferior frontal gyrus and Brodmann Areas 44 and 45, although it is largely localized using activation patterns rather than morpho-logical landmarks [27]. Traditionally, it has been associated with syntax, gram-mar, computation, and other hierarchical processing tasks [47], an assumption that arises from the observation that patients with lesions in this region often have dif-ficulty producing or comprehending syntactically complex sentences. Although Broca's area has also been associated with working memory, neuroimaging studies
by Grewe et al. [26] support the traditional view that this region is associated with
hierarchical language processing.
1.3 ASD and Speech
Speech is highly distributed across the brain [47], and many of the symptoms of
ASD are particular to speech. Therefore, it is reasonable to hypothesize that
inter-connectivity among different brain regions, discussed in the Introduction ( 1) may account for speech-specific symptoms of ASD. According to the American Psy-chological Association's definition of autism [5], symptoms include (1) delay in development of spoken language, or lack thereof, (2) marked difficulty in sustain-ing communication for children with speech, (3) stereotyped and repetitive use of language, and (4) lack of make-believe or social imitative play appropriate to de-velopmental level. Moreover, there is evidence that there are significantly different
responses to speech in certain brain regions, and that these differences involve the auditory pathway's dual strategy of representing a signal temporally and spectrally.
1.3.1 ASD Symptoms Pertaining to Language Development
Between one-third to one-half of all ASD indivuals do not develop adequate lan-guage abilities to conduct basic communication, and those who do often demon-strate highly idiosyncratic use of speech and language [45]. These idiosyncracies can be classified into three categories, both related to socially salient areas of lin-guistic development -(1) phonological, (2) semantic/pragmatic, and (3) prosodic.
1.3.1.1 Phonological
Although many high-functioning ASD individuals show an ability to learn the pho-netics of their native language, the learning process exhibits significant differences.
ASD children show a delayed onset of babbling which is followed at ages 2-3 with
a reduced frequency of other communicative forms such as consonants, words, word combinations, and gestures [39]. It is significant that these consonants and words depend heavily on temporal information.
1.3.1.2 Semantic/Pragmatic
At every stage of linguistic development, verbal ASD children display difficulties in learning to behave in terms of their role in the conversation. They tend not to coordinate their gestures with their sentences, or arbitrarily associate particular gestures with particular words. When they acquire rudimentary language skills, they often repeat what is being said to them (echolalia), or reverse their pronouns
[39]. At around 8-10 years of age, many high-functioning ASD individuals display
abnormally large vocabularies, although they have difficulty contextualizing words in a discourse [39]. In later stages of life, these difficulties manifest themselves as difficulties with non-verbal communication, interpreting inference, and reading the emotional tone of a conversation [48].
1.3.1.3 Prosodic Development
Prosody covers aspects of speech which mostly involve pitch and amplitude mod-ulation. Pitch contour in language can communicate many different types of infor-mation. In the case of tone languages and pitch-accent languages such as Mandarin or Swedish, it identifies the word itself. Different languages often have set pitch patterns which can define the major portions of a sentence. For example, Farsi de-fines different pitch contours for the subject and predicate of a declarative sentence,
and a rising intonation in English indicates a question. Pitch contours can be used to emphasize information in the sentence, such as in "Mary washed the car" ver-sus "Mary washed the car". Finally, pitch contours can communicate non-verbal information such as sarcasm, irony, or enthusiasm.
One linguistic feature of ASD is abnormal prosody, which includes monotonic or machine-like intonation, repetitive intonations which are unrelated to the content or context of a sentence, difficulties in use of pitch and control of volume, deficiencies in vocal quality, and aberrant stress patterns [46]. It is difficult to classify these prosodic differences in terms of one feature, since there are many parameters along which a prosodic pattern can vary. For example, some autistic children have been shown to have a larger-than-normal or smaller-than-normal pitch range in their speech, but place stress and intone their sentences normally, whereas others may have a normal pitch range but aberrant stress patterns [66].
Difficulties with prosodic development are apparent even in the babbling stage, when ASD children tend not to synchronize their vocalization with those around them [46]. Le Normand et al. [46] collected spontaneous speech samples of autis-tic children and noautis-ticed a parautis-ticular difficulty with declarative and interrogative sentences. This being said, prosodic development does not seem entirely unrelated to their environment. Paccia and Curcio [49] have conducted several behavioral studies which demonstrated that many ASD children, in echolalia, sometimes in-vert or systematically transform the pitch contour of the speaker, suggesting that they have some capability of prosodic parsing.
These results serve as a caveat to any attempt to pinpoint ASD issues with prosody and auditory processing on any single brain region. ASD children's dif-ficulties in learning temporally complex speech could indicate some fundamental difference in the mechanisms of temporal auditory processing, or it could indicate that the difference may arise from how to interpret and meaningfully react to the speech, which would implicate higher-order cognitive processing.
1.3.2
ASD and Auditory Processing
Despite the above-mentioned caveats, it is still useful to relate ASD prosodic pat-terns and processing pitch and other temporally complex features of a stimulus. Interestingly, ASD differences in prosody do not seem to implicate directly the mechanisms of pitch-processing itself. Bonnel et al. [9] showed that ASD indi-viduals have superior perfromance in pitch distrimination tasks. However, there