Assessment of mental workload: A new electrophysiological method based on intra-block averaging of ERP amplitudes
7
0
0
Texte intégral
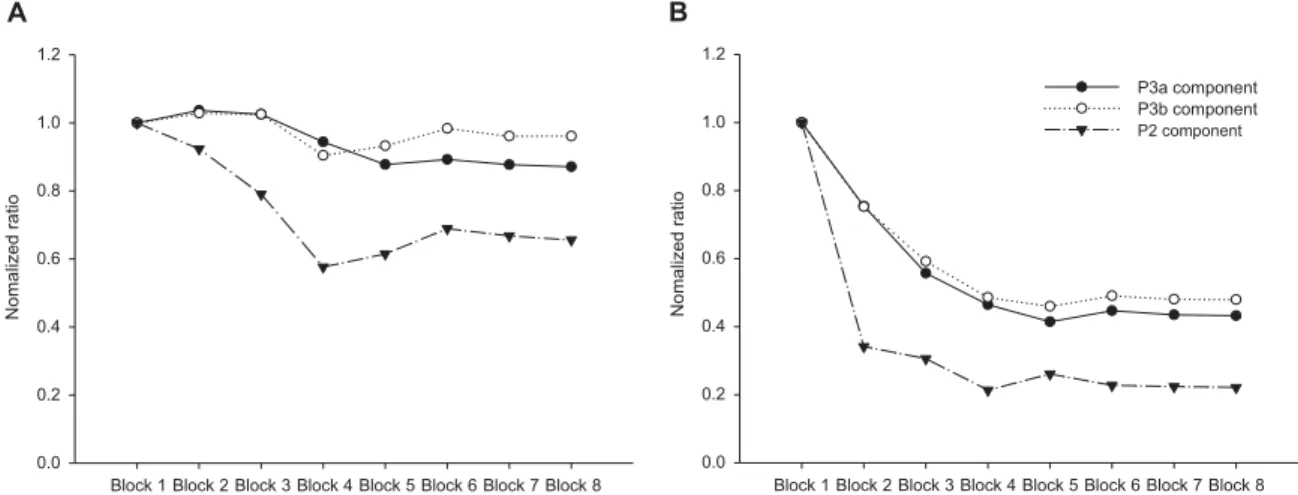
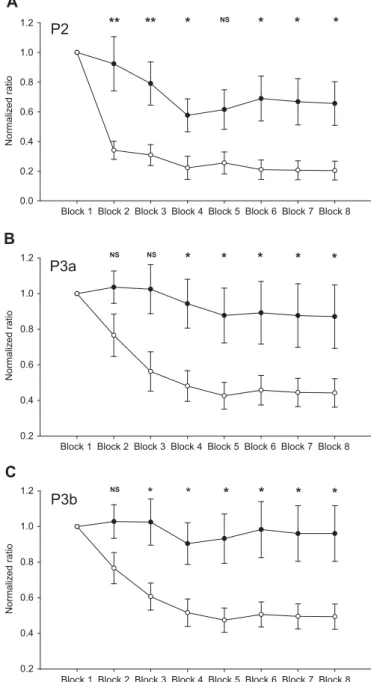
Figure
Documents relatifs