HAL Id: hal-01542746
https://hal.sorbonne-universite.fr/hal-01542746
Submitted on 20 Jun 2017
HAL is a multi-disciplinary open access
archive for the deposit and dissemination of
sci-entific research documents, whether they are
pub-lished or not. The documents may come from
teaching and research institutions in France or
abroad, or from public or private research centers.
L’archive ouverte pluridisciplinaire HAL, est
destinée au dépôt et à la diffusion de documents
scientifiques de niveau recherche, publiés ou non,
émanant des établissements d’enseignement et de
recherche français ou étrangers, des laboratoires
publics ou privés.
albedo from satellite observations: a useful tool to
evaluate model simulations
J.P Boisier, N. de Noblet-Ducoudré, P. Ciais
To cite this version:
J.P Boisier, N. de Noblet-Ducoudré, P. Ciais. Inferring past land use-induced changes in surface albedo
from satellite observations: a useful tool to evaluate model simulations. Biogeosciences, European
Geosciences Union, 2013, 10 (3), pp.1501 - 1516. �10.5194/bg-10-1501-2013�. �hal-01542746�
Biogeosciences, 10, 1501–1516, 2013 www.biogeosciences.net/10/1501/2013/ doi:10.5194/bg-10-1501-2013
© Author(s) 2013. CC Attribution 3.0 License.
EGU Journal Logos (RGB)
Advances in
Geosciences
Open Access
Natural Hazards
and Earth System
Sciences
Open AccessAnnales
Geophysicae
Open AccessNonlinear Processes
in Geophysics
Open AccessAtmospheric
Chemistry
and Physics
Open AccessAtmospheric
Chemistry
and Physics
Open Access DiscussionsAtmospheric
Measurement
Techniques
Open AccessAtmospheric
Measurement
Techniques
Open Access DiscussionsBiogeosciences
Open Access Open Access
Biogeosciences
Discussions
Climate
of the Past
Open Access Open Access
Climate
of the Past
Discussions
Earth System
Dynamics
Open Access Open Access
Earth System
Dynamics
DiscussionsGeoscientific
Instrumentation
Methods and
Data Systems
Open Access
Geoscientific
Instrumentation
Methods and
Data Systems
Open Access DiscussionsGeoscientific
Model Development
Open Access Open Access
Geoscientific
Model Development
DiscussionsHydrology and
Earth System
Sciences
Open AccessHydrology and
Earth System
Sciences
Open Access DiscussionsOcean Science
Open Access Open Access
Ocean Science
DiscussionsSolid Earth
Open Access Open Access
Solid Earth
DiscussionsThe Cryosphere
Open Access Open Access
The Cryosphere
DiscussionsNatural Hazards
and Earth System
Sciences
Open Access
Discussions
Inferring past land use-induced changes in surface albedo from
satellite observations: a useful tool to evaluate model simulations
J. P. Boisier1,2, N. de Noblet-Ducoudr´e1, and P. Ciais11Laboratoire des Sciences du Climat et de l’Environnement, Institut Pierre Simon Laplace, UMR8212, Gif-sur-Yvette, France 2Now at the Institut Pierre Simon Laplace, Universit´e Pierre et Marie Curie, Paris, France
Correspondence to: J. P. Boisier (jpboisier@ipsl.jussieu.fr)
Received: 30 July 2012 – Published in Biogeosciences Discuss.: 14 September 2012 Revised: 11 February 2013 – Accepted: 14 February 2013 – Published: 7 March 2013
Abstract. Regional cooling resulting from increases in
sur-face albedo has been identified in several studies as the main biogeophysical effect of past land use-induced land cover changes (LCC) on climate. However, the amplitude of this effect remains quite uncertain due to, among other factors, (a) uncertainties in the extent of historical LCC and, (b) dif-ferences in the way various models simulate surface albedo and more specifically its dependency on vegetation type and snow cover. We derived monthly albedo climatologies for croplands and four other land cover types from the Moder-ate Resolution Imaging Spectroradiometer (MODIS) sModer-atel- satel-lite observations. We then reconstructed the changes in sur-face albedo between preindustrial times and present-day by combining these climatologies with the land cover maps of 1870 and 1992 used by seven land surface models (LSMs) in the context of the LUCID (“Land Use and Climate: identifi-cation of robust Impacts”) intercomparison project. These re-constructions show surface albedo increases larger than 10 % (absolute) in winter, and larger than 2 % in summer between 1870 and 1992 over areas that experienced intense deforesta-tion in the northern temperate regions. The historical surface albedo changes estimated with MODIS data were then com-pared to those simulated by the various climate models par-ticipating in LUCID. The inter-model mean albedo response to LCC shows a similar spatial and seasonal pattern to the one resulting from the MODIS-based reconstructions, that is, larger albedo increases in winter than in summer, driven by the presence of snow. However, individual models show significant differences between the simulated albedo changes and the corresponding reconstructions, despite the fact that land cover change maps are the same. Our analyses sug-gest that the primary reason for those discrepancies is how
LSMs parameterize albedo. Another reason, of secondary importance, results from differences in their simulated snow extent. Our methodology is a useful tool not only to infer observations-based historical changes in land surface vari-ables impacted by LCC, but also to point out deficiencies of the models. We therefore suggest that it could be more widely developed and used in conjunction with other tools in order to evaluate LSMs.
1 Introduction
Human-induced land cover change (LCC) has modified large portions of the natural landscape since pre-agricultural times, and deforestation has been particularly extensive in the Northern Hemisphere temperate regions (Hurtt et al., 2006). Surface albedo is a key element in LCC-related climate change studies, as it controls the magnitude of energy ab-sorbed by land surfaces, which heats the land and drives tur-bulent fluxes. In temperate latitudes, the radiative effects of deforestation is particularly large because non-forested lands reflect about 5 % (absolute) and 30 % more solar radiation than forests in respectively snow-free and snow-covered con-ditions (Jin et al., 2002; Gao et al., 2005).
As spatially coherent global observations of land surface properties only exist for the satellite period, impacts on cli-mate of large-scale historical LCC have been principally as-sessed using global climate models instead of observations. Most of these numerical results show that past LCC has prin-cipally led to cooling in the northern extratropics through the increase in surface albedo. This albedo-induced cool-ing opposes the warmcool-ing induced by non-radiative effects of
deforestation such as decreases in evapotranspiration, which tends to predominate at lower latitudes (e.g. Govindassamy et al., 2001; Bounoua et al., 2002; Feddema et al., 2005; Betts et al., 2007; Kvalev˚ag et al., 2010; Davin and de Noblet-Ducoudr´e, 2010). Changes in surface albedo have usually been characterized and quantified by means of the radia-tive forcing concept in order to compare the global impact of LCC to those driven by other climate forcings (Hansen et al., 1998; Betts, 2001; Matthews et al., 2003; Myhre and Myhre, 2003; Betts et al., 2007; Davin et al., 2007; Forster et al., 2007).
Myhre et al. (2005) estimated the LCC-induced changes in surface albedo and the resulting radiative forcing based on present-day albedo observations of the Moderate Resolution Imaging Spectroradiometer (MODIS). Their results show weaker albedo changes between pre-industrial and present-day conditions than other published numerical studies, in part because of the lower MODIS-derived crops albedo values.
In the context of the “Land Use and Climate: identification of robust Impacts” (LUCID) project (Pitman et al., 2009), a coordinated set of simulations was realized using seven global climate models to evaluate the robust biogeophysical impacts of LCC since the preindustrial period. These sim-ulations prescribed two different land cover distributions of 1870 and 1992. One robust result from LUCID is that the models systematically simulate increases in surface albedo in response to past LCC. Although in most models the near surface cools down throughout the year, some simulate sea-sonal warming due to a dominant impact of the non-radiative effects (de Noblet-Ducoudr´e et al., 2012). Even though the simulated change in surface albedo shows a common direc-tion, its magnitude varies significantly from one model to the other. Such inter-model dispersion has two main causes, as discussed in Boisier et al. (2012): differences in the models’ albedo sensitivity to LCC and differences in land cover maps prescribed in each of them. Although all the land surface models (LSMs) embedded in LUCID climate models used as reference the same crop and pasture extents for both years 1870 and 1992, modelers have implemented them using dif-ferent procedures into their own standard vegetation maps. This has induced significant differences in the deforestation rates that each LSM deduced between the preindustrial times and present-day (ranging from ∼ 4 to 10 million km2 glob-ally) and, therefore, in the simulated climate responses to LCC.
It is rather difficult to evaluate the accuracy of the recon-structed land cover maps in LUCID, as there are many uncer-tainties in identifying what has been the actual anthropogenic LCC. One source of uncertainty results from the reconstruc-tion of the historical record of cropland and pastureland. An-other one may come from current land cover characteriza-tion as discussed in Feddema et al. (2005) and de Noblet-Ducoudr´e et al. (2012). Moreover, we often know little about the specificities of land conversion to croplands (i.e. defor-estation or conversion from previously grass-covered area)
although some initiatives have started to address this issue (e.g. Hurtt el al., 2006). With respect to the surface albedo sensitivity to LCC, variations between models result from the snow cover simulated and different land surface parameteri-zations, such as the one used for cropland albedo (Matthews et al., 2003; Myhre and Myhre, 2003). The realism of this sensitivity should be assessed using observational datasets. This is what we are trying to do in this paper.
In this study we develop a method (Sect. 2) to reconstruct past changes in surface albedo using satellite data. Land sur-face products from MODIS are used to derive seasonally and spatially varying albedo values for different land cover types under snow-covered and snow-free conditions. This infor-mation is then combined with land cover and snow cover maps to reconstruct preindustrial and present-day albedo cli-matologies. After an evaluation of the methodology adopted (Sect. 3), we estimate the albedo response to the different scenarios of land conversion used within the LUCID project (Sect. 4.1). We then evaluate the LUCID models’ albedo sen-sitivity to deforestation in relation to their simulated snow cover (Sect. 4.2). We finally evaluate the impacts of LCC on the solar radiation budget at the surface based on the simu-lated and reconstructed albedo changes (Sect. 4.3). Discus-sion and concluDiscus-sion are presented in Sect. 5.
2 Material and methods
The datasets used in this study gather satellite products and global simulations from the LUCID model intercomparison project (Table 1). The MODIS shortwave broadband bihemi-spherical reflectance (white-sky albedo) and snow cover data (MCD43C3; Schaaf et al., 2002; Gao et al., 2005), in addition to the land cover product (MCD12Q1; Friedl et al., 2010), were used to derive snow-free and snow-covered albedos of different land cover types (Sect. 2.1).
Earlier studies have compared the MODIS albedo re-trievals with in situ observations showing generally good agreements (e.g. Liang et al., 2002; Liu et al., 2009; Cescatti et al., 2012). However, the possibility of important biases at large solar zenith angles over snow-covered surfaces has also been discussed (Liu et al., 2009; Wang and Zender, 2010; Schaaf et al., 2011). This study does not address this issue since the regions we are interested in (those experiencing substantial LCC since the preindustrial period) lie at lower latitudes than those affected with the potential albedo biases. We use the diffuse (white-sky) albedo from MODIS in-stead of the direct beam (black-sky) component because it is a good approximation of the daily mean surface albedo and comparable to that simulated in climate models. Nonethe-less, since the results shown here involve variations between the albedo of different land cover types, there is little impact on the choice of either white- or black-sky albedo, since the difference between them mainly depends on the solar zenith angle (i.e. the latitude and season) and not on vegetation type.
Table 1. Dataset summary.
Sources Variablesa Period Description and references
MODIS (LP DAAC) α, SC, LC 2000–2011 Bihemispherical shortwave reflectance (white-sky albedo), snow cover (MCD43C3;
Gao et al., 2005) and land cover (MCD12Q1; Friedl et al. (2010)) products MCD12Q1; Friedl et al. (2010).
AVHRR/ SMMR/ SSM/I (NSIDC) SC, SWE 1979–2006 Global monthly EASE-grid Snow Water Equivalent Amstrong et al. (2005). LUCID simulations 1970–1999 30 yr runs (5 ensemble members) carried
α, LC, SC, out by 7 GCM/LSMsbwith prescribed SWE, SN, SST/SIC from 1970 to 1999. Preindustrial SD, T2 m and present-day simulations prescribed land
cover of 1870 and 1992, respectively de Noblet Ducoudr´e et al. (2012). aSurface albedo (α), snow cover fraction (SC), land cover (LC), snow water equivalent (SWE), net (S
N)and downward (SD)shortwave radiation and 2-meter temperature (T2 m).b GCM/LSMs: ARPEGE/ISBA (Salas-M´elia et al., 2005; Voldoire et al., 2006), CCAM/CABLE (McGregor and Dix, 2008; Abramowitz et al., 2008], CCSM/CLM (Collins et al., 2006; Oleson et al., 2008), ECEARTH/TESSEL (van den Hurk et al., 2000), ECHAM5/JSBACH (Roeckner et al., 2006; Raddatz et al., 2007), IPSL/ORCHIDEE (Marti et al., 2010; Krinner et al., 2005) and SPEEDY/LPJmL (Strengers et al., 2010; Bondeau et al., 2007).
The MODIS albedo and the National Snow and Ice Data Center (NSIDC) snow cover dataset (Armstrong et al., 2007) were used, in combination with present-day (1992) and pre-industrial (1870) land cover maps from LUCID mod-els (Sect. 2.2), to reconstruct surface albedo climatologies of both time periods.
2.1 MODIS data processing
The flowchart illustrated in Fig. 1 summarizes our method-ology for reconstructing surface albedo maps based on the MODIS data. To start with, white-sky albedo, snow cover and land cover data from MODIS were used to assign snow-covered and snow-free albedo values to four groups of veg-etation (crops, grasses, evergreen trees and deciduous trees) and to bare soil. These five land cover groups (LCGs) were defined in order to have a broadly comparable land cover partitioning between the MODIS data and the LSMs as-sessed here (Sect. 2.2). As the definition of vegetation varies from one model to another, this grouping ensures consistency when making reconstructions. We used the plant functional type (PFT) classification of the MODIS MCD12Q1 prod-uct in order to disambiguate the grouping onto the different LCGs (as could occur in biome-type classifications includ-ing mixed vegetation types such as e.g., savannas). Shrub PFTs in the original MODIS land cover and in some LU-CID LSMs were considered as grasses. Since the MODIS in-formation does not exhibit significant large-scale LCC dur-ing the 2001–2011 period, we used a sdur-ingle year (2001) in our analyses. The original 500 m resolution land cover map was aggregated onto the same 5.6 km resolution grid of the MODIS albedo product used here.
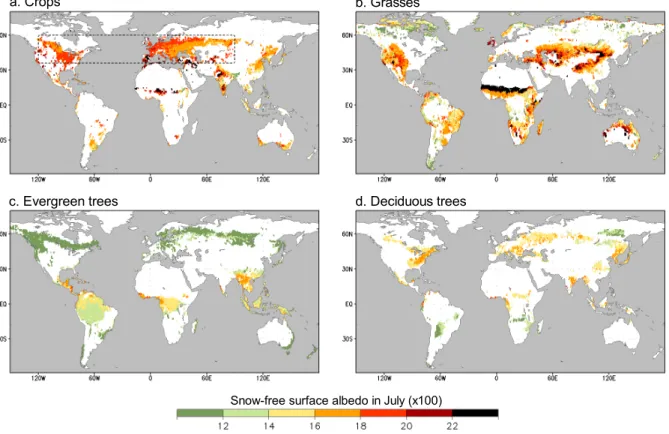
From the MODIS dataset at 5.6 km resolution (0.05◦ grid), we derive climatological (2000–2011) monthly albedo maps at 2.0◦×2.0◦for each of the five LCGs. First, we consider only the 0.05◦grid cells showing a dominant fractional area (larger than 95 %) of a given LCG. The monthly snow-free and snow-covered albedo values of the available pixels for each LCG are separated and aggregated onto larger cells of 0.5◦×0.5◦ . An example of valid grid cells retained in the 0.5◦maps (i.e. with at least one sub-pixel with dominant land cover) is illustrated in Fig. 2. This figure shows the snow-free albedo in July for the four classes of vegetation within the LCGs, indicating those regions with dominant land cover such as the case of croplands, which are extensive in North America, Eurasia and India (Fig. 2a). Grasses are predomi-nantly present in the North American Great Plains, in central Eurasia or in the Sahelian band (Fig. 2b). Evergreen trees are the major LCG in tropical and boreal forest (Fig. 2c), while deciduous trees dominate in some areas such as in eastern North America (Fig. 2d). Besides desert regions, grid cells with a dominant fraction of barren soil are found sparsely in other regions of the globe (not shown).
The LCG albedo values in grid cells lacking of dominant vegetation were derived by bilinear interpolation of the valid pixels. The resulting global monthly albedo maps at 0.5◦ res-olution were finally regridded onto a 2.0◦grid, the one used to combine and compare the ensemble LUCID simulations and the satellite data.
This method allows capturing the spatial and seasonal albedo variability of each LCG resulting, among other causes, from the plant life form heterogeneity (e.g. broad-leaved vs. needle-broad-leaved plants) or from the leaf area in-dex (LAI) distribution within the concerned LCG. In this sense, it is important to note that the albedo values ex-tracted from the dominant LCGs do not represent the albedo of the canopy, but the one resulting from both the canopy
MODIS Surface albedo, land cover and snow cover data from 2000 to 2011
LUCID
Land cover maps of 1870 and 1992 from 7 LSMs NISDC Monthly snow cover data from 1979 to 2006
(1) Snow-free and snow-covered albedo climatologies (at 0.05º) (2) The albedo of five land cover groups (LCGs) is upscaled (globa-lly) from grid-cells with dominant land cover (LCG’s areal fraction larger than 95%)
Snow-free and snow-covered al-bedo climatologies for each LCG (monthly maps)
Reconstructed 28-yr (1979-2006) monthly sur-face albedo based on both land cover maps of 1870 and 1992 of each LSM
Fig. 1. Flowchart of the methodology used to compute surface albedo climatologies for land cover maps of 1870 and 1992 based on satellite data.
and soil reflectance. Consequently, the albedo of pixels with low LAI, such as of extratropical regions in winter, will be highly influenced by the soil albedo. Separating both com-ponents (canopy and soil albedo), although possible using MODIS datasets (e.g. Rechid et al., 2009), is beyond the aim of this study.
2.2 Model data
The set of LUCID simulations assessed here are 30 yr runs carried out by seven global circulation models (GCMs) cou-pled to LSMs (Table 1; hereafter GCM/LSMs). Two types of simulations were computed to assess the impacts of LCC between the preindustrial (PI) period and present-day (PD). They only differ by the land cover maps prescribed in each LSM, representing the vegetation of 1870 in one case and that of 1992 in the other. Each type of simulation was run in ensemble mode (with 5 members) and used prescribed monthly varying sea surface temperature and sea ice con-centration (from 1970 to 1999), as well as fixed atmospheric CO2concentration of 375 ppm.
The differences between the land cover maps of 1870 and 1992 prescribed in LSMs are based on the historical cropland and pastureland reconstructions of the SAGE (Ramankutty and Foley, 1999) and HYDE (Klein Goldewijk, 2001) datasets, respectively. As com-mented in Sect. 1 and discussed in de Noblet-Ducoudr´e et al. (2012), despite the fact that all the modelers that partici-pated in LUCID used the same agricultural dataset, the vari-ous LSMs prescribed quite different LCC. These differences
are the result of incorporating the agricultural land cover units over uneven (natural or observed) vegetation maps, as well as of adopting different rules to do it in the vari-ous LSMs. The strategy chosen to represent agricultural land cover into a given vegetation map is also constrained by the structure of each LSM, such as the PFT classification or the number of them shared within a grid cell. For more details on the modeling experiment carried out within LUCID see de Noblet-Ducoudr´e et al. (2012). The list of GCM/LSMs and their references are provided in Table 1.
2.3 Surface albedo reconstructions
The MODIS-based surface albedo reconstructions for prein-dustrial times and for present-day conditions are computed combining (a) the land cover map of 1870 and 1992 of each LUCID LSM, (b) the monthly albedo maps of each LCG de-rived from MODIS, and (c) the monthly NISDC snow cover from 1979 to 2006 (Fig. 1). We used the NISDC snow cover dataset instead of the MODIS snow cover product because of its larger period of availability (large enough for a robust cli-matology) and its better coherence in time with LUCID sim-ulations, which cover the 1970–1999 period. The net albedo in a given grid cell and month is calculated as follows:
α =X
v
Fv[(1 − f ) αvsf+f αvs], (1)
where αsfv and αvs are respectively the MODIS-derived
snow-free and snow-covered albedos of the LCG v. Fv
is the grid area fraction of LCG v, and f is the snow cover fraction of the corresponding grid cell, assumed to be independent of LCG.
In summary, 28 yr monthly albedo maps (period deter-mined by the availability of the NSIDC snow cover data) were computed for both the preindustrial (1870) and the present-day (1992) land cover maps of each of the seven LUCID GCM/LSMs. Both time periods are assumed here to have the same snow cover distribution (the present-day one from NISDC), so that the albedo difference between them only estimates the direct effect of LCC. That is, the indirect LCC impacts on surface albedo such as the one in-duced by changes in snow cover are not taken into account. Differences between the reconstructed (MODIS-based) albe-dos and those simulated by each GCM/LSM are used in the following to diagnose the parameterization of the mod-els that may explain this difference, and the resulting albedo sensitivities to LCC.
In order to evaluate the skill of the method used to re-construct albedo accurately (Sect. 3), another rere-constructed albedo dataset was computed in the same way described above, but using the land cover map and the 12 yr snow cover data of MODIS instead of the LUCID land cover maps and the NSIDC snow cover. Hence, since this reconstruction only uses information from MODIS, its difference with the original MODIS albedo climatology measures the error of
a.Crops b.Grasses
Snow-free surface albedo in July (x100)
c.Evergreen trees d.Deciduous trees
Fig. 2. Snow-free surface albedo in July derived from MODIS. Maps indicate the available grid cells of 0.5◦(containing sub-cells with dominant land cover; see text) associated to four land cover groups used in this study: crops (a), grasses (b), evergreen trees (c) and deciduous trees (d). Dashed box in (a) encompasses the land area of large deforestation between 1870 and 1992 further used for specific analyses.
our methodology in scaling up the subset albedo data ob-tained from grid cells with dominant vegetation.
3 Method evaluation: present-day albedo reconstruction
Figure 2 shows the snow-free albedo on July derived from MODIS in those grid cells that have associated dominant land cover within the four vegetated LCGs. Crops and grasses show larger albedo values than trees. Also notice-able are the larger albedo values of deciduous trees with re-spect to those of evergreen trees in the North Hemisphere, in accordance with previous findings using MODIS (Jin et al., 2002; Myhre et al., 2005; Gao et al., 2005) and with obser-vation (Cescatti et al., 2012). All groups of vegetation show clear spatial variations in their respective albedo maps, even at similar latitudes.
Table 2 indicates the mean albedo values resulting from the available grid cells at 0.5◦ within a region of particular interest because of its large LCC between 1870 and 1992. This region that includes parts of North America and Eura-sia (indicated by a dashed box in Fig. 2a) is used for specific analyses. The northern winter (December-January-February; DJF) snow-covered and snow-free albedo values, as well as
the snow-free values in June-July-August (JJA), are shown for the five LCGs. The resulting white-sky albedo for the four vegetation classes generally agrees with previous val-ues derived from MODIS (e.g. Gao et al., 2005). In summer, the snow-free albedo of crops and grasses are similar to each other (∼ 0.17–0.18), and exceeds by nearly 0.07 and 0.03 the albedo of evergreen and deciduous trees, respectively. It is noteworthy how much larger the snow-masking effect ex-erted by forest is, compared to that of herbaceous plants. In the case of evergreen trees, the snow-covered winter albedo averages 0.21 in the study area, almost three times lower than the one obtained for grasses (∼ 0.57).
In order to evaluate the global albedo reconstruction methodology, we have compared the reconstructed albedo based on the MODIS land cover and snow cover data to the original MODIS albedo (Fig. 3). The global albedo patterns of January and July from the MODIS climatology (Fig. 3a and b) are generally well reproduced by the reconstructions (Fig. 3d and e). These patterns are characterized by rela-tively high albedo (larger than 0.3) over deserts and snow-covered areas, notably in the northern mid- and high lati-tudes in January. By contrast, in regions with closed forest the albedo is below 0.15, such as in tropical rainforests or in boreal forests in July.
Fig. 3. Mean surface albedo in January (top) and July (bottom) based on MODIS (2000–2011) observations (a), (d) and reconstructions (b), (e). Difference between the reconstructed and the observed albedo (c), (f). Solid contours encompass regions with large LCC between 1870 and 1992 (areal fraction deforested larger than 10 %; see Fig. 5). Note the non-linear scale.
Table 2. MODIS seasonal mean shortwave broadband (0.3–5 µm) bihemispherical reflectance (white-sky albedo) for five land cover groups used in this study. Values averaged over the region of interest in the Northern Hemisphere extratropics∗.
DJF JJA
Land cover group snow-covered snow-free snow-free
Crops 0.546 ± 0.066 0.141 ± 0.023 0.178 ± 0.017
Grasses 0.568 ± 0.080 0.161 ± 0.023 0.176 ± 0.022
Evergreen trees 0.205 ± 0.035 0.094 ± 0.017 0.104 ± 0.012 Deciduous trees 0.244 ± 0.054 0.117 ± 0.021 0.153 ± 0.010
Bare soil 0.535 ± 0.112 0.205 ± 0.050 0.246 ± 0.055
∗The mean ± one standard deviation surface albedo values are indicated. Values
computed from the ensemble of grid cells (at 0.5◦) with dominant land cover within the area of study (indicated in Fig. 2a).
Quantitatively, the difference between the MODIS recon-structed and the observed mean albedo shows relatively small biases (< 0.01) in most land areas of the globe (Fig. 3c and f). Some substantial differences are, however, observed in regions such as in western North America, mid-Eurasia or in Australia. Most of these regions show rather large errors throughout the year (not shown) and in most cases corre-spond to areas lacking grid cells with dominant land cover in any specific LCG (Fig. 2). Therefore, in these regions of het-erogeneous land cover, the albedo values of each LCG were interpolated from those of remote areas, with potentially dif-ferent plant properties, soil colours, snow conditions, etc. These errors are important and could induce misleading es-timates of LCC-induced albedo changes in regions where the latter are of the same order as the corresponding bias.
Fig. 4. Monthly mean albedo in North America and Eurasia (the region of study is indicated in Fig. 2a). Solid and dashed lines indi-cate the observed and the reconstructed albedo values, respectively. Shaded area illustrates the ±1 mean absolute error as departures from the reconstructed net albedo, calculated between the recon-structed and the observed values of the ensemble of grid cells within the region studied.
However, for the purpose of this study, regions affected by large historical land use changes are principally located in the northern temperate regions (Fig. 5), in areas with small bi-ases (see solid contours in Fig. 3c and f, denoting the regions in which the prescribed deforestation between 1870 and 1992 exceeds 10 % of land fraction).
Forestfraction difference (1992-1870)
Fig. 5. Forest fraction difference between the preindustrial period and present-day (1992–1870) prescribed in LUCID land surface models (model mean). Dashed box indicates the land areas of large deforestation further used for specific analyses.
Figure 4 shows the mean seasonal cycle of the MODIS observed and reconstructed albedo averaged over the study area. In this region, the monthly mean albedo is character-ized by a strong seasonal cycle ranging from 0.15 in sum-mer to 0.35 in late winter, which roughly follows the snow cover extension (not shown). The reconstructed seasonal sur-face albedo pattern matches fairly well the observed albedo. In winter, the reconstructed albedo slightly overestimates the observed values, bias resulting from those regions showing systematically significant errors (Fig. 3c). The mean absolute error (MAE) between the reconstructed and observed albedo, calculated for each month with the ensemble of grid cells of the region of study, represents no more than 5 % of the net albedo in all seasons (indicated by shaded area in Fig. 4).
4 Results
4.1 Surface albedo changes between 1870 and 1992
Seven pairs of MODIS-based albedo reconstructions were calculated from each of the seven LUCID LSMs-specific present-day (1992) and preindustrial (1870) land cover dis-tributions. The MODIS-based estimated change in surface albedo was computed for each model as the difference be-tween the present-day (PD) and preindustrial (PI) climatolo-gies of the reconstructed dataset.
Figure 5 illustrates the forest fraction difference between 1870 and 1992 imposed in LUCID LSMs (model mean). Forest area loss dominates the historical LCC, notably in the northern temperate regions where the forest fraction de-creases by more than 30 % (absolute) over extensive areas. As explained in Sect. 2.2, although the sign and the spa-tial pattern of the LCC agree between the LUCID LSMs, the deforestation area varies widely between them. Within the area of large LCC we are particularly interested in
(indi-cated by a dashed box in Fig. 5), models CCAM/CABLE and ECEARTH/TESSEL show the larger decrease in for-est fraction, more than twice the deforfor-estation imposed in CCSM/CLM and ECHAM5/JSBACH (not shown).
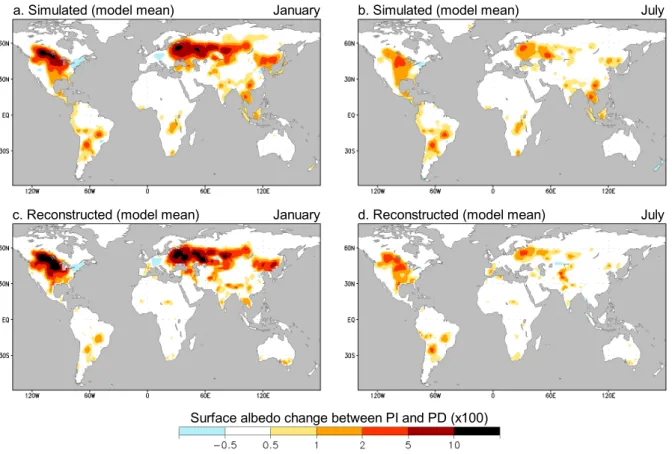
The simulated (LUCID) and reconstructed (MODIS-based) mean LCC-induced albedo differences (PD minus PI) in January and July are displayed in Fig. 6. This figure shows the multi-model mean albedo change for both the GCM/LSM simulations and the reconstructions. Both maps show strong albedo increases over areas that have experienced the largest deforestation between 1870 and 1992 (Fig. 5). In January, the albedo increases between PI and PD reach more than 10 % (absolute) in some areas. This is about five times larger the albedo increases simulated in July. This difference results from the snow-masking effect caused by the presence of for-est on the winter albedo. The simulated mean albedo change is very similar to the reconstructed one, although slightly weaker in January.
Despite the consistency shown by the model-mean sim-ulated and the reconstructed albedo change in response to LCC, there are significant discrepancies when look-ing at each model individually. For each of the LUCID GCM/LSMs, Fig. 7 illustrates the simulated and recon-structed monthly mean albedo changes between PI and PD averaged over the region studied of maximum LCC (Fig. 5). All models simulate a similar seasonal albedo change pat-tern characterized by marked maximum increases during the cold snowy season (black lines in Fig. 7). The amplitudes of the albedo anomalies between the winter and the sum-mer are, however, quite at variance from one model to an-other. For example, CCAM/CABLE simulates null albedo changes in summer and near +2 % (absolute) in winter, while ARPEGE/ISBA simulates albedo increases ranging from ∼ +1 % in summer to more than +5 % in winter. This is partly related to the different deforestation rates prescribed in each LUCID LSM, as discussed in de Noblet-Ducoudr´e et al. (2012) and Boisier et al. (2012).
Besides the different albedo responses to LCC of the LUCID GCM/LSMs, strong discrepancies exist be-tween the simulated and reconstructed albedo anomalies (shown as dashed lines in Fig. 7). The reconstructed winter albedo changes between PI and PD overestimate those simulated for five GCM/LSMs (CCAM/CABLE, CCSM/CLM, ECHAM5/JSBACH, IPSL/ORCHIDEE and SPEEDY/LPJmL) and underestimate them for two els (ARPEGE/ISBA, ECEARTH/TESSEL). Four mod-els also show marked discrepancies between the recon-structed and simulated summer (snow-free) albedo changes (ARPEGE/ISBA, CCAM/CABLE, ECEARTH/TESSEL and SPEEDY/LPJmL).
Figure 7h summarizes the surface albedo changes in re-sponse to LCC. This figure gives the model mean (lines) and range (shaded areas) of the simulated (black) and reconstructed (blue) albedo changes. The MODIS-based re-constructed albedo responses averaged across the models
a.Simulated (modelmean) b.Simulated (modelmean)
d.Reconstructed (modelmean) c.Reconstructed (modelmean)
Surface albedo change between PIand PD (x100) January
January
July
July
Fig. 6. LCC-induced surface albedo change (present-day minus preindustrial) in January (a), (c) and July (b), (d). Maps (a) and (b) indicate the model-mean albedo change directly obtained from LUCID simulations. Maps (c) and (d) illustrate the albedo change obtained from the MODIS-based reconstructions (the albedo change computed with the different LUCID models’ land cover maps are averaged). Note the non-linear scale.
Fig. 7. Monthly mean surface albedo response to LCC (present-day minus preindustrial) averaged over the region of study (box in Fig. 5). Solid and dashed lines illustrate respectively the simulated and the reconstructed albedo changes for each LUCID GCM/LSM (a–g). Panel (h) indicates the inter-model mean and range (shading) of the simulated (solid line and gray shading) and reconstructed (dashed line and blue shading) albedo change.
show a larger increase during the winter than the simulated one. Yet this difference remains smaller than the inter-model spread. It is noteworthy to examine how much larger is the inter-model range of simulated albedo change with respect to the MODIS-based reconstructed range. Since the latter only accounts for model differences in the imposed LCC, the larger range shown by the GCM/LSM simulations reveals the important contribution to the uncertainties in the simulated climate responses to LCC of the uneven model albedo sen-sitivities to land conversions. This result is in accordance to earlier conclusions from LUCID (Boisier et al., 2012).
Table 3 summarizes the annual mean albedo changes aver-aged over the global ice-free lands (i.e. excluding Antarctica and Greenland). The simulated model-mean albedo increases by 0.51 % (absolute) in response to LCC between 1870 and 1992, globally. This model-mean response hides quite different individual model responses ranging from 0.1 % (CCAM/CABLE) to 0.97 % (ECEARTH/TESSEL), that is, an inter-model range (0.87 %) larger than the model-mean albedo response. The model-mean albedo change derived from the reconstructions is similar to the albedo change sim-ulated, but the associated inter-model range of 0.33 % is sub-stantially lower than the one simulated.
Given that the land cover prescribed in each LUCID LSM is the same as the one used for the corresponding albedo re-construction, the albedo sensitivity to LCC of a single model can be quantified by the difference between its simulated and reconstructed albedo changes. This difference is principally explained by two causes, the first being the distinct snow cover extent simulated by each GCM/LSM with respect to that uniformly prescribed in the reconstructions (NSIDC). A related factor that should also contribute to the simulated albedo responses to LCC, which is not taken into account in the reconstructions, is the change in the snow cover and content between the two periods simulated. Such change, which could result from, e.g. a positive snow-albedo feed-back, was not identified as a significant driver of the win-ter albedo responses to LCC within the LUCID simulations (Boisier et al., 2012).
The second main cause behind the differences between the simulated albedo changes and the reconstructed ones is the intrinsic model albedo response to land cover perturbations for a given snow cover condition, which depends directly on the land surface parameterization and may differ from the es-timated response based on the MODIS data. Hence, the pa-rameterization of LSMs is responsible for the summer (snow-free) albedo responses to LCC, and should contribute par-tially to those resulting in snowy conditions. The relative role in the models’ winter albedo sensitivities to LCC of both the simulated snow coverage and the parameterizations of LSMs are examined in the following section.
4.2 Evaluating the LUCID models snow cover and albedo sensitivity to LCC
In order to evaluate the snow cover and snowpack simu-lated by the various GCM/LSMs, we compared their mod-eled snow extent and snow water equivalent (SWE) val-ues in the region studied. Figure 8a indicates the simulated winter (DJF) area within this region covered by a snow-pack of SWE equal or larger than the level indicated in the x-axis. The same relationship derived from the NSIDC data is also plotted as reference (dashed lines in Fig. 8a). The models as well as the NISDC dataset show that the most part of the study region (nearly 25 million km2)is cov-ered with snow of at least 1 mm in DJF. The snow-covcov-ered area decays asymptotically when increasing SWE. For ex-ample, no model shows an area larger than 7 million km2 covered with a snowpack of 80 mm SWE or larger. Three GCM/LSMs (ECEARTH/TESSEL, ECHAM5/JSBACH and SPEEDY/LPJmL) clearly simulate too small snow extent at different SWE levels with respect to what is diagnosed from the NISDC data, while ARPEGE/ISBA clearly over-estimates it. CCAM/CABLE and CCSM/CLM simulate larger snow-covered areas with relatively high SWE values (SWE > 50 mm) than those observed.
Comparing the results depicted in Fig. 7 and in Fig. 8a, it is clear that the discrepancies between the snow cover sim-ulated in the study region and that observed (NISDC) are not the sole cause accountable for the differences between the simulated and reconstructed LCC-induced winter albedo changes (the NISDC snow cover is the one used for the re-constructions). For instance, IPSL/ORCHIDEE shows quite a good concordance in terms of snow content and extent with respect to the reference dataset, but the simulated change in surface albedo between PI and PD nevertheless underesti-mates the reconstructed one in winter.
To evaluate the model albedo sensitivity to LCC indepen-dently from the magnitude of the land cover perturbation we use normalized albedo anomalies. These anomalies are cal-culated, in a given grid cell, as the net surface albedo change between 1870 and 1992 (1α) divided by the corresponding change in the total fraction of herbaceous vegetation 1FH
(i.e. the sum crops and grasses): 1Nα =
1α 1FH
. (2)
1Nα represents the expected albedo change induced by
total deforestation when both the bare soil fraction and snow-pack are kept constant (few grid cells within the LUCID models show significant changes (> 5 %) in bare soil frac-tion and are excluded in the analysis, as well as those pixels showing absolute SWE changes larger than 10 mm since pre-industrial times).
The northern winter (DJF) mean values of 1Nα
simu-lated by each GCM/LSM at different grid cells are plotted as a function of SWE in Fig. 8b. This figure gives 1Nα
Fig. 8. (a) Total area within the region of study (box in Fig. 5) in DJF with snow water equivalent (SWE) levels higher than the value indicated in the x-axis. Solid and dashed lines illustrate the snow coverage/content relation simulated in LUCID models and obtained from the NISDC dataset, respectively. (a) Normalized surface albedo changes (1α/1FH, see text) averaged over SWE bins of 15 mm around the values indicated in the x-axis. Results from simulations and reconstructions illustrated as solid and dashed lines, respectively. Shaded areas indicate the corresponding ±1 standard deviation of 1α/1FHcalculated within the moving window at each SWE level.
Table 3. Simulated and reconstructed annual mean LCC-induced change in surface albedo (× 100) averaged over the global ice-free land (excluding Greenland and Antarctica).
GCM/LSMs
ARPEGE/ CCAM/ CCSM/ ECEARTH/ ECHAM5/ IPSL/ SPEEDY/ Model mean
ISBA CABLE CLM TESSEL JSBACH ORCHIDEE LPJmL (range)
Simulated 0.64 0.10 0.22 0.97 0.28 0.49 0.85 0.51 (0.87)
Reconstructed 0.48 0.55 0.30 0.63 0.36 0.63 0.55 0.50 (0.33)
averages for bins of SWE of 15 mm, along with a range indicating departures from the mean of ±1 standard devi-ation, calculated within each bin (shaded area in Fig. 8b). The corresponding reconstructed 1Nαvalues are also
plot-ted as a reference in Fig. 8b (dashed lines). This figure shows how much the models differ in their DJF albedo re-sponse per unit of deforested area, although the magnitude of 1Nαincreases with SWE in all of them. ARPEGE/ISBA
and ECEARTH/TESSEL show the strongest albedo sensitiv-ity to deforestation when compared to all other models and to the reconstructed values. This is consistent with the compara-tively large winter albedo responses to LCC of these models, as can be appreciated in Fig. 7. This agreement holds in the case of ECEARTH/TESSEL despite the low snow coverage simulated by this model in the selected region (Fig. 8a). The 1Nα values simulated by the other five models
underesti-mate those reconstructed at different SWE levels. The weak albedo change simulated by CCAM/CABLE in winter (less than half of its associated reconstructed values; see Fig. 7b) is consistent with the extremely low albedo sensitivity of this model to LCC.
The uneven values of 1Nαshown in Fig. 8b reflect
differ-ences in land surface parameterization between the LUCID
LSMs. In order to attribute the net winter albedo sensitivity to LCC to (1) the simulated snow cover and (2) the “intrin-sic” albedo response to deforestation characterized by 1Nα,
for each GCM/LSM we have plotted the relative error of the simulated winter albedo response to LCC in the region of study against the winter mean SWE (Fig. 9a) and against 1Nα averaged at different SWE levels (Fig. 9b). We use
the relative error of the simulated albedo change (1αmod),
calculated with respect to that reconstructed (1αrec) (i.e.
(1αmod−1αrec)/1αmod), in order to avoid the differences
between the models due to their specific LCC strength. No clear relationship was found in the first case (Fig. 9a), im-plying that the simulated snow does not dominate the model albedo responses to LCC. In contrast, an approximately lin-ear relationship applin-ears in the second case (Fig. 9b).
The reconstructed mean 1Nαof near 0.3 (dashed line in
Fig. 9b) is consistent with the mean snow-covered albedo difference between forest and herbaceous vegetation found in this study (Table 2) and similar to the strength of the snow-masking effect reported earlier (e.g. Bonan, 2008). The two models that overestimate this value (ARPEGE/ISBA and ECEARTH/TESSEL) simulate a higher albedo response to LCC than that reconstructed, while the other models
un-Fig. 9. Differences (relative, %) between the winter mean (DJF) reconstructed and simulated albedo responses to LCC in the region of study (box in Fig. 5), plotted against the simulated mean snow water equivalent (SWE) (a), and plotted against the normalized albedo changes (1α/1FH)averaged at different SWE levels (b). Winter mean normalized 2-m temperature changes (1T2 m/1FH)versus the mean 1α/1FH (c). Dashed lines indicate the corresponding values obtained from the reference SWE dataset (NISDC) and the albedo reconstructions. Labels A, C1, C2, E1, E2, I and S indicate respectively ARPEGE, CCAM, CCSM, ECEARTH, ECHAM5, IPSL and SPEEDY.
derestimate it. Hence, the land surface parameterization ap-pears as the major factor explaining the differences be-tween winter mean albedo responses to LCC simulated by the LUCID models. The effect of the simulated snow content may be distinguished as a secondary source of inter-model dispersion in Fig. 9b. Based on the linear fit between 1Nα and the departures of the winter mean
albedo responses (dotted line), those models that simu-late more (ARPEGE/ISBA) and less (ECEARTH/TESSEL, ECHAM5/JSBACH, SPEEDY/LPJmL) snow than the reference data (NSIDC), respectively overestimate and underestimate their expected albedo responses based on their mean 1Nα.
Figure 9c shows the normalized 2 m temperature re-sponses to LCC (1T2 m/1FH)simulated in DJF as function
of the mean 1Nα. In the region of study (North America
and Eurasia) most models simulate a cooling in response to deforestation. The magnitude of this cooling is roughly pro-portional to the increase in surface albedo in each model and, then, proportional to the mean 1Nα. The models showing a
weak sensitivity of albedo to deforestation simulate a negli-gible cooling in response to LCC (e.g. CCAM/CABLE). The converse is true, e.g. for ECEARTH/TESSEL, with a mean 1Nαof ∼ 0.37 and a DJF cooling exceeding 3 K of
ampli-tude. The MODIS-based reconstructed mean 1Nαof ∼ 0.3
results in an estimated temperature response to deforestation of −2.5 K when projected on the linear fit between the simu-lated 1T2 m/1HHand 1Nα(dotted line in Fig. 9c).
4.3 Impacts on the surface shortwave radiation budget
The effects of large-scale changes in surface albedo on cli-mate occur through the resulting perturbation in the radiation budget and energy balance of the surface. The LCC-induced changes in surface net shortwave radiation (SN)not only
de-pend on the surface albedo changes (1α), but also on indirect impacts of LCC and atmospheric feedbacks that, by means
of perturbations in, e.g. convection and cloud cover, induce changes in the incoming solar radiation (SD). In order to
isolate the albedo-driven (α-driven) component in the LCC-induced change in SN, we use the following decomposition:
1SN=SN(PD) − SN(PI) = −1α SD(PI) + [1 − α(PI)] (3) 1SD−1α 1SD,
where the difference of a given variable 1V corresponds to the change between its preindustrial mean value V (PI) and the present-day one V(PD). Hence, the first term in the right-hand side of Eq. (3) represents the direct LCC-induced (α-driven) SNchange, while the second term is the indirect
com-ponent (SD-driven) briefly described above. The third term is
an anomaly of second order that is negligible compared to the other terms when the perturbations are small compared to the net values (as in this case).
For each of the LUCID models, Fig. 10 illustrates the monthly LCC-induced SNchanges, averaged over the region
studied. The simulated changes in SN (indicated by solid
lines) are depicted along with the simulated (dotted lines) and reconstructed (dashed blue lines) α-driven 1SN. The
lat-ter are computed as the first lat-term of Eq. (3) but evaluated with the corresponding MODIS-based reconstructed 1α value, maintaining in each case the corresponding (simulated) SD
(PI).
Most models simulate decreases in SN that exceed
5 W m−2 in some cases (solid lines in Fig. 10). They also show different seasonal patterns within their responses to LCC. In most cases, the models show different SNanomalies
than those expected from the corresponding surface albedo changes alone (dotted lines). ARPEGE/ISBA is a clear ex-ception. This model simulates small changes in SD, and 1SN
is therefore dominated by its α-driven component (Fig. 10a). Differences between the net 1SNand its α-driven component
are not systematic among the models but some patterns pre-vail. During the northern winter, most models simulate sim-ilar or weaker net 1SN (in amplitude) than those expected
Fig. 10. As in Fig. 7 but for net shortwave radiation (SN). Simulated total and albedo-driven (see text) changes in SNas solid and dotted lines, respectively. Dashed lines indicate the albedo-driven SNchanges obtained with the reconstructed (MODIS-based) changes in surface albedo.
Table 4. As is Table 3 but for surface net shortwave radiation (W m−2). GCM/LSMs
ARPEGE/ CCAM/ CCSM/ ECEARTH/ ECHAMS/ IPSL/ SPEEDY/ Model mean
ISBA CABLE CLM TESSEL JSBACH ORCHIDEE LPJmL (range)
Simulated −0.68 −1.53 −0.32 −1.10 −0.35 −0.52 −1.03 −0.89(1.21)
α−driven∗(sim.) −0.81 −0.04 −0.29 −1.41 −0.42 −0.79 −1.47 −0.75(1.44)
α−driven∗(rec.) −0.53 −0.53 −0.40 −0.80 −0.44 −1.01 −0.72 −0.63(0.62)
∗Simulated (sim.) and reconstructed (rec.) surface albedo-driven changes in net shortwave radiation (see text).
from 1α alone. The opposite effect, i.e. larger decreases in SNthan those induced by 1α, is observed in most models in
summer, with the clear exception of SPEEDY/LPJmL. The latter shows particularly large increases in SDleading to net
increases in SNin May–June between PI and PD. These
re-sults suggest that the indirect impacts of LCC by means of changes in SDplay quite an important role in the simulated SNresponse to LCC. Within the various LUCID models, this
effect differs in amplitude and, in some cases in sign, ampli-fying or dampening the direct (α-driven) SNperturbations.
With the exception of ECHAM5/JSBACH, the models show larger reductions in the α-driven changes in SD
dur-ing the winter and sprdur-ing than durdur-ing the summer (dot-ted lines in Fig. 10), as we get in the reconstructions (dashed lines). The seasonal pattern of the simulated and reconstructed α-driven 1SD is however quite different for
most models (except for IPSL/ORCHIDEE). For instance, in the case of ECEARTH/TESSEL, the difference between the simulated and reconstructed surface albedo change in summer (under snow-free conditions; Fig. 7) leads to a large overestimation in the amplitude of the α-driven
de-crease in SN with respect to the corresponding
MODIS-based reconstruction from May to October. A similar but weaker effect is observed in the case of ARPEGE/ISBA
and SPEEDY/LPJmL. In turn, the simulated α-driven SN
changes underestimate those reconstructed during most part of the year for CCSM/CLM, ECHAM5/JSBACH, IPSL/ORCHIDEE and CCAM/CABLE, in accordance to their differences between the reconstructed versus the sim-ulated albedo changes (Fig. 7).
The model mean and range of both the simulated and re-constructed LCC-induced SNchanges are plotted in Fig. 10h.
This figure is similar to the one showing albedo changes (Fig. 7). The model-mean changes in SN, which is of the
same order in the simulated and reconstructed cases. Further, it is remarkable that the inter-model range of simulated SN
responses to LCC (gray shaded area in Fig. 10h) is much larger than the range of reconstructed responses (blue shaded area). In this case, the large dispersion between GCM/LSMs in their SN changes is not only due to differences in their
imposed LCC (aspect that is quantified with the reconstruc-tions), nor in the model specific albedo sensitivities to LCC,
but also for the indirect effects and feedbacks of LCC driven by the atmosphere in climate models, producing changes in the incoming solar radiation (SD).
The annual mean LCC-induced changes in SN averaged
across the global ice-free land are summarized in Table 4. As for the results shown in Fig. 10, the simulated 1SN
val-ues are indicated along with the α-driven components com-puted from both the simulated and the reconstructed 1α. The model-mean 1SN is near −0.9 W m−2 with a large
inter-model range of 1.21 W m−2. The global land α-driven 1SNis
lower in amplitude than the total 1SNwhen averaged across
the models (−0.75 W m−2). The inter-model range of this component (1.44 W m−2)is twice as large as the correspond-ing model-mean response. Consistent with what is obtained for the surface albedo (Table 3), the inter-model range of the MODIS-based reconstructed α-driven 1SN is strongly
reduced from that simulated (0.62 W m−2), highlighting the
major role of the differences in land surface parameterization in explaining the simulated albedo responses to LCC and the resulting spread between the models.
Averaged over the whole globe, the LUCID models show an annual mean reduction in SN of 0.16 W m−2
be-tween PI and PD (total simulated). Considering the α-driven component only, the model-mean change in SN is −0.14 W m−2(simulated) and −0.12 W m−2when using the reconstructed albedo change. These values are coherent with what Matthews et al. (2003) reported.
The global mean 1SNfound in this study are also within
the typical radiative forcing (RF) of −0.2 ± 0.2 W m−2 at-tributed to the past LCC due to surface albedo changes in previous modeling studies (Davin et al., 2007; Forster et al., 2007) and higher in amplitude than the RF of −0.09 W m−2
that was estimated by Myhre et al. (2005) based on MODIS data. The change in SN is, however, a quite rough
estima-tion of the LCC-induced RF, which is usually computed at the top of the troposphere and, therefore, accounts for the net changes in shortwave radiation due to surface albedo per-turbations at a given cloud cover distribution, in addition to changes in longwave radiation as indirect impacts of LCC.
5 Discussion and conclusions
The results from the LUCID model intercomparison project have demonstrated that the change in surface albedo is one of the main drivers of the climate responses to historical land use-induced land cover change (LCC). This intercomparison has also showed that the simulated albedo change was quite different from one model to another. It then became impor-tant to evaluate the magnitude of this albedo response to his-torical LCC based on available observations.
In addition, we have to recall that there is no current consensus on the intensity of past deforestation and, conse-quently, this aspect represents one of the main sources of un-certainty when comparing various studies addressing the
im-pacts of LCC on climate (de Noblet-Ducoudr´e et al., 2012; Boisier et al., 2012).
We have used satellite-based surface albedo, land cover and snow cover data to derive snow-free and snow-covered monthly climatologies of albedo for five main land cover groups (LCGs). Those climatologies can be combined with any vegetation and snow cover distribution to reconstruct global albedo maps and then estimate LCC-induced albedo changes. We have used this methodology to assess changes in surface albedo since preindustrial times based on the land cover maps provided by the seven GCM/LSMs that have been evaluated in the context of the LUCID project. Prein-dustrial simulations and reconstructions only differ from present-day ones by the land cover maps. The reconstructions were then compared to the albedo values simulated by each individual GCM/LSM to evaluate how realistic each model is with respect to the response of this specific variable to LCC. It is important to note that the reconstructed preindustrial albedo maps were computed with the present-day snow cover data and LCG’s monthly albedos. Thus, the resulting surface albedo change between 1992 and 1870 represents an estimate prior to any climate feedback that could further modulate the albedo responses to LCC. However, our previous analyses of LUCID simulations show rather weak positive snow-albedo feedback (Boisier et al., 2012).
The LUCID models do not exhibit a systematic bias in their simulated albedo responses to LCC with respect to those reconstructed using the MODIS albedo and the NSIDC snow cover data. However, single model responses are sig-nificantly different from their respective reconstructions, no-tably when snow is present. We show that these differ-ences reside principally on the land surface parameteriza-tions and the resulting albedo sensitivities to deforestation of LSMs at different snow cover conditions, while the snow-pack simulated by the LUCID GCM/LSMs represents a fac-tor of secondary importance. It should be noted that the winter temperature responses to LCC simulated by the LU-CID models are mainly directed by surface albedo changes and, consequently, depend directly on the albedo sensitivity of LSMs (Fig. 9c).
This study does not explore deeper on the specific LSM parameterizations leading to these different albedo sensi-tivities to LCC. However, the large simulated-reconstructed albedo biases found in some models during the summer and over vegetated lands (i.e. under snow-free conditions and with the canopy foliage developed) suggest important incon-sistencies on basic parameters such as the leaf/stem albedo. We speculate that the way LSMs treat the vegetation phenol-ogy and the optical properties of the snow-covered surfaces should also contribute significantly to the seasonal albedo bi-ases.
The large dispersion in the albedo responses to LCC shown by LUCID models echoes the reported uncertainty in the radiative forcing of past LCC (Forster et al., 2007). As commented, our results show that the spread in the simulated
albedo changes is in its major part associated to the param-eterization of LSMs, reinforcing previous conclusions from LUCID (Boisier et al., 2012). The remaining model uncer-tainty is mainly related to the choice of land cover maps to characterize LCC. The indirect impacts of land cover pertur-bations, inducing changes in the incoming solar radiation, are also quite model-dependent, adding additional uncertainty to the radiative effect of LCC.
Narrowing the large uncertainties in climate responses to LCC is a major challenge to move forward in the understand-ing of past climate trends and future projections, and will help other studies such as the climate change detection and attribution. A deeper evaluation of LSMs is needed to ad-dress this purpose. In addition, analyses of observation-based global datasets such as the one developed in this study con-tribute substantially to the assessment of these uncertainties, providing realistic estimates of land use-related impacts as well as benchmarks for climate model simulations. Further, the methodology applied here may be used to estimate either past or future LCC-related changes in surface albedo, as well as in other surface properties or variables that are available globally at relatively high resolution.
Acknowledgements. We thank the climate modeling groups participating in LUCID for providing model data and support, as well as two anonymous reviewers for their constructive com-ments and suggestions. This research was partially funded by the Chilean National Commission for Scientific and Technological Research (CONICYT) and the EU-FP7 project AMAZALERT. The computing time was provided by the Commissariat `a l’Energie Atomique (CEA), France. The MODIS products MCD43C3 and MCD12Q1 were obtained through the online Data Pool at the NASA Land Processes Distributed Active Archive Center (LP DAAC), USGS/Earth Resources Observation and Science (EROS) Center, Sioux Falls, South Dakota (http://lpdaac.usgs.gov/get data). The AVHRR/SMMR/SSM/I snow cover and snow water equivalent product (NSIDC-0271) were obtained from the National Snow and Ice Data Center (NSIDC) Distributed Active Archive Center (DAAC).
Edited by: E. Falge
The publication of this article is financed by CNRS-INSU.
References
Abramowitz, G., Leuning, R., Clark, M., and Pitman, A.: Evaluating the performance of land surface models, J. Clim., 21, 5468–5481, 2008.
Armstrong, R. L., Brodzik, M. J., Knowles, K., and Savoie, M.: Global Monthly EASE-Grid Snow Water Equivalent Climatol-ogy. Boulder, Colorado USA: National Snow and Ice Data Cen-ter, Digital media, 2007.
Betts, R. A.: Biogeophysical impacts of land use on present-day climate: near-surface temperature and radiative forcing, Atmos. Sci. Lett., 2, 39–51, doi:10.1006/asle.2001.0023, 2001. Betts, R. A., Falloon, P. D., Klein Goldewijk, K., and Ramankutty,
N.: Biogeophysical Effects of Land Use on Climate: Model Simulations of Radiative Forcing and Large-Scale Temperature Change, Agr. Forest Meteorol., 142, 216–233, 2007.
Boisier, J. P., de Noblet-Ducoudr´e, N., Pitman, A. J., Cruz, F. T., Delire, C., van den Hurk, B. J. J. M., van der Molen, M. K., M¨uller, C., and Voldoire, A.: Attributing the impacts of land-cover changes in temperate regions on surface tempera-ture and heat fluxes to specific causes: Results from the first LUCID set of simulations, J. Geophys. Res., 117, D12116, doi:10.1029/2011JD017106, 2012.
Bonan, G. B.: Forests and climate change: Forcings, feedbacks, and the climate benefits of forests, Science, 320, 1444–1449, 2008. Bondeau, A., Smith, P. C., Zaehle, S., Schaphoff, S., Lucht, W.,
Cramer, W., Gerten, D., Lotze-Campen, H., M¨uller, C., Reich-stein, M., and Smith, B.: Modelling the role of agriculture for the 20th century global terrestrial carbon balance, Glob. Change Biol., 13, 679–706, 2007.
Bounoua, L., DeFries, R., Collatz, G. J., Sellers, P., and Khan, H.: Effects of land cover conversion on surface climate, Clim. Change, 52, 2964, doi:10.1023/A:1013051420309, 2002. Cescatti, A., Marcolla, B., Santhana Vannan, S. K., Pan, J. Y.,
Rom´an, M. O., Yang, X., Ciais, P., Cook, R. B., Law, B. E., Matteucci, G., Migliavacca, M., Moors, E., Richardson, A. D., Seufert, G., and Schaaf, C. B.: Intercomparison of MODIS albedo retrievals and in situ measurements across the global FLUXNET network, Remote Sens. Environ., 121, 323–334, doi:10.1016/j.rse.2012.02.019, 2012.
Collins, W. D., Bitz, C. M., Blackmon, M. L., Bonan, G. B., Bretherton, C. S., Carton, J. A., Chang, P., Doney, S. C., Hack, J. J., Henderson, T. B., Kiehl, J. T., Large, W. G., McKenna, D. S., Santer, B. D., and Smith, R. D.: The Community Climate System Model Version 3 (CCSM3), J. Climate, 19, 2122–2143, doi:10.1175/JCLI3761.1, 2006.
Davin, E. L. and de Noblet-Ducoudr´e, N.: Climatic Impact of Global-Scale Deforestation: Radiative versus Nonradiative Pro-cesses, J. Clim., 23, 97–112, 2010.
Davin, E. L., de Noblet-Ducoudr´e, N., and Friedlingstein, P.: Im-pact of land cover change on surface climate: Relevance of the radiative forcing concept, Geophys. Res. Lett., 34, L13702, doi:10.1029/2007GL029678, 2007.
De Noblet-Ducoudr´e, N., Boisier, J. P., Pitman, A., Bonan, G., Brovkin, V., Cruz, F., Delire, C., Gayler, V., van den Hurk, B., Lawrence, P., van der Molen, M., M¨uller, C., Reick, C., Strengers, B., and Voldoire, A.: Determining robust impacts of land use induced land-cover changes on surface climate over North America and Eurasia; Results from the first set of LU-CID experiments, J. Climate, 25, 3261–3281, doi:10.1175/JCLI-D-11-00338.1, 2012.
Feddema, J., Oleson, K., Bonan, G., Mearns, L., Washington, W., Meehl, G., and Nychka D.: A comparison of a GCM response to historical anthropogenic land cover change and model sensitivity
to uncertainty in present-day land cover representations, Clim. Dyn., 25, 581609, doi:10.1007/s00382-005-0038-z, 2005. Forster, P., Ramaswamy, V., Artaxo, P., Berntsen, T., Betts, R.,
Fa-hey, D. W., Haywood, J., Lean, J., Lowe, D. C., Myhre, G., Nganga, J., Prinn, R., Raga, G., Schulz, M., and Van Dorland, R.: Changes in Atmospheric Constituents and in Radiative Forc-ing, in: Climate Change 2007: The Physical Science Basis. Con-tribution of Working Group I to the Fourth Assessment Report of the Intergovernmental Panel on Climate Change, edited by: Solomon, S., Qin, D., Manning, M., Chen, Z., Marquis, M., Av-eryt, K. B., Tignor, M., and Miller, H. L., Cambridge University Press, Cambridge, United Kingdom and New York, NY, USA, 2007.
Friedl, M. A., Sulla-Menashe, D., Tan, B., Schneider, A., Ra-mankutty, N., Sibley, A., and Huang, X.: MODIS Collection 5 global land cover: Algorithm refinements and characterization of new datasets, Remote Sens. Environ., 114, 168–182, 2010. Gao, F., Schaaf, C. B., Strahler, A. H., Roesch, A., Lucht, W.,
and Dickinson, R.: MODIS bidirectional reflectance distribution function and albedo Climate Modeling Grid products and the variability of albedo for major global vegetation types, J. Geo-phys. Res., 110, D01104, doi:10.1029/2004JD005190, 2005. Govindasamy, B., Duffy, P. B., and Caldeira, K.: Land use changes
and Northern Hemisphere cooling, Geophys. Res. Lett., 28, 291294, doi:10.1029/2000GL006121, 2001.
Hansen, J. E., Sato, M., Lacis, A., Ruedy, R., Tegen, I., and Math-ews, E.: Climate forcings in the Industrial era, PNAS, 95, 12753– 12758, doi:10.1073/pnas.95.22.12753, 1998.
Hurtt, G. C., Frolking, S., Fearon, M. G., Moore, B., Shevli-akova, E., Malyshev, S., Pacala, S. W., and Houghton, R. A.: The underpinnings of land-use history: three centuries of global gridded land-use transitions, wood-harvest activity, and resulting secondary lands, Glob. Change. Biol., 12, 1208–1229, doi:10.1111/j.1365-2486.2006.01150.x, 2006.
Jin, Y., Schaaf, C. B., Gao, F., Li, X., Strahler, A. H., Zeng, X., and Dickinson, R. E.: How does snow impact the albedo of veg-etated land surfaces as analyzed with MODIS data?, Geophys. Res. Lett., 29, 1374, doi:10.1029/2001GL014132, 2002. Klein Goldewijk, K.: Estimating global land use change over the
past 300 years: The Hyde database, Global Biogeochem. Cy., 15, 417–433, 2001.
Krinner, G., Viovy, N., de Noblet-Ducoudr´e, N., Og´ee, J., Polcher, J., Friedlingstein, P., Ciais, P., Sitch, S., and Prentice, I. C.: A dynamic global vegetation model for studies of the cou-pled atmosphere-biosphere system, Glob. Biogeochem. Cy., 19, GB1015, doi:10.1029/2003GB002199, 2005.
Kvalev˚ag, M. M., Myhre, G., Bonan, G., and Levis, S.: Anthro-pogenic land cover changes in a GCM with surface albedo changes based on MODIS data, Int. J. Climatol., 30, 2105, 2105– 2117, 2010.
Liang, S., Fang, H., Chen, M., Shuey, C. J., Walthall, C., Daugh-try, C., Morisette, J., Schaaf, C., and Strahler, A.: Validating MODIS land surface reflectance and albedo products: Methods and preliminary results, Remote Sens. Environ., 83, 149–162, doi:10.1016/S0034-4257(02)00092-5, 2002.
Liu, J., Schaaf, C., Strahler, A., Jiao, Z., Shuai, Y., Zhang, Q., Ro-man, M., Augustine, J. A., and Dutton, E. G.: Validation of Mod-erate Resolution Imaging Spectroradiometer (MODIS) albedo retrieval algorithm: Dependence of albedo on solar zenith
an-gle, J. Geophys. Res., 114, D01106, doi:10.1029/2008JD009969, 2009.
Marti, O., Braconnot, P., Dufresne, J.-L., Bellier, J., Benshila, R., Bony, S., Brockmann, P., Cadule, P., Caubel, A., Codron, F., Noblet, N., Denvil, S., Fairhead, L., Fichefet, T., Foujols, M.-A., Friedlingstein, P., Goosse, H., Grandpeix, J.-Y., Guilyardi, E., Hourdin, F., Idelkadi, A., Kageyama, M., Krinner, G., L´evy, C., Madec, G., Mignot, J., Musat, I., Swingedouw, D., and Ta-landier, C.: Key features of the IPSL ocean atmosphere model and its sensitivity to atmospheric resolution, Clim. Dyn., 34, 1– 26, doi:10.1007/s00382-009-0640-6, 2009.
Matthews, H. D., Weaver, A. J., Eby, M., and Meissner, K. J.: Radia-tive forcing of climate by historical land cover change, Geophys. Res. Lett., 30, 271–274, doi:10.1029/2002GL016098, 2003. McGregor, J. L. and Dix, M. R.: An updated description of the
Conformal-Cubic Atmospheric Model, in High Resolution Sim-ulation of the Atmosphere and Ocean, edited by: Hamilton, K. and Ohfuchi, W., Springer, New York, 51–76, 2008.
Myhre, G. and Myhre, A.: Uncertainties in radiative forcing due to surface albedo changes caused by land-use changes, J. Climate, 16, 1511–1524, doi:10.1175/1520-0442-16.10.1511, 2003. Myhre, G., Kvalev˚ag, M. M., and Schaaf, C. B.: Radiative
forcing due to anthropogenic vegetation change based on MODIS surface albedo data, Geophys. Res. Lett., 32, L21410, doi:10.1029/2005GL024004, 2005.
Oleson, K. W. and Coauthors: Improvements to the Community Land Model and their impact on the hydrological cycle, J. Geo-phys. Res., 113, G01021, doi:10.1029/2007JG000563, 2008. Pitman, A. J., De Noblet-Ducoudr´e, N., Cruz, F. T., Davin, E. L.,
Bonan, G. B., Brovkin, V., Claussen, M., Delire, C., Ganzeveld, L., Gayler, V., Van den Hurk, B. J. J. M., Lawrence, P. J., Van der Molen, M. K., M¨uller, C., Reick, C. H., Seneviratne, S. I., Strengers, B. J., and Voldoire, A.: Uncertainties in cli-mate responses to past land cover change: First results from the LUCID intercomparison study, Geophys. Res. Lett., 36, 14, doi:10.1029/2009GL039076, 2009.
Raddatz, T., Reick, C. H., Knorr, W., Kattge, J., Roeckner, E., Schnur, R., Schnitzler, K. G., Wetzel, P., and Jungclaus, J.: Will the tropical land biosphere dominate the climate-carbon cycle feedback during the twenty-first century?, Clim. Dyn., 29, 565– 574, 2007.
Ramankutty, N. and Foley, J. A.: Estimating historical changes in global land cover: Croplands from 1700 to 1992, Glob. Bio-geochem. Cy., 13, 997–1027, 1999.
Rechid, D., Raddatz, T. J., and Jacob, D.: Parameterization of snow-free land surface albedo as a function of vegetation phenology based on MODIS data and applied in climate modelling, Theor. Appl. Climatol., 95, 245–255, doi:10.1007/s00704-008-0003-y, 2008.
Roeckner, E., Brokopf, R., Esch, M., Giorgetta, M., Hagemann, S., Kornblueh, L., Manzini, E., Schlese, U., and Schulzweida, U.: Sensitivity of simulated climate to horizontal and vertical reso-lution in the ECHAM5 atmosphere model, J. Clim., 19, 3771– 3791, 2006.
Salas-M´elia, D., Chauvin, F., D´equ´e, M., Douville, H., Gu´er´emy, J. F., Marquet, P., Planton, S., Royer, J. F., and Tyteca, S.: De-scription and validation of the CNRM-CM3 global coupled cli-mate model, Note 103, Cent. du Groupe de M´et´eorol. de Grande Echelle et Clim., Toulouse, France, available at: http://www.
cnrm.meteo.fr/scenario2004/paper cm3.pdf, 2005.
Schaaf, C. B., Gao, F., Strahler, A. H., Lucht, W., Li, X., Tsang, T., Strugnell, N. C., Zhang, X., Jin, Y., Muller, J.-P., Lewis, P., Barnsley, M., Hobson, P., Disney, M., Roberts, G., Dunderdale, M., Doll, C., d’ Entremont, R. P., Hu, B., Liang, S., Privette, J. L., and Roy, D.: First operational BRDF, albedo nadir reflectance products from MODIS, Remote Sens. Environ., 83, 135–148, 2002.
Schaaf, C. B., Wang, Z., and Strahler, A. H.: Commentary on Wang and Zender-MODIS snow albedo bias at high solar zenith angles relative to theory and to in situ observations in Greenland, Re-mote Sens. Environ., 115, 1296–1300, 2011.
Strengers, B. J., Muller, C., Schaeffer, M., Haarsma, R. J., Severi-jns, C., Gerten, D., Schaphoff, S., van den Houdt, R., and Oosten-rijk, R.: Assessing 20th century climate-vegetation feedbacks of land-use change and natural vegetation dynamics in a fully cou-pled vegetation-climate model, Int. J. Climatol., 30, 2055–2065, doi:10.1002/joc.2132, 2010.
Van den Hurk, B. J. J. M., Viterbo, P., Beljaars, A. C. M., and Betts, A. K.: Offline validation of the ERA40 surface scheme, Tech. Memo., 295, Eur. Cent. for Med.-Range Weather Fore-casts, Reading, UK, 2000.
Voldoire, A.: Quantifying the impact of future land-use changes against increases in GHG concentrations, Geophys. Res. Lett., 33, L04701, doi:10.1029/2005GL024354, 2006.
Wang, X. and Zender, C. S.: MODIS snow albedo bias at high so-lar zenith angles relative to theory and to in situ observations in Greenland, Remote Sens. Environ., 114, 563–575, 2010.