EUROPEAN ORGANISATION FOR NUCLEAR RESEARCH (CERN)
Phys. Rev. D 99, 052009 (2019) DOI:10.1103/PhysRevD.99.052009
CERN-EP-2018-174 November 13, 2019
Search for four-top-quark production in the
single-lepton and opposite-sign dilepton final states
in p p collisions at
√
s
= 13 TeV with the ATLAS
detector
The ATLAS Collaboration
A search for four-top-quark production, t ¯tt ¯t, is presented. It is based on proton–proton collision data with a center-of-mass energy
√
s = 13 TeV collected by the ATLAS detector at the Large Hadron Collider during the years 2015 and 2016, corresponding to an integrated luminosity of 36.1 fb−1. Data are analyzed in both the single-lepton and opposite-sign dilepton channels, characterized by the presence of one or two isolated electrons or muons with high-transverse momentum and multiple jets. A data-driven method is used to estimate the dominant background from top-quark pair production in association with jets. No significant excess above the Standard Model expectation is observed. The result is combined with the previous same-sign dilepton and multilepton searches carried out by the ATLAS Collaboration and an observed (expected) upper limit of 5.3 (2.1) times the four-top-quark Standard Model cross section is obtained at 95% confidence level. Additionally, an upper limit on the anomalous four-top-quark production cross section is set in the context of an effective field theory model.
1 Introduction
With a mass close to the scale of electroweak symmetry breaking, the top quark, besides having a large coupling to the Standard Model (SM) Higgs boson [1,2], is predicted to have large couplings to new particles hypothesized in many models beyond the Standard Model (BSM) [3–5]. Possible new phenomena may enhance the cross sections over SM predictions for various processes involving top quarks, and in particular for the production of four top quarks [6–15]. This paper focuses on a search for four-top-quark (t ¯tt ¯t) production via the SM processes in proton–proton (pp) collisions at the Large Hadron Collider (LHC) and the results are interpreted in the context of an effective field theory (EFT) approach where the BSM contribution is represented via a four-top-quarks contact interaction [10].
The SM four-top-quark production cross section (σSMt ¯tt ¯t) in pp collisions at a center-of-mass energy √
s = 13 TeV is predicted to be σSMt ¯tt ¯t = 9.2 fb at next-to-leading-order (NLO) accuracy in QCD, with scale and parton distribution function (PDF) uncertainties of the order of 30% and 6%, respectively [16,17]. Previous searches for four-top-quark production using LHC Run 2 data at
√
s= 13 TeV were performed by both the ATLAS [18–20] and CMS [21–24] Collaborations. Among them, the most sensitive one is a CMS search [24] obtaining an observed (expected) 95% confidence level (C.L.) upper limit of 4.5 (2.3) times the SM expectation. Searches for anomalous t ¯tt ¯t production via an EFT model were recently performed by the ATLAS Collaboration [19,20], which set an observed (expected) upper limit of 16 fb (31 fb) on the production cross section at 95% C.L.
The four-top-quark production events can give rise to different final states depending on the hadronic or semileptonic decay mode of each of the top quarks. The four-top-quark decay topology considered in this search corresponds to either single-lepton events with one isolated charged lepton (electron or muon)1 or dilepton events with two opposite-sign charged leptons (electrons or muons). The event topology also features high jet multiplicity and high multiplicity of jets containing b-hadrons. Signal events are characterized by high scalar sum of the jet transverse momenta (HThad), which provides good discrimination against the dominant background, i.e. top-quark pair production in association with jets (t ¯t+jets). Given that the four-top-quark production events are expected to contain hadronically decaying top-quark candidates with collimated or partially collimated topologies, the analysis makes use of “mass-tagged reclustered large-R (RCLR) jets” [25,49], which will be described in Section3.
Selected events in each of the two channels are classified into several categories according to the number of jets, b-tagged jets and mass-tagged RCLR jets. A data-driven method is developed to estimate the dominant t ¯t+jets background. The Monte Carlo (MC) simulation is used in order to estimate correction factors and evaluate the systematic uncertainties of the data-driven estimate.
The paper is organized as follows: the ATLAS detector is described in Section2. Section3summarizes the selection criteria applied to events and reconstructed objects. The simulation-based signal and background modeling, together with the data-driven estimation of non-prompt and fake lepton backgrounds are discussed in Section4. Section5is devoted to the search strategy and classification of event topologies, while the t ¯t+jets background estimation technique using data is described in Section6. The systematic uncertainties are summarized in Section7. Section8presents the results and the combination with the same-sign dilepton and multilepton final-states search [20] carried out by ATLAS.
1The τ-leptons are not reconstructed; however, isolated electron and muon by-products of the leptonically decaying τ-leptons are
2 ATLAS detector
The ATLAS detector [26] at the LHC is a multipurpose particle detector with a forward–backward symmetric cylindrical geometry and nearly 4π coverage in solid angle.2 It consists of an inner tracking detector (ID), electromagnetic and hadronic calorimeters, and a muon spectrometer. The inner detector, including the insertable B-layer [27,28], provides charged-particle tracking from silicon pixel and microstrip detectors in the pseudorapidity region |η| < 2.5, surrounded by a transition radiation tracker that enhances electron identification in the region |η| < 2.0. The ID is surrounded by a thin superconducting solenoid providing an axial 2 T magnetic field, and by a fine-granularity lead/liquid-argon electromagnetic calorimeter covering |η| < 3.2, which provides energy measurements of electromagnetic showers. Hadron calorimetry is also based on the sampling technique and covers |η| < 4.9, with either scintillator tiles or liquid argon as the active medium and with steel, copper or tungsten as the absorber material. An extensive muon spectrometer with an air-core toroid magnet system surrounds the calorimeters. It includes three layers of high-precision tracking chambers, which provide coverage in the range |η| < 2.7. The field integral of the toroid magnets ranges from 2.0 to 6.0 Tm across most of the detector. A two-level trigger system [29], the first level using custom hardware and followed by a software-based level, is used to reduce the event rate to a maximum of around one kHz for offline storage.
3 Object and event selection
Events are selected from pp collisions with √
s = 13 TeV recorded by the ATLAS detector in 2015 and 2016. Only events for which all relevant subsystems were operational are considered. The data set corresponds to an integrated luminosity of 36.1 ± 0.8 fb−1[31]. The event reconstruction is affected by multiple inelastic pp collisions in a single bunch crossing and by collisions in neighboring bunch crossings, referred to as “pileup”. The number of interactions per bunch crossing in this data set ranges from about 8 to 45 interactions. Events are required to have at least one reconstructed vertex with two or more associated tracks with transverse momentum pT > 0.4 GeV. If multiple vertices are reconstructed, the vertex with
the largest sum of the squares of the transverse momenta of associated tracks is taken as the primary vertex [30].
Events in both the single-lepton and dilepton channels were recorded using single-lepton triggers. Events were selected using triggers with either low pT thresholds and a lepton-isolation requirement, or with
higher thresholds but with a looser identification criterion and without any isolation requirement. The lowest pTthreshold used for muons is 20 (26) GeV in 2015 (2016), while the higher pTthreshold is 50 GeV
in both years. For electrons, triggers with a pT threshold of 24 (26) GeV in 2015 (2016) and isolation
requirements are used along with triggers with a 60 GeV threshold and no isolation requirement, and with a 120 (140) GeV threshold with looser identification criteria.
Electron candidates are reconstructed [32, 33] from an isolated electromagnetic calorimeter energy deposit, matched to a track in the ID, within the fiducial region of |ηcluster| < 2.47, where ηclusteris the
pseudorapidity of the calorimeter energy deposit associated with the electron candidate. Candidates within
2ATLAS uses a right-handed coordinate system with its origin at the nominal interaction point (IP) in the center of the detector.
The positive x-axis is defined by the direction from the IP to the center of the LHC ring, with the positive y-axis pointing upwards, while the beam direction defines the z-axis. Cylindrical coordinates (r, φ) are used in the transverse plane, φ being the azimuthal angle around the z-axis. The pseudorapidity η is defined in terms of the polar angle θ by η = − ln tan(θ/2). Unless stated otherwise, the angular distance is defined as ∆R ≡
p
the transition region between the barrel and endcap electromagnetic calorimeters, 1.37 < |ηcluster| < 1.52,
are excluded. The electron candidates are required to have pT > 30 GeV and to satisfy “tight”
likelihood-based identification criteria [33] based on calorimeter, tracking and combined variables that provide good separation between electrons and jets. Muon candidates are reconstructed [34] by combining tracks reconstructed in both the ID and the muon spectrometer. Candidates are required to pass the “medium” identification criteria [34] and to have pT > 30 GeV and |η| < 2.5. To reduce the contribution from
non-prompt leptons (e.g. from semileptonic b- or c-hadron decays), photon conversions and hadrons, lepton candidates are also required to be isolated. The lepton isolation is estimated using the scalar sum of all tracks excluding the lepton candidate itself (IR = Í ptrk
T ) within a cone defined by ∆R < Rcutalong
the direction of the lepton. The value of Rcutis the smaller of rminand 10 GeV/p`T, where rminis set to
0.2 (0.3) for electron (muon) candidates, and p`Tis the lepton pT. All lepton candidates are required to
satisfy IR/p`
T < 0.06. Finally, lepton tracks must match the primary vertex of the event: the longitudinal
impact parameter z0is required to satisfy |z0sin θ | < 0.5 mm, where θ is the polar angle of the track. The
transverse impact parameter significance |d0|/σ(d0) must be less than 5 for electrons and 3 for muons,
where d0is the transverse impact parameter and σ(d0) is its uncertainty.
Jet candidates are reconstructed from three-dimensional topological energy clusters [35] in the calorimeter using the anti-kt jet algorithm [36–38] with a radius parameter of 0.4, and these are referred to as “small-R jets”. Each topological cluster is calibrated to the electromagnetic energy scale prior to jet reconstruction [39]. The reconstructed jets are then calibrated to the particle level by the application of a jet energy scale derived from simulation [40]. After energy calibration, jets are required to satisfy the pT> 25 GeV and |η| < 2.5 selection. Quality criteria are imposed to identify jets arising from non-collision sources or detector noise and any event containing such a jet is removed [41]. Finally, to reduce the effect of pileup, an additional requirement is made on the jet vertex tagger (JVT) discriminant [42] for jets with pT< 60 GeV and |η| < 2.4.
Jets are tagged as containing a b-hadron via a multivariate b-tagging algorithm [43,44]. For each jet, a value for the multivariate b-tagging discriminant is calculated, and the jet is considered b-tagged if this value is above a given threshold. The threshold used in this search corresponds to an average 77% efficiency to tag a jet containing a b-hadron, with a light-jet rejection factor of ∼134 and a charm-jet rejection factor of ∼6, as determined for jets with pT > 20 GeV and |η| < 2.5 in simulated t¯t events [45–47].
To avoid assigning a single detector response to more than one reconstructed object, a sequential overlap-removal procedure is adopted. Electron candidates that lie within ∆R = 0.01 of a muon candidate are removed to suppress contributions from bremsstrahlung. To prevent double-counting of electron energy deposits as jets, the closest jet within ∆Ry =
p
(∆y)2+ (∆φ)2 = 0.2 of a selected electron is removed.3
If the nearest jet surviving that selection is within ∆Ry = 0.4 of an electron, the electron is discarded.
The overlap removal procedure between the remaining jet candidates and muon candidates is designed to remove those muons that are likely to have arisen in the decay chain of hadrons and to retain the overlapping jet instead. Jets and muons may also appear in close proximity. For example, a muon with high-pT
bremsstrahlung radiation inside the calorimeter may be reconstructed as a jet. In such cases, the jet should be removed and the muon retained. Such jets are characterized by having very few matching inner-detector tracks. Selected muons that satisfy ∆R(µ, jet) < 0.04 + 10 GeV/pµTare rejected if the jet has at least three tracks originating from the primary vertex; otherwise the jet is removed and the muon is kept.
3The rapidity is defined as y = 1 2ln
E+pz
E−pz, where E is the energy and pzis the longitudinal component of the momentum along
The selected and calibrated small-R jets with pT > 25 GeV and passing both the requirement on the JVT
and the overlap removal with leptons are used as inputs for further jet reclustering [25] using the anti-kt
algorithm with a radius parameter of R = 1.0. These reclustered large-R jets are referred to as RCLR jets. The calibration corrections and uncertainties in the RCLR jets are automatically inherited from the small-R jets [49]. In order to further suppress contributions from pileup and other soft radiation, the RCLR jets are trimmed [48] by removing all small-R jets within a reclustered jet that have pTbelow 5% of the pTof the
reclustered jet. Due to the pileup suppression and pT > 25 GeV requirements made on the small-R jets,
the probability for a small-R jet to be removed from the corresponding reclustered jet by the trimming requirement is less than 1%. The resulting RCLR jets are used to identify hadronically decaying top-quark candidates. RCLR jets that have pT > 200 GeV, |η| < 2.0, mass4larger than 100 GeV and at least one
constituent small-R jet are referred to as “mass-tagged RCLR jets”.
The missing transverse momentum in the event, whose magnitude will be denoted in the following by ETmiss, is defined as the negative vector sum of the pTof reconstructed and calibrated objects in the event, where
only primary objects enter the sum (e.g., RCLR jets are not used). This sum includes a term to account for energy from low-momentum particles in the event that are not associated with any of the selected objects, which is calculated from inner detector tracks matched to the reconstructed primary vertex in the event [50].
Events of interest are required to have at least one reconstructed lepton that matches, within ∆R < 0.15, the lepton with the same flavor reconstructed by the trigger algorithm. Events in the opposite-sign dilepton channel are retained if they contain exactly two opposite-sign charged leptons (electrons or muons) and at least four jets satisfying the quality and kinematic criteria discussed above, of which at least two must be b-tagged. In both the ee and µµ channels, the dilepton invariant mass (m``) must be above 50 GeV and outside the Z mass window 83–99 GeV. Events not in the opposite-sign dilepton channel may enter the single-lepton channel if they contain exactly one lepton and at least five jets, of which at least two are b-tagged. The above selection criteria imply that events containing two leptons with the same charge, or three or more leptons of any charge are excluded from the selection. This is done in order to maintain orthogonality with the complementary search with same-sign dilepton and multilepton final states [20] carried out by ATLAS, as these results are combined with the results presented here (Section8). Additional requirements are made to suppress the background from multijet production in the single-lepton channel. Requirements are made on ETmiss as well as on the transverse mass of the combined lepton and ETmiss system5(mWT ): ETmiss> 20 GeV and ETmiss+ mWT > 60 GeV.
The above requirements are referred to as “preselection” and are summarized in Table1. Events satisfying either the single-electron or single-muon selections are combined and treated as a “single-lepton” analysis channel, and events satisfying any of the opposite-sign lepton selections (ee, µµ or e µ) are combined and treated as a “dilepton” analysis channel.
4 Signal and background modeling
After the event preselection, the main background processes arise from the SM production of t ¯t+jets and single top-quarks, as well as W - or Z -boson production in association with jets. Small contributions arise
4The reclustered jet mass is computed from the sum of the four-momenta of the associated small-R jets [49].
5mW
T =
q
2p`TETmiss(1 − cos ∆φ), where p`Tis the transverse momentum of the lepton and ∆φ is the azimuthal angle separation between the lepton and the direction of the missing transverse momentum.
Table 1: Summary of preselection requirements for the single-lepton and dilepton channels. Here mWT is the transverse mass of the lepton and the ETmissvector, and m``denotes the dilepton invariant mass in the ee and µµ channels.
Preselection requirements
Requirement Single-lepton Dilepton
Trigger Single-lepton triggers
Leptons 1 isolated 2 isolated, opposite-sign
Jets ≥5 jets ≥4 jets
b-tagged jets ≥2 b-tagged jets
Other ETmiss > 20 GeV m`` > 50 GeV
Emiss
T + m
W
T > 60 GeV |m``− 91 GeV| > 8 GeV
from the associated production of a vector boson V (V = W, Z ) or a Higgs boson and a t ¯t pair (t ¯t + V and t ¯t+ H) and from diboson (WW, W Z, Z Z) production. Multijet events contribute to the selected sample via the misidentification of hadronic objects (jets, hadrons) as leptons or the presence of a non-prompt electron or muon. These events are referred to as the “fake and non-prompt lepton” background in the remainder of this paper.
MC simulation samples are used to model the expected distributions of the signal and most of the background processes. The fake and non-prompt lepton background in the single-lepton channel is estimated with a fully data-driven method. The t ¯t+jets background, which is dominant in regions with very high jet and b-jet multiplicities, is estimated via a dedicated data-driven method, with some correction factors taken from the MC simulation, as described in Section6. The MC samples were processed either through the full ATLAS detector simulation [51] based on Geant4 [52], or through a faster simulation making use of parameterized showers in the calorimeters [53]. To model the effects of pileup, events from minimum-bias interactions were generated using the Pythia 8.186 [54] event generator and overlaid on the simulated hard-scatter events according to the luminosity profile of the recorded data. All simulated samples were processed through the same reconstruction algorithms and analysis chain as the data. In the simulation, the top-quark mass was assumed to be mtop = 172.5 GeV. The heavy-flavor decays were modeled using the
EvtGen 1.2.0 [55] program, except for processes modeled using the Sherpa generator [56].
4.1 Signal modeling
Simulated events for the main signal process, i.e. the four-top-quark production with SM kinematics, were generated at leading order (LO) with the MadGraph5_aMC@NLO 2.2.2 [17] generator and the NNPDF2.3 LO PDF set [57], interfaced to Pythia 8.186 using the A14 set of tuned parameters [58], which will be denoted in the following by A14 tune. The SM t ¯tt ¯t sample is normalized to a cross section of 9.2 fb, computed at NLO in QCD [17].
This search also probes a BSM model with kinematic characteristics similar to those of the SM t ¯tt ¯t events: the t ¯tt ¯t production via an effective field theory involving a four-fermion contact interaction [10]. The EFT t ¯tt ¯t sample was generated at LO with the MadGraph5_aMC@NLO 2.2.2 generator and the NNPDF2.3 LO PDF set, interfaced to Pythia 8.186 with the A14 tune. It is normalized assuming |C4t|/Λ2= 4π TeV−2,
section of 926.3 fb computed using MadGraph5_aMC@NLO. Details of this BSM scenario can be found in Refs. [19,20].
4.2 Background modeling
The dominant t ¯t+jets background estimation relies on the data-driven technique described in Section6. The validation of this technique and the extraction of the corresponding correction factors were performed with simulated MC t ¯t+jets events, generated with Powheg-Box v2 [59–62], which provides NLO accuracy in QCD for the t ¯t process and uses the CT10 PDF set [63]. Showering was performed using Pythia 6.428 [64] with the CTEQ6L PDF set [65] and the PERUGIA2012 tune [66]. The hard-process factorization scale µF
and renormalization scale µRwere set to the default Powheg value: µ =
q m2
top+ p2T,top, where pT,topis
the transverse momentum of the top quark in the t ¯t center-of-mass reference frame. The Powheg model resummation damping parameter, hdamp, which controls the matching of matrix elements to parton showers
and regulates the high-pTparton radiation, was set to mtop[67]. The sample is normalized to the theoretical
cross-section value for the inclusive t ¯t process of 832+40−46 pb obtained with Top++ [68], calculated at next-to-next-to-leading order (NNLO) in QCD, and including resummation of next-to-next-to-leading logarithmic soft gluon terms [69–73].
Samples of W /Z +jets events were generated with the Sherpa 2.2 [56] generator. The matrix element calculation was performed with up to two partons at NLO in QCD and up to four partons at LO using matrix elements from Comix [74] and OpenLoops [75]. The matrix element calculation was merged with the Sherpa [76] parton shower (PS) using the ME+PS@NLO prescription [77]. The PDF set used for the matrix element calculation is NNPDF3.0nnlo with a dedicated PS tuning developed by the Sherpa authors. The W +jets and Z +jets samples are normalized to their inclusive production cross section estimates at NNLO in QCD, calculated with FEWZ [78,79].
Samples of single-top-quark backgrounds, corresponding to the W t and s-channel production mechanisms, were generated with Powheg-Box v1 [80] at NLO accuracy using the CT10 PDF set. Overlaps between the t ¯t and W t final states were removed using the “diagram removal” scheme [81]. Samples of t-channel single-top-quark events were generated using the Powheg-Box v1 [82,83] NLO generator that uses the four-flavor scheme. The fixed four-flavor PDF set CT10f4 [63] was used for the matrix element calculations. Showering was performed using Pythia 6.428 with the PERUGIA2012 tune. The single-top-quark samples are normalized to the approximate NNLO cross sections [84–86].
Diboson processes with one of the bosons decaying hadronically and the other leptonically were simulated using the Sherpa 2.1.1 generator. They were calculated for up to one (Z Z ) or zero (WW , W Z ) additional partons at NLO, and up to three additional partons at LO, using the same procedure as for W /Z +jets. The CT10 PDF set was used together with a dedicated PS tuning of the Sherpa fragmentation model. All diboson samples are normalized to their NLO cross sections provided by Sherpa.
Samples of t ¯t + V (with V = W or Z , including non-resonant Z /γ∗contributions) were generated with MadGraph5_aMC@NLO 2.3.2, using NLO in QCD matrix elements and the NNPDF3.0NLO [87] PDF set. Showering was performed using Pythia 8.210 and the A14 tune. The t ¯t + V events are normalized to their NLO cross section [17]. A sample of t ¯t + H events was generated using MadGraph5_aMC@NLO 2.3.2 generator and the NNPDF3.0NLO PDF set. Showering was performed using Pythia 8.210 and the A14 tune. Inclusive decays of the Higgs boson are assumed in the generation of the t ¯t+ H sample, which is normalized to the corresponding cross section calculated at NLO [88,89]. Rare backgrounds, such as t ¯t + WW and
triple-top-quark production (t ¯t + t, t ¯t + tW ), were generated at LO with MadGraph5_aMC@NLO 2.2.2 with no additional partons and interfaced with Pythia 8.186. They are normalized using cross sections computed at NLO in QCD [17,90].
4.3 Estimation of non-prompt and fake lepton backgrounds
In the single-lepton channel, the background from events with a fake or non-prompt lepton is estimated from data using a “matrix method” technique [91,92]. Events are selected using looser isolation or identification requirements for the lepton and are then weighted according to the efficiencies for both prompt and background (fake and non-prompt) leptons to pass the tighter default selection. These efficiencies are measured in data using dedicated control regions. The contribution from events with a fake or non-prompt lepton is found to be consistent with zero in regions defined by the presence of two or more mass-tagged RCLR jets, as well as in the regions requiring the presence of at least one mass-tagged RCLR jet and at least four b-tagged jets. The contribution is at most 6% in the rest of the signal regions (described in Section5).
In the dilepton channel, the majority (90%) of events containing one prompt lepton and one background lepton, arising from either a heavy-flavor hadron decay, photon conversion, jet misidentification or light-meson decay, originate from the single-lepton t ¯t+jets background. This contribution is included in the estimation via the data-driven technique described in Section6, while the small fraction of fake and non-prompt leptons events arising from W +jets and t ¯t + V events is estimated from MC simulation.6 The total contribution is found to be less than 8% of the total background in the signal regions.
5 Search strategy
Signal events from SM four-top-quark production in the single lepton (opposite-sign dilepton) decay channel are characterized by the presence of one charged lepton (two opposite-sign charged leptons), missing transverse momentum from the escaping neutrino(s) and a high number of high-pTjets. At LO
the single-lepton (opposite-sign dilepton) decay will potentially have an event topology with ten (eight) jets, when each parton from a top-quark decay gives rise to a separate jet: six (four) jets are light-jets and four are b-quark jets. However, the topology of a reconstructed event could differ due to the limited detector acceptance, the b-tagging efficiency, and the possible presence of jets arising either from additional radiation and multiple parton interactions (MPI) or from collimated partons not resolved as separate objects. Events are classified in several regions to optimize the sensitivity of the search, to perform a data-driven estimate of the t ¯t+jets background (described in Section6) and to validate the background prediction. Preselected events in each of the two channels are classified according to their event topology, defined by the number of jets with pT > 25 GeV and the number of b-jets. Several regions are split according to the
mass-tagged RCLR jet multiplicity in addition to the jet and b-tagged jet multiplicities. In the following, a region with m jets (j), of which n are b-tagged jets (b) and from which p separate mass-tagged RCLR jets (J) are reconstructed is referred to as “mj, nb, pJ”. When no mass-tagged RCLR jet multiplicity is specified, no selection on these objects is performed.
6No data-driven estimation was attempted due to the statistical overlap with the same-sign dilepton and multilepton final-states
The following regions are defined to be orthogonal using the classification described above: 20 “signal regions,” 16 “validation regions,” 18 “source regions” and 2 “efficiency extraction regions,” as shown in Figure1. signal validation effi ci en cy ex tr ac ti on source source jets b-tags 5j 6j 7j 8j 9j ≥10j 2b 3b ≥4b 0J 1J ≥2J mass-tagged RCLR jets signal validation source source signal validation source source Single Lepton (a) effi ci en cy ex tr ac ti on jets b-tags 4j 5j 6j 7j ≥8j 2b 3b ≥4b 0J ≥1J mass-tagged RCLR jets signal va lid at io n sour. source Dilepton (b)
Figure 1: Schematic view of the different analysis regions in (a) the single-lepton and (b) the dilepton channels. The three axes represent the jet multiplicity, the b-tagged jet multiplicity and the mass-tagged RCLR jet multiplicity. The efficiency extraction region in each channel is defined inclusively in the mass-tagged RCLR jet multiplicity. Twelve regions in the single-lepton channel and eight regions in the dilepton channel with the largest signal-to-background ratios (up to 5.7% in the single-lepton channel and 7.0% in the dilepton channel), assuming SM t ¯tt ¯t production cross section and kinematics, are referred to as signal regions. These regions are included in the simultaneous fit to extract the signal cross section and have high jet multiplicities (≥9j and ≥7j for single-lepton and dilepton respectively) and high b-tagged jet multiplicities (≥3b). Since events from the main t ¯t+jets background are characterized by at most one hadronically decaying top quark in the single-lepton channel and no hadronically decaying top quarks in the dilepton channel, the signal regions are split into 0, 1 and ≥2J in the single-lepton case, and into 0 and ≥1J in the dilepton case.
Twelve validation regions in the single-lepton channel and four validation regions in the dilepton channel are defined. These regions do not overlap with the signal region selections and feature low expected signal-to-background ratios (less than 1%). They are not included in the fit nor used to extract information from the data. These regions are designed primarily to validate the data-driven estimate of the t ¯t+jets background (introduced in Section 6) and to confirm the validity of the assumption that the t ¯t+jets data-driven estimate can be extrapolated to the signal regions. The validation regions in the single-lepton channel contain exactly seven or exactly eight jets of which three or at least four are b-tagged. In the dilepton channel, the validation regions have exactly six jets of which three or at least four are b-tagged. In each of the two channels these validation regions are split according to the mass-tagged RCLR jet multiplicity in the same way as the corresponding signal regions.
With the goal of estimating the t ¯t+jets background in the signal regions, data events with lower jet and/or b-jet multiplicities are used in the data-driven method described in Section6. The 18 source regions are built using events with high jet multiplicity: 7, 8, 9, ≥10 for the single-lepton channel and 6, 7, ≥8 for the dilepton channel, out of which exactly 2 jets are b-tagged. They are used to build pseudo-data event samples in the signal and validation regions with same jet multiplicities but higher number of b-tagged jets. Efficiency extraction regions are characterized by lower jet multiplicities: five or six jets for the single-lepton channel and four or five for the dilepton channel, out of which 2, 3 or ≥4 are b-tagged. They
are used to extract the b-tagging probabilities, since they provide a sample depleted of signal and dominated by t ¯t+jets. Neither the efficiency extraction regions nor the source regions are included in the final fit to data.
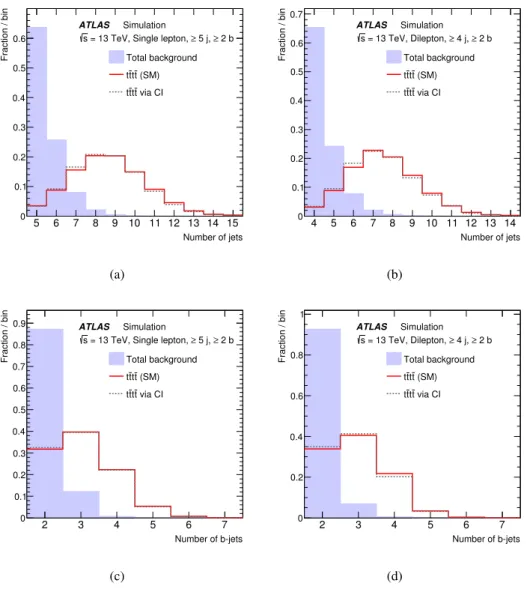
Figure2shows the expected shapes of the jet and b-jet multiplicity distributions after preselection in the single-lepton and dilepton channels. The distributions shown are for the total predicted background, with the t ¯t+jets background estimated via MC simulation, and for the considered four-top-quark signal scenarios. Figures3(a) and3(b) show the same distributions but for the mass-tagged RCLR jet multiplicity.
Figures3(c) and 3(d) compare the expected shapes of the scalar sum of the jet transverse momenta, considering all selected jets (HThad), between the different four-top-quark signal scenarios and the total predicted background. Given the different kinematic features, the HThad distribution provides a suitable discrimination between events from the signal hypotheses and the background, and is used as the main discriminating variable in each of the regions. The signal-to-background discrimination is therefore provided by the combination of the event categorization and the HThaddistribution in each category.
5 6 7 8 9 10 11 12 13 14 15 Number of jets 0 0.1 0.2 0.3 0.4 0.5 0.6
Fraction / bin Total background (SM) t t t t via CI t t t t ATLAS Simulation 2 b ≥ 5 j, ≥ = 13 TeV, Single lepton, s (a) 4 5 6 7 8 9 10 11 12 13 14 Number of jets 0 0.1 0.2 0.3 0.4 0.5 0.6 0.7
Fraction / bin Total background (SM) t t t t via CI t t t t ATLAS Simulation 2 b ≥ 4 j, ≥ = 13 TeV, Dilepton, s (b) 2 3 4 5 6 7 Number of b-jets 0 0.1 0.2 0.3 0.4 0.5 0.6 0.7 0.8 0.9
Fraction / bin Total background (SM) t t t t via CI t t t t ATLAS Simulation 2 b ≥ 5 j, ≥ = 13 TeV, Single lepton, s (c) 2 3 4 5 6 7 Number of b-jets 0 0.2 0.4 0.6 0.8 1
Fraction / bin Total background (SM) t t t t via CI t t t t ATLAS Simulation 2 b ≥ 4 j, ≥ = 13 TeV, Dilepton, s (d)
Figure 2: (a, b) The jet multiplicity and (c, d) the b-jet multiplicity distributions after preselection for the total predicted background with the t ¯t+jets background estimated via MC simulation (shaded histogram) and the signal scenarios considered in this search in the single-lepton (a, c) and the dilepton (b, d) channels. The signals shown correspond to four-top-quark production with SM kinematics (solid) and t ¯tt ¯t production involving a four-fermion contact interaction (dashed). The distributions are normalized to unit area. The last bin in each distribution contains the overflow.
0 1 2 3 4 Number of mass-tagged jets (J) 0 0.2 0.4 0.6 0.8 1
Fraction / bin Total background (SM) t t t t via CI t t t t ATLAS Simulation 2 b ≥ 5 j, ≥ = 13 TeV, Single lepton, s
(a)
0 1 2 3 4
Number of mass-tagged jets (J) 0 0.2 0.4 0.6 0.8 1
Fraction / bin Total background (SM) t t t t via CI t t t t ATLAS Simulation 2 b ≥ 4 j, ≥ = 13 TeV, Dilepton, s (b) 0 500 1000 1500 2000 2500 3000 [GeV] had T H 0 0.1 0.2 0.3 0.4 0.5
Fraction / bin Total background (SM) t t t t via CI t t t t ATLAS Simulation 2 b ≥ 5 j, ≥ = 13 TeV, Single lepton, s (c) 0 500 1000 1500 2000 2500 3000 [GeV] had T H 0 0.1 0.2 0.3 0.4 0.5 0.6
Fraction / bin Total background (SM) t t t t via CI t t t t ATLAS Simulation 2 b ≥ 4 j, ≥ = 13 TeV, Dilepton, s (d)
Figure 3: (a, b) The mass-tagged RCLR jet multiplicity distributions and (c, d) the HThaddistributions after preselection for the total predicted background with the t ¯t+jets background estimated via MC simulation (shaded histogram) and signals for the single-lepton (a, c) and the dilepton (b, d) channels. The signals shown correspond to four-top-quark production with SM kinematics (solid) and t ¯tt ¯t production involving a four-fermion contact interaction (dashed). The distributions are normalized to unit area. The last bin in each distribution contains the overflow.
6 t ¯t+jets background estimation using data: the TRF
t ¯tmethod
The MC simulation-based approach at NLO accuracy in QCD for the prediction of the inclusive t ¯t background is not expected to model well the very high jet and b-jet multiplicity regions exploited in this search. Given the lack of multi-leg calculations, the MC simulation-based approach relies on the description of such large multiplicities through the parton-shower formalism with consequently large uncertainties. Therefore, a data-driven method is used to estimate the dominant background from t ¯t+jets in regions with very high jet and b-jet multiplicities. This method provides a more accurate prediction of this background than a purely simulation-based approach and avoids the need to estimate modeling uncertainties (documented in Section7) by extrapolation from kinematic regimes with different numbers of jets and b-tagged jets.
The estimate is based on a method introduced in Ref. [93] and is referred to as “tag rate function for t ¯t+jets events”, which will be denoted in the following by TRFt ¯t. The method assumes that the probability of b-tagging an additional7jet in a t ¯t+jets event, where the additional jets can include c- and b-jets, is essentially independent of the number of additional jets. With this assumption, the tagging probability, as a function of the kinematic properties of the jet, can be estimated in lower jet-multiplicity events and then applied to data events with the same jet multiplicity as signal-region events, but lower b-tagged jet multiplicity, where the signal contamination is negligible. These b-tagging probabilities are measured and applied as a function of some of the jet and event properties. Simulation-based corrections are then applied in order to correct for the fact that the assumptions stated above may not be completely valid. Systematic uncertainties in these corrections are propagated through the final estimate.
The per-jet b-tagging probabilities εb are measured in the efficiency extraction regions (described in Section5), after subtracting the contribution from all non-t ¯t processes modeled with MC simulation, amounting to 8–14% of the total background, depending on the channel and on the signal region considered. In order to take into account the correlation of εbwith the b-tagged jet multiplicities, two sets of probabilities ε≥2b
b and εb≥3b are extracted separately for each of the two analysis channels. The measurement of εb≥2b
(εb≥3b) is done from events with ≥2 (≥3) b-tagged jets. The two (three) b-tagged jets with the highest values of the multivariate b-tagging discriminant in the event are excluded from the computation. All probabilities εbare measured both as a function of jet pTand as a function of the quantity ∆R
jet,jet
min × N
jet:
the minimum distance in the η–φ plane between the given jet and all the other jets in the event, multiplied by the jet multiplicity8Njet, chosen in order to take into account the correlation between the b-tagging probability and the presence of nearby jets (see Ref. [93]).
Figure4shows the measured values of the b-tagging probability in the single-lepton and dilepton channels. It can be seen how the εb≥3b are systematically lower than the εb≥2bin the case of the single-lepton channel, while they are systematically higher in the case of the dilepton channel. This effect is due to the presence of hadronically decaying W bosons only in the single-lepton channel, which can give rise only to light-jets or c-jets. In the dilepton case, when εb≥3b is computed in the dominant four jet multiplicity, this leaves only one jet where this b-tagging probability can be sampled, and this jet is likely to be a b-jet or c-jet, neglecting the mis-tag probability and considering the relative contributions of t ¯t+single and double c/b through gluon splitting. This is not the case in the single-lepton channel, where, instead, three tagged
7Additional refers to all jets in addition to the b( ¯b)-jets originating from the t ¯t decay. This includes the jets possibly originating
from hadronically decaying W bosons.
8Assuming a uniform random distribution of jets across the η–φ plane, ∆Rjet,jet
min is inversely proportional to N
jet. Variables
parameterizing the b-tagging probability should be chosen to be mostly independent of Njet, to allow the extrapolation of the b-tagging probabilities from low to high multiplicity regions.
jets out of five can easily be the consequence of tagging a c-jet from the W boson, hence reducing the probability of tagging an additional jet. In the dilepton case, the dependence on ∆Rminjet,jet× Njetfor the ≥3b selection was found to be compatible with a constant value within statistics.
These b-tagging probabilities are then used to build “pseudodata samples” in validation and signal regions: this is done by applying the information derived from the measured εb to the data in the source regions containing the same number of jets and mass-tagged RCLR jets, accounting for the fact that this starting sample contains two b-tagged jets [93]. The small non-t ¯t+jets background contribution is subtracted, analogously to the procedure described in Ref. [94]. In this way, jets that were not b-tagged in the original data sample can be promoted to b-tagged jets in a given pseudodata events sample, with a weight determined by εb, which accounts for the corresponding probability. For the estimate in the 3b categories, the procedure above is applied using only b-tagging probabilities extracted from events in the ≥2b region (εb≥2b). For the estimate in the ≥4b categories, a two-step procedure is applied: the estimates in the corresponding 3b categories are used as the starting point to apply again the same procedure, now using b-tagging probabilities extracted from events in the ≥3b region (εb≥3b).
0.02 0.04 0.06 0.08 b 2 ≥ε b ATLAS -1 = 13 TeV, 36.1 fb s Single Lepton Dilepton 50 100 150 200 250 [GeV] jet T p 0 0.02 0.04 0.06 0.08 b 3 ≥ε b 5 10 15 20 jet N × jet,jet min R ∆
Figure 4: Values of the per-jet b-tagging probability for t ¯t+jets events as a function of the jet transverse momentum (pjetT) and the minimum ∆R between the considered jet and the other jets in the event, scaled by the jet multiplicity (∆Rminjet,jet× Njet), as measured in data requiring the presence of at least two b-jets (εb≥2b) and least three b-jets (εb≥3b). b-tagging probabilities are shown separately for single-lepton and dilepton events. The vertical error bars indicate the statistical uncertainties, while the shaded (hatched) areas indicate the combined statistical and systematic uncertainties. In the dilepton case, a constant b-tagging probability is assumed as a function of ∆Rminjet,jet× Njetfor εb≥3b.
The last step of the method relies on the MC simulation to correct the estimate in each of the considered bins and to assign a set of systematic uncertainties. In order to achieve this, all the steps described above are applied to MC simulated t ¯t+jets events: the b-tagging probability εb is extracted from simulated events in the efficiency extraction regions and is then used to reweight simulated events in the source regions, obtaining an estimate in the signal and validation regions. The resulting estimate in bin i of Hhad
T distributions, B
TRFt ¯t,MC
the signal and validation regions, BiMC, extracting a correction factor for each considered bin, defined
as Ci = BiMC/BiTRFt ¯t,MC. The correction is then applied bin-by-bin to the purely data-driven estimate,
BiTRFt ¯t,Datato obtain a corrected estimate in each bin, BiTRFt ¯t = Ci× BTRFt ¯t,Datai . These corrections reweight
BiTRFt ¯t,Databy less than 20% on average, varying in magnitude region by region, and are primarily aimed to
account for effects such as the dependence of the b-tagging probability on other jet or event properties than the ones used in the parametrization.
A full set of systematic uncertainties is then derived for the estimate BiTRFt ¯t by repeating the described procedure on MC simulated events with systematic variations applied. For each considered source of systematic uncertainty affecting the t ¯t+jets MC prediction (see Section7), a new set of correction factors Ci0is derived. In this ratio, systematic variations ∆Bipartially cancel out since Ci0= (B + ∆B)MCi /(B+
∆B)TRFt ¯t,MCi ' Ci× [1 + (∆Bi/Bi)MC− (∆Bi/Bi)TRFt ¯t,MC]. The cancellation is exact for some uncertainties,
e.g. overall normalization. Besides the systematic uncertainties, two sources of statistical uncertainties are considered. The first is the statistical uncertainty affecting the purely data-driven estimate, due to the limited numbers of data events in the source regions. The second source comes from the MC correction factor, given the limited number of simulated events both in the source regions and in the signal and validation regions.
Validation regions are designed primarily to validate the TRFt ¯tdata-driven estimate of the dominant t ¯t+jets background and confirm the validity of the assumption that the estimate can be extrapolated to the signal regions. Comparisons of the HThaddistributions between data and the total SM prediction (including the SM four-top-quark signal) in the validation regions prior to the fit to data are presented in Figure5for the single-lepton channel and in Figure6for the dilepton channel. The t ¯t+jets background is estimated with the data-driven method, including the MC correction factors and the systematic uncertainties. Data agree well with the SM expectation within the uncertainties, validating the overall data-driven procedure and the assumptions made.
0.5 0.75 1 1.25 Data / Pred. 0 500 1000 [GeV] had T H 0 500 1000 [GeV] had T H 0 500 1000 [GeV] had T H 0 500 1000 1500 [GeV] had T H 0 2000 4000 6000 8000 10000 Events / bin ATLAS -1 = 13 TeV, 36.1 fb s
Data tttt (SM) tt + jets (data-driven)
H/V + t t Non-tt Uncertainty 500 1000 1500 500 1000 100 200 300 400 7 j, 3 b, 0 J 8 j, 3 b, 0 J 7 j, ≥ 4 b, 0 J 8 j, ≥ 4 b, 0 J Single Lepton Pre-fit (a) 0.5 0.75 1 1.25 Data / Pred. 0 500 1000 1500 [GeV] had T H 0 500 1000 1500 [GeV] had T H 0 500 1000 1500 [GeV] had T H 0 500 1000 1500 2000 [GeV] had T H 0 500 1000 1500 2000 2500 Events / bin ATLAS -1 = 13 TeV, 36.1 fb s
Data tttt (SM) tt + jets (data-driven)
H/V + t t Non-tt Uncertainty 200 400 600 100 200 300 50 100 150 7 j, 3 b, 1 J 8 j, 3 b, 1 J 7 j, ≥ 4 b, 1 J 8 j, ≥ 4 b, 1 J Single Lepton Pre-fit (b) 0.5 0.75 1 1.25 Data / Pred. 0 1000 2000 [GeV] had T H 0 1000 2000 [GeV] had T H 0 1000 2000 [GeV] had T H 0 1000 2000 3000 [GeV] had T H 0 50 100 150 200 250 Events / bin ATLAS -1 = 13 TeV, 36.1 fb s
Data tttt (SM) tt + jets (data-driven)
H/V + t t Non-tt Uncertainty 50 100 150 10 20 30 10 20 30 2 J ≥ 7 j, 3 b, 8 j, 3 b, ≥ 2 J 7 j, ≥ 4 b, ≥ 2 J 8 j, ≥ 4 b, ≥ 2 J Single Lepton Pre-fit (c)
Figure 5: Comparison between data and prediction of the HThaddistributions in the single-lepton validation regions prior to the combined fit to data in the single-lepton and dilepton channels. The t ¯t+jets background is estimated with the data-driven method. The t ¯t + V and t ¯t + H processes are denoted t ¯t + H/V . Contributions from W /Z +jets, single-top, diboson and multijet backgrounds are combined into a single background source referred to as “Non-t ¯t”. The hashed area represents the combined statistical and systematic uncertainties of the prediction. The last bin in all figures contains the overflow. The lower panel shows the ratio between the data and the total prediction, including the SM t ¯tt ¯t signal. An arrow indicates that the point is off-scale.
0.5 0.75 1 1.25 Data / Pred. 0 500 1000 [GeV] had T H 0 500 1000 [GeV] had T H 0 500 1000 1500 2000 [GeV] had T H 0 500 1000 1500 2000 2500 [GeV] had T H 0 100 200 300 400 500 600 Events / bin ATLAS -1 = 13 TeV, 36.1 fb s
Data tttt (SM) tt + jets (data-driven)
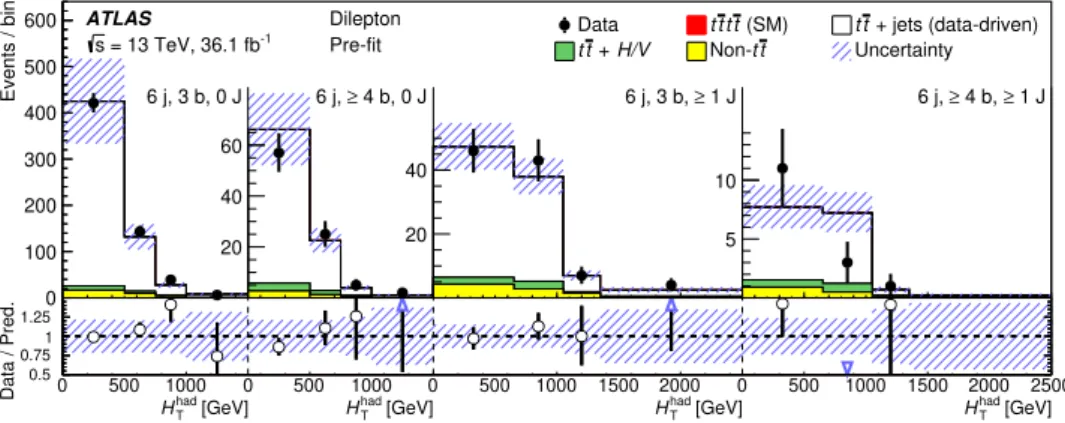
H/V + t t Non-tt Uncertainty 20 40 60 20 40 5 10 6 j, 3 b, 0 J 6 j, ≥ 4 b, 0 J 6 j, 3 b, ≥ 1 J 6 j, ≥ 4 b, ≥ 1 J Dilepton Pre-fit
Figure 6: Comparison between data and prediction of the HThaddistributions in the dilepton validation regions prior to the combined fit to data in the single-lepton and dilepton channels. The t ¯t+jets background is estimated with the data-driven method. The t ¯t + V and t ¯t + H processes are denoted t ¯t + H/V . Contributions from W /Z +jets, single-top, diboson and multijet backgrounds are combined into a single background source referred to as “Non-t ¯t”. The hashed area represents the combined statistical and systematic uncertainties of the prediction. The last bin in all figures contains the overflow. The lower panel shows the ratio between the data and the total prediction, including the SM t ¯tt ¯t signal. An arrow indicates that the point is off-scale.
7 Systematic uncertainties
Several sources of systematic uncertainties that can affect the normalization of signal and background and the shape of the HThaddistributions are considered. The systematic uncertainties of the data-driven estimate for the t ¯t+jets background are propagated as described in Section6. For each considered source of systematic uncertainty affecting the t ¯t+jets MC prediction, a new set of correction factors Ci0is derived,
by coherently replacing the nominal MC prediction with the systematic variation in all regions. The usage of this data-driven technique to estimate the t ¯t+jets background, as opposed to a purely simulation-based approach, allows to reduce significantly the uncertainty on its prediction in the high jet and b-tagged jet multiplicity topologies exploited by this search.
7.1 Experimental uncertainties
The uncertainty in the combined 2015+2016 integrated luminosity affecting the overall normalisation of all processes estimated from the simulation is 2.1%. It is derived, following a methodology similar to that detailed in Ref. [31], and using the LUCID-2 detector for the baseline luminosity measurements [95], from calibration of the luminosity scale using x–y beam-separation scans. This systematic uncertainty is applied to all processes modeled using MC simulations.
Uncertainties associated with jets primarily arise from the jet energy scale. The jet energy scale (JES) and its uncertainty are derived by combining information from test-beam data, LHC collision data and simulation [40]. The JES uncertainty is split into 21 uncorrelated sources, which have different dependencies on jet pTand η. In particular, three uncertainties account for differences in the jet response and simulated
jet composition of light-quark, b-quark, and gluon-initiated jets. The flavor response uncertainties are derived by comparing the average jet response for each jet flavor using Pythia and Herwig++. The flavor composition uncertainty is assumed to be a 50% quark and 50% gluon composition with a conservative 100% uncertainty. Uncertainties in the jet mass scale, the jet energy resolution and the efficiency to pass the JVT requirement are also considered.
The efficiency of the b-tagging algorithm is measured for each jet flavor using control samples in data and in simulation. From these measurements, correction factors are derived to match the tagging rates in the simulation [43,46,47]. Uncertainties in these corrections include a total of six independent sources affecting b-jets and four independent sources affecting c-jets. Each uncertainty has a different dependence on jet pT. Seventeen uncertainties are considered for the light-jet tagging, which depend on the jet pTand
η. These systematic uncertainties are taken as uncorrelated between b-jets, c-jets, and light-flavor jets. An additional uncertainty is included due to the extrapolation of these corrections to jets with pTbeyond the
kinematic reach of the data calibration samples used (pT > 300 GeV for b- and c-jets and pT > 750 GeV
for light-jets) and is taken to be correlated among the three jet flavors.
Uncertainties associated with leptons arise from the trigger, reconstruction, identification, and isolation efficiencies, as well as the lepton momentum scale and resolution. These are measured in data using leptons in Z → `+`−and J/ψ → `+`−events at
√
s = 13 TeV [33,34].
All uncertainties in energy scales and resolutions are propagated to the missing transverse momentum. Ad-ditional small uncertainties associated with the modeling of the underlying event affecting the reconstruction of the missing transverse momentum are also taken into account.
7.2 Modeling uncertainties
As mentioned in Section6, common normalization uncertainties for t ¯t+jets that equally affect BiMCand
BiTRFt ¯t,MChave no impact on their ratios Ci, and consequently on the total TRFt ¯tprediction. Instead,
uncertainties in the t ¯t+jets heavy-flavor content or kinematics can have residual systematic effects on the TRFt ¯tprediction. Therefore, no uncertainty is assigned to the inclusive t ¯t production cross section in the search, while variations of the relative fractions of t ¯t events with additional jets originating from b-and c- quarks, as well as comparisons of t ¯t+jets kinematics with alternative predictions, are considered as systematic uncertainties related to the theory modeling of the t ¯t+jets process, as described below. A categorization of t ¯t+jets events is performed for the purpose of assigning systematic uncertainties associated with the modeling of heavy-flavor production in different topologies [96]. Events are categorized depending on the flavor content of additional particle jets and labeled either t ¯t+≥1b or t ¯t+≥1c, while the remaining events are labeled as t ¯t+light-jets events, including those with no additional jets.
Detailed comparisons of t ¯t+≥1b production between the nominal NLO Powheg-Box v2 + Pythia 6.428 t ¯t inclusive MC sample and an NLO prediction based on Sherpa + OpenLoops [56, 75] (referred to as SherpaOL) have shown that the cross sections agree within 50% [97]. Therefore, a normalization uncertainty of 50% is applied to the t ¯t+≥1b component of the t ¯t+jets background obtained from the Powheg-Box v2 + Pythia 6.428 MC simulation. In the absence of an NLO prediction for the t ¯t+≥1c background, a 50% systematic uncertainty is also applied to the t ¯t+≥1c component, and the uncertainties in the t ¯t+≥1b and t ¯t+≥1c background normalizations are taken as uncorrelated. The overall normalization of all systematic uncertainties in the t ¯t+jets prediction, except these explicit uncertainties in the t ¯t+≥1c and t ¯t+≥1b normalizations, is fixed to the nominal one and only migrations across categories and distortions to the shape of the kinematic distributions are considered.
To provide a comparison with a different parton-shower model, an alternative t ¯t sample was generated using the same Powheg model setup as for the nominal sample described in Section4, except the PS, hadronization, underlying-event (UE) and MPI are simulated using Herwig++ (version 2.7.1) [98] with the UEEE5 tune [99] and the corresponding CTEQ6L1 PDF set. To assess the systematic uncertainties related to the use of different models for the hard-scattering generation, while maintaining the same PS model, a sample using MadGraph5_aMC@NLO [17] interfaced to Herwig++ 2.7.1 was generated. The effects of initial- and final-state radiation (ISR/FSR) are explored using two alternative Powheg-Box v2 + Pythia 6.428 samples, one with hdampset to 2 × mtop, the renormalization and factorization scales set to
half the nominal value and using the PERUGIA2012 high-variation UE tune, giving more radiation, and one with the PERUGIA2012 low-variation UE tune, hdamp= mtopand the renormalization and factorization
scales set to twice the nominal value, giving less radiation [100]. The µRand µFscale variations and the
hdampvariations are kept correlated, since the two proposed variations cover the full set of uncertainties obtained by changing the scales and the resummation damping parameter independently.
Previous studies have seen that NNLO calculations provide better agreement with data than NLO calculation, particularly for the top-quark pTdistribution [101]. Hence, an uncertainty in the modeling of the top-quark
pTdistribution is evaluated by taking the full difference between applying and not applying the reweighting to match the predictions at NNLO accuracy in QCD [102,103] of the top-quark pT distribution. This
uncertainty only affects the t ¯t+light-jets and t ¯t+≥1c events, for which NNLO predictions have been derived in literature.
In the case of t ¯t+≥1b events, an uncertainty is assigned by comparing the NLO prediction in the four-flavor scheme of t ¯t+≥1b including parton shower [97] based on SherpaOL with the nominal NLO Powheg-Box v2
+ Pythia 6.428 inclusive t ¯t MC sample with a five-flavor scheme, by means of a generator-level reweighting, as detailed in Ref. [96]. This reweighting is performed separately for each of the t ¯t+≥1b subcategories in such a way that their inter-normalization and the shape of the relevant kinematic distributions are at NLO accuracy, while preserving the nominal t ¯t+≥1b cross section in Powheg-Box v2 + Pythia 6.428. Additional uncertainties are assessed for those contributions of t ¯t+≥1b background which are not part of the NLO prediction, namely from MPI or FSR from top-quark decay products. They are assessed via the alternative radiation samples described above.
Uncertainties affecting the modeling of the W /Z +jets background include 5% scale uncertainty from their respective normalizations to the theoretical NNLO cross sections [104]. An additional 24% normalization uncertainty is added in quadrature for each additional inclusive jet-multiplicity bin, based on a comparison among different algorithms for merging LO matrix elements and parton showers [105]. Therefore, normalization uncertainties of 54% and 59% are assigned for events with exactly five jets and at least six jets, respectively. These normalization uncertainties are taken as correlated (uncorrelated) across jet multiplicities within signal regions (efficiency extraction regions). Uncertainties affecting the modeling of the single-top-quark background include an uncertainty of +5% and −4% in the total cross section estimated as a weighted average of the theoretical uncertainties in t-, W t- and s-channel production [84–86]. Uncertainties in the diboson background normalization include 5% from the NLO cross sections [106], as well as an additional 24% normalization uncertainty added in quadrature for each additional inclusive jet multiplicity bin: this assumes that two of the jets originate from the W /Z decays, as in WW /W Z → `ν j j. Recent comparisons between data and Sherpa 2.1.1 for W Z (→ `ν``)+ ≥4 jets show agreement within the experimental uncertainty of approximately 40% [107], which further justifies the above uncertainties. Uncertainties in the t ¯t+V and t ¯t+ H normalizations are ±15% and+10−13%, respectively, from the uncertainties in their respective NLO cross sections [88,89,108,109].
For the determination of the SM t ¯tt ¯t production signal strength, no uncertainty is assigned to the theoretical cross section for this process. In the extraction of the exclusion limits on t ¯tt ¯t production via BSM models, the SM t ¯tt ¯t process is considered as background and a conservative 50% normalization uncertainty is assigned to the total t ¯tt ¯t cross section, taking into account the uncertainties in both its production cross section and possible acceptance and shape variations [16,17].
Uncertainties in the data-driven fake or non-prompt lepton background estimate include contributions from the limited sample size in data, particularly at high jet and b-tag multiplicities, from the uncertainty in the real and fake efficiencies extracted from data in dedicated control regions (e.g. selected with a requirement on either the maximum ETmissor mWT ), as well as from the extrapolation from these control regions to the analysis regions, as detailed in Ref. [92]. Based on comparisons between data and the total prediction in these control regions, the normalization uncertainties assumed for this background are 50% (100%) for events with a central (forward) electron, and 50% for muons, taken to be uncorrelated across regions with different mass-tagged RCLR jet multiplicities and between electron and muon channels. No explicit shape uncertainty is assigned due to the associated large statistical uncertainties. These uncertainties are uncorrelated between bins in the final discriminant distribution and effectively cover possible shape uncertainties.
8 Results
Following the statistical method presented below, four-top-quark production signals are searched for by performing a binned profile likelihood fit to the HThaddistribution simultaneously in the 12 signal regions in the single-lepton channel and 8 signal regions in the dilepton channel, using a total of 20 final-state topologies. The single-lepton and dilepton channels are combined in order to gain sensitivity to different four-top-quark production signals.
8.1 Statistical interpretation
For each search, the HThad distributions across all regions considered are jointly analyzed to test for the presence of a signal predicted by the benchmark scenarios. The statistical interpretation uses a binned likelihood function L(µ, θ) constructed as a product of Poisson probability terms over all bins considered in each search (namely, all HThad bins in the 20 signal regions defined in Figure1). The likelihood function depends on the signal-strength parameter µ, a multiplicative factor that scales the number of expected signal events, and θ, a set of nuisance parameters (NPs) that encode the effect of systematic uncertainties on the signal and background expectations, which are implemented in the likelihood function as Gaussian, log-normal or Poisson constraints. Individual sources of systematic uncertainty are considered to be uncorrelated. Correlations of a given systematic uncertainty are maintained across processes and channels. The statistical uncertainty of the prediction, which incorporates the statistical uncertainty of the MC events and of the data-driven fake and non-prompt lepton estimate, is included in the likelihood in the form of additional nuisance parameters, one for each of the included bins.
The test statistic qµis defined as the profile likelihood ratio: qµ= −2 ln(L(µ, ˆˆθµ)/L( ˆµ, ˆθ)), where ˆµ and ˆθ are the values of the parameters that maximize the likelihood function (with the constraint 0 ≤ ˆµ ≤ µ), and ˆˆθµ are the values of the NPs that maximize the likelihood function for a given value of µ. The test statistic qµ is implemented in the RooFit package [110,111]. In the absence of any significant excess above the background expectation, upper limits on the signal production cross section for each of the signal scenarios considered in Section4.1are derived by using qµand the CLsmethod [112,113]. For a given
signal scenario, values of the production cross section (parameterized by µ) yielding CLs< 0.05, where
CLsis computed using the asymptotic approximation [114], are excluded at >95% C.L.
8.2 Comparison between data and prediction in signal regions after the fit to data
A binned likelihood fit to the data is performed in the 12 signal regions in the single-lepton channel and 8 signal regions in the dilepton channel, leading to good agreement between data and post-fit estimates. Comparisons of the HThaddistributions between data and the total SM prediction (including the SM t ¯tt ¯t signal) in the signal regions, after the combined fit to data in the signal-plus-background hypothesis in the two channels, are presented in Figure7for the single-lepton channel and in Figure8for the dilepton channel. Good agreement of the extrapolated fit results is observed as well in the validation regions, which are presented in AppendixA.
0.5 0.75 1 1.25 Data / Pred. 0 500 1000 [GeV] had T H 0 500 1000 [GeV] had T H 0 500 1000 [GeV] had T H 0 500 1000 1500 [GeV] had T H 0 100 200 300 400 500 600 700 800 900 Events / bin ATLAS -1 = 13 TeV, 36.1 fb s
Data tttt (SM) tt + jets (data-driven)
H/V + t t Non-tt Uncertainty 100 200 50 100 150 20 40 60 80 9 j, 3 b, 0 J ≥ 10 j, 3 b, 0 J 9 j, ≥ 4 b, 0 J ≥ 10 j, ≥ 4 b, 0 J Single Lepton Post-fit (a) 0.5 0.75 1 1.25 Data / Pred. 0 500 1000 1500 [GeV] had T H 0 500 1000 1500 [GeV] had T H 0 500 1000 1500 [GeV] had T H 0 500 1000 1500 2000 [GeV] had T H 0 50 100 150 200 250 300 350 Events / bin ATLAS -1 = 13 TeV, 36.1 fb s
Data tttt (SM) tt + jets (data-driven)
H/V + t t Non-tt Uncertainty 50 100 150 20 40 60 80 20 40 9 j, 3 b, 1 J ≥ 10 j, 3 b, 1 J 9 j, ≥ 4 b, 1 J ≥ 10 j, ≥ 4 b, 1 J Single Lepton Post-fit (b) 0.5 0.75 1 1.25 Data / Pred. 0 1000 2000 [GeV] had T H 0 1000 2000 [GeV] had T H 0 1000 2000 [GeV] had T H 0 1000 2000 3000 [GeV] had T H 0 20 40 60 80 100 120 Events / bin ATLAS -1 = 13 TeV, 36.1 fb s
Data tttt (SM) tt + jets (data-driven)
H/V + t t Non-tt Uncertainty 20 40 60 80 10 20 30 10 20 30 40 2 J ≥ 9 j, 3 b, ≥ 10 j, 3 b, ≥ 2 J 9 j, ≥ 4 b, ≥ 2 J ≥ 10 j, ≥ 4 b, ≥ 2 J Single Lepton Post-fit (c)
Figure 7: Comparison between data and prediction of the HThaddistributions in the single-lepton signal regions after the combined fit to data in both the single-lepton and dilepton channels. The t ¯t+jets background is estimated with the data-driven method. The t ¯t + V and t ¯t + H processes are denoted t ¯t + H/V . Contributions from W /Z +jets, single-top, diboson and multijet backgrounds are combined into a single background source referred to as “Non-t ¯t”. The hashed area represents the combined statistical and systematic uncertainties of the prediction. The last bin in all figures contains the overflow. The lower panel shows the ratio between the data and the total prediction, including the SM t ¯tt ¯t signal scaled by the best-fit signal strength. An arrow indicates that the point is off-scale.
0.5 0.75 1 1.25 Data / Pred. 0 500 1000 [GeV] had T H 0 500 1000 [GeV] had T H 0 500 1000 [GeV] had T H 0 500 1000 1500 [GeV] had T H 0 20 40 60 80 100 120 Events / bin ATLAS -1 = 13 TeV, 36.1 fb s
Data tttt (SM) tt + jets (data-driven)
H/V + t t Non-tt Uncertainty 5 10 15 20 10 20 30 40 5 10 7 j, 3 b, 0 J 7 j, ≥ 4 b, 0 J ≥ 8 j, 3 b, 0 J ≥ 8 j, ≥ 4 b, 0 J Dilepton Post-fit (a) 0.5 0.75 1 1.25 Data / Pred. 0 500 1000 1500 2000 [GeV] had T H 0 500 1000 1500 2000 [GeV] had T H 0 500 1000 1500 2000 [GeV] had T H 0 500 1000 1500 2000 2500 [GeV] had T H 0 5 10 15 20 25 30 35 40 45 Events / bin ATLAS -1 = 13 TeV, 36.1 fb s
Data tttt (SM) tt + jets (data-driven)
H/V + t t Non-tt Uncertainty 5 10 10 20 30 2 4 6 8 1 J ≥ 7 j, 3 b, 7 j, ≥ 4 b, ≥ 1 J ≥ 8 j, 3 b, ≥ 1 J ≥ 8 j, ≥ 4 b, ≥ 1 J Dilepton Post-fit (b)
Figure 8: Comparison between data and prediction of the HThaddistributions in the dilepton signal regions after the combined fit to data in both the single-lepton and dilepton channels. The t ¯t+jets background is estimated with the data-driven method. The t ¯t + V and t ¯t + H processes are denoted t ¯t + H/V . Contributions from W /Z +jets, single-top, diboson and multijet backgrounds are combined into a single background source referred to as “Non-t ¯t”. The hashed area represents the combined statistical and systematic uncertainties of the prediction. The last bin in all figures contains the overflow. The lower panel shows the ratio between the data and the total prediction, including the SM t ¯tt ¯t signal scaled by the best-fit signal strength. An arrow indicates that the point is off-scale.
Table 2: Breakdown of the contributions to the uncertainties on µ. The quoted uncertainties ∆µ are obtained by repeating the fit with certain sets of nuisance parameters fixed to their post-fit values, and subtracting in quadrature the resulting total uncertainty of µ from the uncertainty from the full fit. The total statistical uncertainty is evaluated by fixing all nuisance parameters in the fit. The line “background-model statistical uncertainty” refers to the statistical uncertainties of the MC event samples and in the data-driven determination of the t ¯t+jets and the non-prompt and fake-lepton background components. These uncertainties are evaluated after the fit described in Section8.
Uncertainty source ±∆µ
t ¯t+jets modeling +1.2 −0.96
Background-model statistical uncertainty +0.91 −0.85 Jet energy scale and resolution, jet mass +0.38 −0.16
Other background modeling +0.26 −0.20
b-tagging efficiency and mis-tag rates +0.33 −0.10
JVT, pileup modeling +0.18 −0.073
t ¯t+ H/V modeling +0.053 −0.055
Luminosity +0.050 −0.026
Total systematic uncertainty +1.6 −1.4
Total statistical uncertainty +1.1 −1.0
Total uncertainty +1.9 −1.7
Table2shows the post-fit impact of the largest sources of systematic uncertainty on the signal strength µ after the simultaneous fit to data in the single-lepton and dilepton channels. The leading sources of systematic uncertainty vary depending on the analysis region considered. The largest contributions are due to the uncertainty associated with the choice of t ¯t+jets parton shower and hadronization model and that of the t ¯t+jets NLO generator, as well as large statistical uncertainties associated with the background prediction.
8.3 Limits on four-top-quark production in the single-lepton and dilepton channel
No significant excess of events above the SM background prediction, excluding the SM t ¯tt ¯t production, is found. In the case of t ¯tt ¯t production with SM kinematics, an observed (expected) 95% C.L. upper limit on the production cross section of 47 fb (33 fb) is obtained, corresponding to an upper limit on σ(t ¯tt ¯t) relative to the SM prediction of 5.1 (3.6). The SM fitted signal strength µ, after combination of the single-lepton and dilepton channels, is measured to be 1.7+1.9−1.7.
The search is used to set limits on BSM four-top-quark production via an EFT model (see Section4). For setting limits on this BSM model, the SM t ¯tt ¯t process is considered as a background. In the case of t ¯tt ¯t production via an EFT model with a four-top-quark contact interaction, an observed (expected) 95% C.L. upper limit on the production cross section of 21 fb (22 fb) is obtained. The cross-section limit for the contact interaction case is lower than in the SM because the contact interaction tends to result in final-state objects with slightly larger momenta (see e.g. Figure3). The upper limit on the production cross section can be translated into an observed (expected) limit on the free parameter of the model |C4t|/Λ2 < 1.9 TeV−2(1.9 TeV−2).