HAL Id: hal-02989085
https://hal.archives-ouvertes.fr/hal-02989085
Submitted on 9 Nov 2020HAL is a multi-disciplinary open access archive for the deposit and dissemination of sci-entific research documents, whether they are pub-lished or not. The documents may come from teaching and research institutions in France or abroad, or from public or private research centers.
L’archive ouverte pluridisciplinaire HAL, est destinée au dépôt et à la diffusion de documents scientifiques de niveau recherche, publiés ou non, émanant des établissements d’enseignement et de recherche français ou étrangers, des laboratoires publics ou privés.
the Wet Season
G. Bergametti, B. Marticorena, J. Rajot, G. Siour, A. Féron, C. Gaimoz, A.
Coman, B. Chatenet, M. Coulibaly, A. Maman, et al.
To cite this version:
G. Bergametti, B. Marticorena, J. Rajot, G. Siour, A. Féron, et al.. The Respective Roles of Wind Speed and Green Vegetation in Controlling Sahelian Dust Emission during the Wet Sea-son. Geophysical Research Letters, American Geophysical Union, 2020, 47 (22), pp.e2020GL089761. �10.1029/2020GL089761�. �hal-02989085�
The Respective Roles of Wind Speed and Green Vegetation in Controlling Sahelian
Dust Emission during the Wet Season
G. Bergametti1, B. Marticorena1, J. L. Rajot1,2, G. Siour1, A. Féron1, C. Gaimoz1, A. Coman1, B. Chatenet1, M. Coulibaly3, A. Maman2,4, I. Koné3, and A. Zakou4
1
LISA (Laboratoire Interuniversitaire des Systèmes Atmosphériques), UMR CNRS 7583, Université Paris-Est-Créteil, Université de Paris, Institut Pierre Simon Laplace (IPSL), Créteil, France.
2
iEES Paris (Institut d'Ecologie et des Sciences de l'Environnement de Paris), UMR IRD 242, Université Paris Est Créteil‐Sorbonne Université‐CNRS‐INRA‐Université de Paris, Bondy, France.
3
Institut d’Economie Rurale (IER) Station de Recherche Agronomique de Cinzana, Bamako, Mali.
4
Institut de Recherche pour le Développement (IRD), IRD-Niamey, Niamey, Niger.
Corresponding author: Gilles Bergametti (gilles.bergametti@lisa.u-pec.fr)
Key Points:
Between May and September, the decrease of the high wind speeds is the main reason for
the decrease of PM10 in the Central Sahel
During the growing period (June to September), the green vegetation progressively
reduces dust emission efficiency in the Sahel
For identical wind speeds, vegetation cover characterized by NDVI higher than 0.26
Abstract
Based on 10 years of continuous measurements of wind speed, rainfall and PM10 concentrations (i.e., concentrations of the particulate matter having a diameter lower than 10 µm) performed in two Sahelian stations, we examine how wind speed and vegetation interact during the wet season to control the dust concentration when it is due to local dust emissions. The results clearly show that the frequency of the high wind speeds is higher at the beginning of the wet season and is the main driver of the seasonal dust emission. During the second part of the wet season, the
frequency of high wind speeds is much lower and, in addition, their efficiency for wind erosion and dust emission is strongly affected by the vegetation whose growth reduces progressively PM10 concentrations up to 80%.
1 Introduction
Dust emission from the Sahelian belt (and more generally from the semi-arid regions) is a
complex phenomenon resulting from strong interactions between meteorological factors (such as wind speed and precipitation) and surface properties, especially the vegetation cover. Because meteorological regimes and surface properties change with time, the way by which these interactions occur varies on various time scales.
Wind speed is the real driver of wind erosion and, thus, the intensity of dust emissions is highly sensitive to any small change in wind speed: indeed, these processes are thresholded processes and depend on wind speed through power functions (e.g., Shao, 2008).
Assessing the temporal variability of wind speed is thus a key point, knowing that the characteristic time scale of variability can be less than a minute. In the Sahel, two main meteorological regimes generate wind speeds sufficient to induce wind erosion and dust
emission. The Nocturnal Low-Level Jet (NLLJ) is characterized by a wind speed maximum that forms in the lower troposphere at nighttime. From sunrise to about 1200 local time, the
turbulence, growing by surface heating, allows an efficient downward mixing of momentum from NLLJ to produce surface wind speeds that can be sufficiently strong to initiate dust emission. When the turbulence is the highest in the planetary boundary layer, a strong mixing reduces vertical gradients of momentum and totally dissipates the jet. This phenomenon is responsible for most of the high wind speeds occurring during morning in the Sahelian and Saharan regions (e.g., Fiedler et al., 2013; Heinold et al., 2013; Kaly et al., 2015; Knippertz, 2008; Lothon et al., 2008; Marsham et al., 2013; Parker et al., 2005). During the wet season, very high wind speeds are associated with convective cells that develop into Mesoscale Convective Systems (MCS). Such storms are predominantly nocturnal (e.g., Bouniol et al., 2012; Nesbitt & Zipser, 2003), vary in scale but most of them have sizes ranging from tens to hundreds of kilometers (e.g., Laing & Fristch, 1993; Marsham et al., 2008; Roberts & Knippertz, 2012). In areas where the soils are easily erodible, dust is lofted quasi-continuously along these fronts producing dust walls, called “haboobs,” extending over altitudes ranging from 2,000 to 5,000 m (Williams et al., 2009).
Based on 10 years of meteorological measurements at high temporal resolution in two Sahelian stations, Bergametti et al. (2017) evaluated the relative contribution to dust emission of high wind speeds linked to NLLJ and to convective events through an indicator called Dust Uplift
Potential (DUP) (Marsham et al., 2011). Their results showed that in the Central Sahel, the NLLJ controls the frequency of wind erosion events. However, the highest wind speeds occurring at that time are only slightly over the threshold wind speed (TWS) for wind erosion (i.e., the minimum wind speed allowing wind erosion to start) and thus generate probably limited dust emissions. On the opposite, their results suggested that most of the annual DUP is due to the rare but very intense high wind speed events occurring in the late afternoon and during nighttime, especially those occurring at the beginning of the rainy season. This is in agreement with the seasonal pattern of dust concentrations observed at the same stations as reported by Marticorena et al. (2010) and Kaly et al. (2015). Indeed, these authors demonstrated that very high dust
concentrations (up to several mg m-3) are recorded during the wet season as the consequence of
intense but short events associated with the crossing of MCS. They also showed that the highest dust concentrations observed in the Sahel during the dry season are generally not locally
produced but result, for a large part, from dust emitted in the Sahara desert and transported towards the Sahel in the Harmattan layer as the analyzes of the dust composition also indicates (Rajot et al., 2008).
In the Sahel, precipitation is also strongly season-dependent and closely linked to the onset and retreat of the monsoon: rain is mainly brought by MCS (e.g., Mathon et al., 2002) and occurs between May and October, the rest of the year being almost totally dry. The direct impact of precipitation on wind erosion and dust emission is to increase the soil moisture and consequently the capacity of the soil grains to be lofted. However, Bergametti et al. (2016) have shown that, in Niger, a period of less than 12 h after a rain event has finished is generally sufficient to almost fully restore the sand transport potential of a soil. This strongly suggests that the inhibition and/or reduction of dust emissions due to the increase in soil moisture following a rain event are rather limited in this region.
However, the seasonality of precipitation has also an indirect effect on dust emission since it controls the growth and senescence of the natural and cultivated vegetations. Large parts of Sahelian surface evolves from almost bare in May to largely covered by green herbaceous
vegetation in August and September. This is particularly marked over cultivated fields where soil surface is often cleared and crop residues collected before the beginning of the rainy season, this explains why fields are much more erodible than fallow lands in the Sahel (Abdourhamane Touré et al., 2019; Bielders et al., 2002; Rajot, 2001; Sterk & Stein, 1997). Precipitation decreases from the beginning of September and stops generally in October, inducing a
progressive senescence of the vegetation (Plate S1). Thus, from October to the next wet season, the remaining dry vegetation controls the percentage of cover of the surface: it continuously decreases due to agricultural practices, soil trampling, grazing and consumption by termites and gradually uncovers the surface until the start of the next wet season (e.g., Pierre et al., 2015). As a result, dry vegetation plays a major role in protecting the surface against wind erosion during the dry season and the beginning of the following wet season: Abdourhamane Touré et al. (2011) estimated that a percentage of cover of agricultural fields by vegetation residues higher than 2% could be sufficient for significantly reduce wind erosion and dust emission. On an interannual time scale, Kergoat et al. (2017), using an indicator of the dry-season nonphotosynthetic vegetation cover in the Sahel based on Moderate Resolution Imaging Spectroradiometer
(MODIS), suggested that 43% of the year‐to‐year variance in Sahelian‐mean dry‐season aerosol optical depth can be explained by the change in dry vegetation cover as a consequence of differences in precipitation patterns occurring during the previous wet season. On the opposite,
the role of the green vegetation on wind erosion and dust emission in the Sahel has been less investigated despite the fact that the most intense dust emission, as mentioned before, occurs during the wet season. The measurements of PM10 concentrations reported by Marticorena et al. (2010) clearly show a minimum in the core of wet season compared to the early monsoon period. In the same way, DUP is also lower in the second half of July and August indicating that a change in the intensity of the highest wind speeds significantly contributes to this decrease of dust emissions during the core of the monsoon period. However, at this period, the vegetation cover is close to its maximum and could have an additive protective effect of the surface against wind erosion. However, it is difficult to evaluate precisely how much of the changes in wind speed and vegetation cover contribute respectively to the decrease of dust concentrations along the wet Sahelian season.
In this paper, we use high temporal resolution wind speed and PM10 concentration
measurements over the period 2006-2015 in two Sahelian stations in combination with MODIS NDVI data to provide an assessment of the respective roles of wind and vegetation on dust emission during the wet season in the Sahel.
2 Materials and Methods
2.1 Data acquisition
The two observing stations are located close to the small villages of Cinzana (Mali, 13.28°N, 5.93°W) and Banizoumbou (Niger, 13.54°N, 2.66°E). They are about 900 km away from each other and are on the main transport route of Saharan and Sahelian dust toward the north-tropical Atlantic Ocean. The Cinzana station is embedded inside the agronomical research station of the
Institut d’Economie Rurale (IER). The rainfall is about 770 mm year-1
, and the area of the station is protected by a vegetation cover mainly composed of shrubs and trees. In Niger, the station, installed in a more than 20 years old fallow embedded in a traditional fallows/fields area, is
located at 2.5 km from the village of Banizoumbou. The rainfall is about 550 mm year-1.
Meteorological measurements are performed at 6.5 m above ground level (agl) in Banizoumbou and at 2.3 m agl in Cinzana. Instrumentation has been selected based on criteria of simplicity of use and maintenance and capability to resist to severe dust and meteorological conditions. A
Windsonic 2-D anemometer (Gill Instruments Ltd®.) provides the wind speed and direction
averaged over a 5 min time step. Rainfall is monitored using an ARG100 aerodynamic
precipitation sensor (Campbell Scientific Instruments®) working according to the principle of the
“tipping bucket” mechanism. It provides a contact closure at each tipping which occurs for each 0.2 mm of rainfall and the number of tips is cumulated over a 5-minute time step. Annual recovery rate during the wet season for both sites and for the period 2006–2015 were always higher than 91% for wind speed data and higher than 83% for rainfall (Table S1).
Atmospheric concentrations of Particulate Matter smaller than 10 μm (PM10) are measured
using a Tapered Element Oscillating Microbalance (TEOM 1400A from Thermo Scientific®)
equipped with a standard PM10 inlet (R&P® PM-10 operating at 16.7 LPM). More precisely,
PM10 means particulate matter which passes through a size selective inlet with a 50% efficiency cut-off at 10 μm aerodynamic diameter. At both stations, the inlet is installed at 6.5 m agl. Details on the procedure can be found in Marticorena et al. (2010) and Kaly et al. (2015).
To follow the growth and senescence of the vegetation, the normalized difference vegetation index (NDVI) is a well-adapted proxy in semiarid areas such as the Sahel (i.e., Huber and Fensholt, 2011; Tucker et al., 2005). We used NDVIs from Terra/MODIS. The vegetation indices (MOD13Q1) Version 6 data are generated every 16 days with a 250-meter (m) spatial resolution as a level 3 product (Didan, 2015). We selected the four pixels surrounding
Banizoumbou and Cinzana stations and averaged the NDVI values of these four pixels in order to integrate possible local differences in vegetation cover. In fact, the standard deviations associated to this averaging were very low, most of them being lower than 1% and never exceeded 6% in Banizoumbou and 14% in Cinzana.
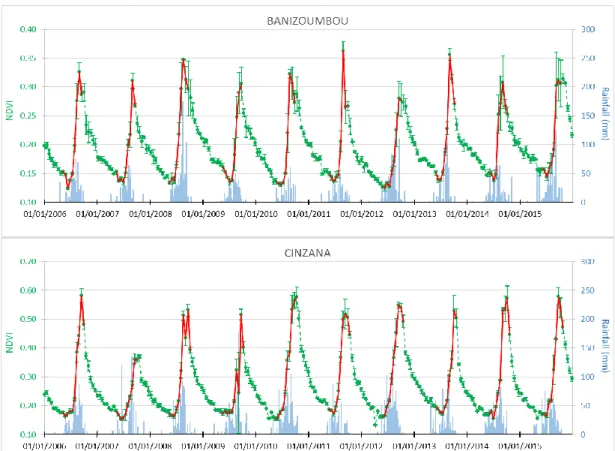
In agreement with the difference in rainfall, the vegetation is higher in Cinzana than in
Banizoumbou (Figure 1) : the mean annual NDVI minimum over the considered period is 0.163 (+/- 0.008) in Cinzana while it is only 0.134 (+/- 0.006) in Banizoumbou. The mean annual NDVI maximum are 0.532 (+/-0.065) in Cinzana and 0.323 (+/-0.026) in Banizoumbou.
2.2 Data selection
To examine how wind speed and vegetation interact to control dust emission during the vegetative period in the Sahel, we selected the period ranging from 1 May to 30 September. Indeed, the period from the beginning of May to about mid-June exhibits the lowest NDVI, the vegetation having not started to grow. Moreover, at that time, the vegetative residues of the previous year being at their minimum. Thus, at that time, we can consider that the surface is almost bare or, at least, minimally protected by the vegetation. We limited the period to the end of September when the senescence becomes significant and the dry vegetation begins to control the cover of the surface. This cycle of the vegetation is illustrated by the sketch of pictures of a millet field recorded at different periods in 2007 in Banizoumbou (Plate S1).
We also selected only the periods of time for which the wind speed was greater than wind speed
limits defined as 5 m s-1 and 4 m s-1 for Banizoumbou and Cinzana, respectively. These values
are slightly lower than the erosion threshold wind speed (TWS) as defined by Bergametti et al.
(2017) (7 and 5.5 m s-1 in Banizoumbou and Cinzana, respectively). Indeed, wind erosion can
occur for wind speeds lower than the TWS when this latter is defined as the wind speed for which wind erosion is detected 50% of the time. The occurrence or not of wind erosion for wind speed slightly lower than this TWS is thus mainly dependent on the variance of the 5-minute average wind speed (i.e. on its probability density function). As a consequence, the PM10 concentrations corresponding to the wind speeds the closest of these thresholds can mix periods of time with local/regional wind erosion and dust and periods corresponding to “background” dust concentrations.
Figure 1. Weekly rainfall (in blue) and 250m MODIS NDVIs for Banizoumbou (top) and
Cinzana (bottom) for the period 01/01/2006 to 31/12/2015) in green. NDVIs report here the average of the four pixels surrounding the stations, the vertical bars are the standard deviations associated to this averaging. The red line corresponds to the periods considered in this paper. For Cinzana, rainfall data are missing from 8 July 2007 to 5 August 2007.
We eliminate the samples collected during rain events higher than 0.2mm and we also discarded all the 24-hour periods following the end of a rain event to eliminate the effect of the soil
moisture on wind erosion. We also eliminate the obvious cases of advection of dust (i.e., high
dust concentrations during several hours without continuous high wind speeds). Finally,33861
and 17263 couples of 5-minute data (synchroneous wind speed and PM10 concentrations) were retained for Banizoumbou and Cinzana, respectively. This represents between 5 and 10% of the number of couples of data acquired during the wet seasons 2006-2015.
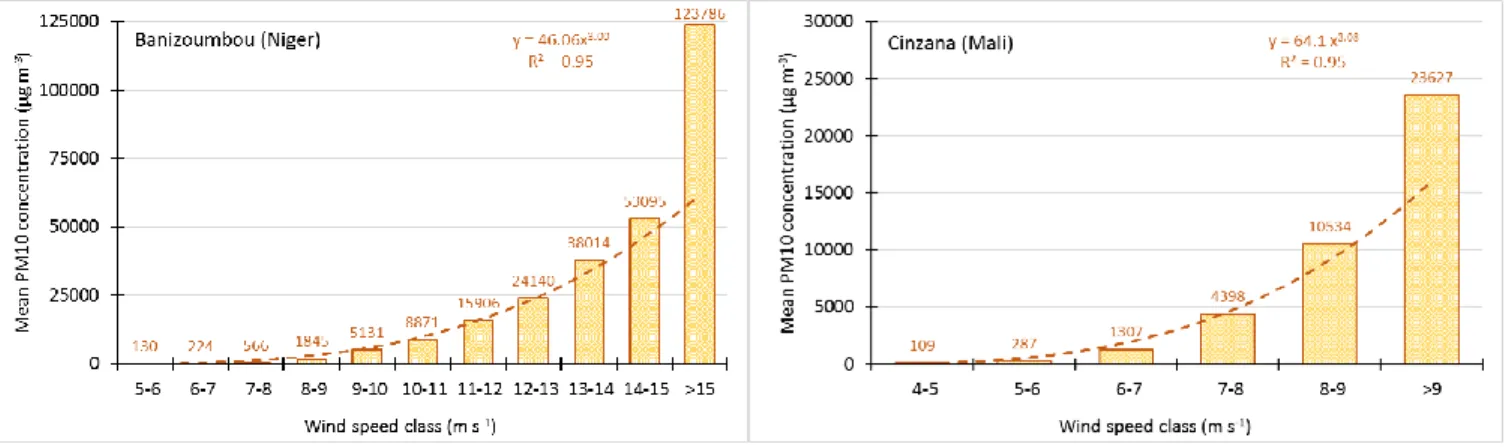
Thus, we assume that the selected PM10 concentrations are representative either of a background level (for the lower wind speeds) or of local dust emissions. This assumption is supported by the power-3 dependence of the average PM10 concentrations with wind speed for the selected data set (Figure S1).
3 Results
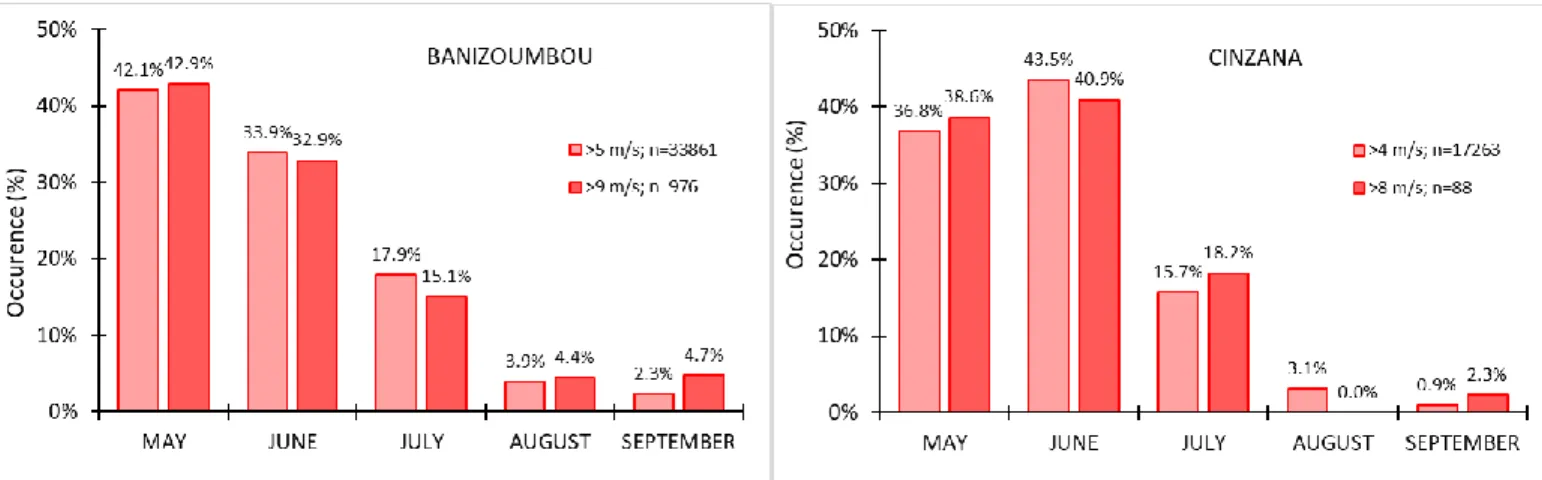
Figure 2 reports the monthly distributions of wind speeds for different wind speed limits for the period 1 May to 30 September and for the years 2006-2015. The frequency of wind speeds
higher than ≥5 m s-1 and 4 m s-1 in Banizoumbou and Cinzana, respectively represents the
frequency of potential dust emission while the distribution of the high wind speeds (HWS) (≥8 m
s-1 in Cinzana and ≥9 m s-1 in Banizoumbou) can be seen as a proxy of the most intense dust
emission. It should be noted that HWS represent only a small part of the wind speeds greater
than 5 m s-1 (about 3% in Banizoumbou) and 4 m s-1 (0.5% in Cinzana).
Figure 2. Distribution of the occurrence (%) over the rainy season (May to September) of wind
speeds higher than 5 m s-1 (light red) and 9 m s-1 (dark red) in Banizoumbou and higher than 4 m
s-1 (light red) and 8 m s-1 (dark red) in Cinzana. Wind speed are measured from 2006 to 2015.
Most of the wind speeds that are susceptible to generate dust emission occur in May and June with 80.3% in Cinzana and 76% in Banizoumbou. 94% and 82% of wind speeds in Cinzana and Banizoumbou, respectively are only of one or two meters above the TWS. Most of them (>62% in Cinzana, 54% in Banizoumbou) occur in the morning between 0600 and 1400 UTC and are directly linked to the breakdown of the NLLJ. The strong decrease in the occurrence of these wind speeds from May-June to August-September is in agreement with the observations performed by Lothon et al., (2008) in Niamey (Niger) or with those reported by Sterk (2003). They indicate that the percentage of occurrence of the NLLJ decreases continuously during the wet season, i.e., from 85% in April to 52% in October.
A decreasing trend in the occurrence of the HWS when progressing in the season is also observed. However, their diurnal patterns differ significantly from those of the wind speeds ≥ 4
m s-1 and 5 m s-1 since 81% and 62% of the HWS in Cinzana and Banizoumbou, respectively,
occurs between 1700 and 0500 UTC. These strong winds are, for most of them, produced at the leading edge of the cold-pool outflow generated by evaporating precipitation from convective systems (e.g;, Knippertz and Todd, 2012). This decrease in the occurrence of HWS is
progressive and leads to the fact that the contribution of August and September to the HWS occurrences over the wet season is very low.
These observations confirm that the occurrence of both the most frequent and the most intense high wind speeds decreases drastically when moving from the first stage of the wet season to the
core of the monsoon period suggesting that this decrease of the occurrence of the highest wind speed is the major phenomenon explaining the strong decrease of dust concentrations during the second part of the wet season (e.g., Marticorena et al., 2010).
3.2 The role of vegetation
Although the frequency of high wind speeds and their intensity decreases when progressing in the wet season, a non-negligible fraction of wind speeds able to generate dust emissions is recorded in July, August and September. At that time the vegetation has begun to grow addressing the question of its role in limiting wind erosion and dust emission. Thus we
compared the dust concentrations resulting from the data selection described in 2.2 for different NDVI and wind speed classes, starting in May (from an almost bare soil) to finish in September (with a well-developed vegetation).
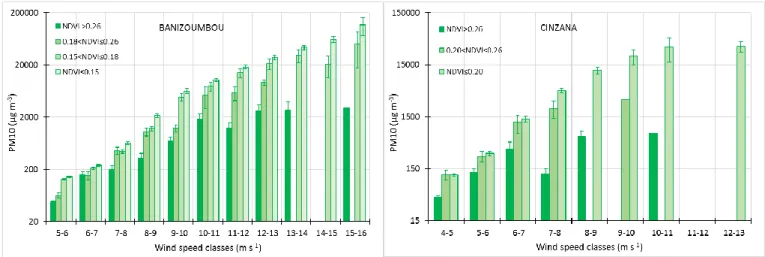
Because of the difference in the vegetation cover between Banizoumbou and Cinzana, we used slightly different NDVI classes for each site. The limits of these NDVI classes were defined based on the PM10 mean values computed, for a given wind speed class, for each NDVI value. Consecutive NDVI values for which the mean PM10 concentrations were the most similar were then included in the same NDVI class (Figure 3). The limits of the lowest NDVI class for Banizoumbou (0.15) and Cinzana (0.20) are close to the NDVI threshold value of 0.15 chosen by Kim et al. (2013; 2017) to separate the bare desert surfaces from the vegetated area in the Sahelian transition zone.
Both in Banizoumbou and Cinzana, the PM10 concentrations decrease progressively for a same wind class when the NDVIs increase (Figure 4). This strongly suggests that when the vegetation grows, its protective effect against wind erosion and dust emission increases. This effect is especially well-marked for the highest NDVI class (NDVIs>0.26) and for the wind speed classes
higher than 8 and 6 m s-1 in Banizoumbou and Cinzana, respectively (i.e. those for which wind
speed is always over the threshold for wind erosion). Note that in Cinzana almost no wind speed
higher than 10 m s-1 are recorded when the NDVIs are higher that 0.2.
Table 1 reports, in a more quantitative way, the percentage of decrease of the PM10
concentrations for the different NDVI and wind speed classes when normalized to the lowest NDVI class (i.e., an almost bare soil corresponding to NDVIs < 0.15 in Banizoumbou and NDVIs < 0.20 in Cinzana). The decrease in PM10 concentrations due to the vegetation cover is significant : from almost bare surfaces to the intermediate NDVI classes, PM10 concentrations are reduced by about 30% and the reduction can exceed 80% for the highest NDVI classes. These results, when integrated over the whole wet season, suggest that vegetation could reduce dust emission by 15% and 3% in Banizoumbou and Cinzana, respectively (see Text S2 for the detail of the computation)
Figure 3. Mean PM10 concentrations (µg m-3 in logarithmic scale) for different wind speed and NDVI classes in Banizoumbou (left panel) and Cinzana (right panel). The bars correspond to
+/-one error-type (/√(n)).
Table 1. Percentages of the PM10 decrease for different NDVI classes and for different wind
speed classes. The percentage of decrease is computed using the mean PM10 concentrations for NDVI <0.15 (for Banizoumbou) and <0.20 (for Cinzana) as the reference for each wind speed class. In green are reported the means for which the difference is statistically significant when we compared to the corresponding wind class for the NDVI class <0.15 in Banizoumbou and <0.20 in Cinzana (in blue). In brown, the means for which the number of data is too low to apply statistical tests (see Text S1).
4 Conclusion
BANIZOUMBOU Wind speed class
(m s-1 ) C (µg m -3 ) n C (µg m-3 ) n Decrease (%) C (µg m-3 ) n Decrease (%) C (µg m-3 ) n Decrease (%) 5-6 144 549 12803 129 249 4010 -10.4 63 272 1603 -56.3 47 100 983 -67.3 6-7 239 1025 6172 209 424 1654 -12.4 154 631 540 -35.5 158 382 250 -33.8 7-8 634 2017 2576 439 828 700 -30.7 460 1012 200 -27.5 199 352 106 -68.7 8-9 2156 5930 925 1218 1706 225 -43.5 1048 1688 87 -51.4 326 579 51 -84.9 9-10 6334 13512 327 4852 6490 72 -23.4 1231 1484 56 -80.6 702 857 35 -88.9 10-11 10387 10851 158 7786 8266 32 -25.0 5334 10222 18 -48.6 1821 2385 20 -82.5 11-12 18284 12429 90 14246 11271 16 -22.1 5898 4730 7 -67.7 1231 965 8 -93.3 12-13 27844 19675 51 21117 14971 10 -24.2 9278 1429 2 -66.7 2648 2028 6 -90.5 13-14 43479 19560 26 30795 19524 5 -29.2 0 2690 2287 3 -93.8 14-15 61911 26986 11 20771 16177 3 -66.5 0 0 15-16 117335 151371 11 51446 48275 2 -56.2 0 2997 - 1 -97.4 >16 284974 353340 3 74742 27923 3 -73.8 0 0 Mean -34.8 -54.3 -80.1 Standard Deviation 20.7 17.5 19.2 CINZANA Wind speed class
(m s-1 ) C (µg m -3 ) n C (µg m-3 ) n Decrease (%) C (µg m-3 ) n Decrease (%) 5-6 114 533 10596 116 885 1364 1.8 42 98 929 -63.2 6-7 296 1458 2979 259 905 232 -12.5 126 298 173 -57.4 7-8 1356 4329 648 1164 3030 44 -14.2 361 790 38 -73.4 8-9 4783 6539 154 2196 2363 9 -54.1 121 80 9 -97.5 9-10 11900 13208 54 0 626 245 2 -94.7 10-11 22061 33632 22 3211 - 1 -85.4 0 11-12 32932 39074 6 0 706 - 1 -97.9 12-13 0 0 0 13-14 33703 11167 2 0 0 Mean -32.9 -80.7 Standard Deviation 36.0 18.3 NDVI >0.26
NDVI≤0.20 0.20<NDVI≤0.26 NDVI >0.26
Results show that the highest wind speeds, both in frequency and in intensity, occur at the early stage of the monsoon period (May-June) and are responsible for most of the high dust
concentrations recorded during the Sahelian wet season. At that time, the new vegetation is not developed and does not play any role in controlling dust emission. During the second part of the wet season (August-September), the intensity and the frequency of wind speeds higher than the erosion threshold decrease. However, the remaining cases of dust emission are strongly affected by the presence of the vegetation since the PM10 concentrations are reduced (up to 80%) compared to the May-June PM10 concentrations measured for similar wind speeds.
The growth of the vegetation changes the proportion of bare soil during the wet season and absorbs a fraction of the wind energy, decreasing the shear stress acting on the surface and thus leading to an apparent increase of the TWS. These two effects certainly take part in the observed decrease in PM10 concentrations when NDVI increases but in different proportions depending on the land use. In the Sahel, when the natural vegetation grows, there are parts of the surface that remain bare, leading to patches (e.g., Hiernaux et al., 2009), without significant change of the TWS. At the begining of the rainy season, the growth of the herbaceaous vegetation decreases the percentage of bare surfaces in fallow and rangeland (Pierre et al., 2014). In the cultivated field most of the surfaces remains bare due to the repeated weeding all along the first part of the rainy season maintaining the surface highly erodible (e.g., Klaij & Hoogmoed, 1996). Then, after the first phenological stage of vegetation, when the millet begin to grow it tends to increase the TWS despite the vegetation cover remain low (Abdourhamane Touré et al., 2011). This suggests that the impact of growing vegetation on dust emission could vary in time and space in the Sahel according to land uses. We suspect that the progressive diminution of the fraction of bare soil should be the dominant factor at the beginning of the wet season and that the change in TWS could be more and more efficient when the vegetation, especially in the
cultivated fields, tends to reach its maximum.
Acknowledgments
Measurements in Banizoumbou and Cinzana are performed in the framework of the French National Observatory Services INDAAF that is supported since 2010 by the Observatoire des Sciences de l’Univers EFLUVE, the INSU/CNRS and the IRD.The treatment of the data was performed in the framework of the research programs CAVIARS supported by the French National Agency for Research (ANR-12-SENV-0007-01) and DustClim supported by the European Commission under the ERA4CS action – Joint Call on Researching and Advancing Climate Services Development, Grant Agreement no. 690462 – ERA4CS – H2020-SC5-2014-2015/H2020-SC5-2015-one-stage. The authors would like to thank the Institut d’Economie Rurale (IER) in Mali for hosting one of our stations and in particular Dr. Zoumana Kouyaté, Delegate of the Station de Recherche Agronomique de Cinzana (Mali) for the help in logistics and local management. This work has also strongly benefited from the administrative support of the representations of IRD in Niger and Mali, thanks to all of them. The MODIS MOD13Q1 products were retrieved from the NASA EOSDIS Land Processes Distributed Active Archive Center (LP DAAC), USGS/Earth Resources Observation and Science (EROS) Center, Sioux
Falls, South Dakota (https://lpdaac.usgs.gov/products/mod13q1v006).The wind speed and PM10
data are distributed at an hourly time resolution through the INDAAF website:
https://indaaf.obs-mip.fr/. The data used in this manuscript are available for download for research and educational
Laboratoire Interuniversitaire des Systèmes Atmosphériques. We also thank the two anonymous reviewers for their helpful comments.
References
Abdourhamane Touré, A., Rajot, J. L., Garba, Z., Marticorena, B., Petit, C., & Sebag, D. (2011), Impact of very low crop residues cover on wind erosion in the Sahel. Catena, 85(3), 205–214.
https://doi.org/10.1016/j.catena.2011.01.002
Abdourhamane Touré A., Tidjani, A.D., Rajot, J. L., Marticorena, B. Bergametti, G., Bouet, C. … Garba, Z. (2019), Dynamics of wind erosion and impact of vegetation cover and land-use in the Sahel: a case study on sandy dunes in south-east Niger. Catena, 177, 272-285.
https://doi.org/10.1016/j.catena.2019.02.011
Bergametti, G., Rajot, J. L., Pierre, C., Bouet, C, & Marticorena, B. (2016), How long does precipitation inhibit wind erosion in the Sahel? Geophysical Research Letters, 43, 6643–6649,
https://doi.org/10.1002/2016GL069324
Bergametti, G., Marticorena, B., Rajot, J. L., Chatenet, B., Féron, A., Gaimoz, C., … Zakou, A. (2017), Dust uplift potential in the central Sahel: An analysis based on 10 years of
meteorological measurements at high temporal resolution. Journal of Geophysical Research:
Atmospheres, 122, 12,433–12,448. https://doi.org/10.1002/2017JD027471
Bielders, C.L., Rajot, J. L., & Amadou, M. (2002). Tranport of soil and nutrients by wind in bush fallow land and traditionally managed cultivated fields in the Sahel. Geoderma, 109, 19–39.
https://doi.org/10.1016/S0016-7061(02)00138-6
Bouniol, D., Couvreux, F., Kamsu-Tamo, P. H., Leplay, M., Guichard, F., Favot, F., &
O’Connor, E. J. (2012), Diurnal and seasonal cycles of cloud occurrences, types, and radiative impact over West Africa. Journal of Applied Meteorology and Climatology, 51(3), 534–553.
https://doi.org/10.1175/JAMC-D-11-051.1
Didan, K. (2015), MOD13Q1 MODIS/Terra Vegetation Indices 16-Day L3 Global 250m SIN Grid V006 [Data set]. NASA EOSDIS Land Processes DAAC. Accessed 2020-05-29 from
https://doi.org/10.5067/MODIS/MOD13Q1.006
Fiedler, S., Schepanski, K., Heinold, B., Knippertz, P., & Tegen, I. (2013), Climatology of nocturnal low-level jets over North Africa and implications for modeling mineral dust emission. Journal of Geophysical Research: Atmospheres, 118, 6100–6121.
https://doi.org/10.1002/jgrd.50394
Heinold, B., Knippertz, P., Marsham, J. H., Fiedler, S., Dixon, N. S., Schepanski, K., Laurent, B., & Tegen, I. (2013), The role of deep convection and nocturnal low-level jets for dust emission in summertime West Africa: Estimates from convection permitting simulations. Journal of Geophysical Research: Atmosphere, 118, 4385–4400,
https://doi.org/10.1002/jgrd.50402
Hiernaux, P., Mougin, E., Diarra, L., Soumaguel, N., Lavenu, F., Tracol, Y., & Diawara, M. (2009), Sahelian rangeland response to changes in rainfall over two decades in the Gourma region, Mali. Journal of Hydrology, 375(1-2), 114-127.
Huber, S., & Fensholt, R. (2011), Analysis of teleconnections between AVHRR-based sea surface temperature and vegetation productivity in the semi-arid Sahel. Remote Sensing of the
Environment, 115, 3276–3285, https://doi.org/10.1016/j.rse.2011.07.011
Kaly, F., Marticorena, B., Chatenet, B., Rajot, J. L., Janicot, S., Niang, A.,…Ndiaye, T. (2015), Variability of mineral dust concentrations over West Africa monitored by the Sahelian Dust Transect. Atmospheric Research, 164-165, 226–241.
https://doi.org/10.1016/j.atmosres.2015.05.01
Kergoat, L., Guichard, F., Pierre, C., & Vassal, C. (2017), Influence of dry-season vegetation variability on Sahelian dust during 2002–2015, Geophysical Research Letters, 44, 5231–5239,
https://doi.org/10.1002/2016GL072317
Kim, D., Chin, M., Bian, H., Tan, Q., Brown, M., Zheng, T., You, R… Kucsera, T. (2013), The effect of the dynamic surface bareness on dust source function, emission, and distribution, Journal of Geophysical Research: Atmosphere, 118, 871e886.
https://doi.org/10.1029/2012JD017907
Kim, D., Chin, M., Remer, L. A., Diehl, T., Bian, H., Yu, H … Stockwell, W. R. (2017), Role of surface wind and vegetation cover in multi-decadal variations of dust emission in the Sahara and
Sahel. Atmospheric Environment, 148, 282–296. https://doi.org/10.1016/j.atmosenv.2016.10.051
Klaij, M. C., & Hoogmoed, W B. (1996), Weeding method and pre-sowing tillage effects on weed growth and pearl millet yield in a sandy soil of the West African Sahelian zone. Soil &
Tillage Research, 39, 31-43. https://doi.org/10.1016/S0167-1987(96)01049-5
Knippertz, P. (2008), Dust emissions in the west African heat trough: The role of the diurnal cycle and of extratropical disturbances. Meteorologische Zeitschrift, 17(5), 553–563.
https://doi.org/10.1127/0941-2948/2008/0315
Knippertz, P., & Todd, M. C. (2012), Mineral dust aerosols over the Sahara: meteorological controls on emission and transport and implications for modeling. Review of Geophysics, 50,
RG1007. http://dx.doi.org/10.1029/2011RG000362
Laing, A. G., & Fristch, J. M. (1993), Mesoscale convective complexes in Africa. Monthly Weather Review, 121(8), 2254–2263.
https://doi.org/10.1175/15200493(1993)121%3C2254:MCCIA%3E2.0.CO;2
Lothon, M., Said, F., Lohou, F., & Campistron, B. (2008), Observation of the diurnal cycle in the low troposphere of West Africa. Monthly Weather Review, 136(9), 3477–3500.
https://doi.org/10.1175/2008MWR2427.1
Marsham, J. H., Hobby, M., Allen, C. J. T., Banks, J. R., Bart, M., Brooks, B. J., … Washington, R. (2013), Meteorology and dust in the central Sahara: Observations from Fennec supersite-1 during the June 2011 intensive observation period. Journal of Geophysical Research:
Atmospheres, 118, 4069–4089. https://doi.org/10.1002/jgrd.50211
Marsham, J. H., Knippertz, P., Dixon, N. S., Parker, D. J., & Lister, G. M. S. (2011), The importance of the representation of deep convection for modeled dust-generating winds over West Africa during summer. Geophysical Research Letters, 38, L16803.
Marsham, J. H., Parker, D. J., Grams, C. M., Taylor, C. M., & Haywood, J. M. (2008), Uplift of Saharan dust south of the intertropical discontinuity. Journal of Geophysical Research, 113,
D21102. https://doi.org/10.1029/2008JD009844
Marticorena, B., Chatenet, B., Rajot, J. L., Traoré, S., Coulibaly, M., Diallo, A., … Zakou, A. (2010), Temporal variability of mineral dust concentrations over West Africa: Analyses of a pluriannual monitoring from the AMMA Sahelian Dust Transect. Atmospheric Chemistry and
Physics, 10(18), 8899–8915. https://doi.org/10.5194/acp-10-8899-2010
Mathon, V., Laurent, H., & Lebel, T. (2002), Mesoscale convective system rainfall in the Sahel.
Journal of Applied Meteorology, 41(11), 1081–1092.
https://doi.org/10.1175/1520-0450(2002)041%3C1081:MCSRIT%3E2.0.CO;2
Nesbitt, S. W., & Zipser, E. J. (2003), The diurnal cycle of rainfall and convective intensity according to three years of TRMM measurements. Journal of Climate, 16(10), 1456–1475.
https://doi.org/10.1175/1520-0442-16.10.1456
Parker, D., Burton, R., Diongue-Niang, A., Ellis, R., Felton, M., Taylor, C.,…Tompkins, A. (2005), The diurnal cycle of the West African monsoon circulation. Quarterly Journal of the
Royal Meteorological Society, 131(611), 2839–2860. https://doi.org/10.1256/qj.04.52
Pierre, C., Bergametti, G., Marticorena, B., Kergoat, L., Mougin, E., & Hiernaux, P. (2014), Comparing drag partition schemes over a herbaceous Sahelian rangeland, Journal of
Geophysical Research: Earth Surface, 119, 2291–2313, https://doi.org/10.1002/2014JF003177
Pierre, C., Kergoat, L., Bergametti, G., Mougin, E., Baron, C., Abdourhamane Touré, A… Delon C. (2015), Modeling vegetation and wind erosion from a millet field and from a rangeland: two
Sahelian case studies. Aeolian Research, 19, 97-111. https://doi.org/10.1016/j.aeolia.2015.09.009
Rajot, J. L. (2001), Windblown sediment mass budget of Sahelian village land units in Niger.
Bulletin de la Société Géologique de France, 5, 523–531. https://doi.org/10.2113/172.5.523
Rajot, J. L., Formenti, P., Alfaro, S., Desboeufs, K., Chevaillier, S., Chatenet, B.,…Zakou, A. (2008), AMMA dust experiment: An overview of measurements performed during the dry season special observation period (SOP0) at the Banizoumbou (Niger) supersite. Journal of Geophysical Research, 113, D00C14. https://doi.org/10.1029/2008JD009906
Roberts, A. J., & Knippertz, K. (2012), Haboobs: Convectively generated dust storms in West Africa. Weather, 67(12), 311–316. https://doi.org/10.1002/wea.1968
Shao, Y. (2008), Physics and modelling of wind erosion (2nd and revised ed. p. 452). Berlin:
Springer.
Sterk, G. (2003), Causes, consequences and control of wind erosion in Sahelian African. Land
Degradation & Development, 14(1), 95–108. https://doi.org/10.1002/ldr.526
Sterk, G. & Stein, A. (1997), Mapping windblown mass transport by modelling variability in space and time. Soil Science Society of America Journal, 61, 232–239.
https://doi.org/10.2136/sssaj1997.03615995006100010032x
Tucker, C., Pinzon, J., Brown, M., Slayback, D., Pak, E., Mahoney, R., … El Saleous, N. (2005), An extended AVHRR 8-km NDVI dataset compatible with MODIS and SPOT vegetation NDVI data. International Journal of Remote Sensing, 26, 4485–4498,
Williams, E., Nathou, N., Hicks, E., Pontikis, C., Russell, B., Miller, M., & Bartholomew, M. J. (2009), The electrification of dust-lofting gust fronts (‘haboobs’) in the Sahel. Atmospheric
Research, 91(2-4), 292–298. https://doi.org/10.1016/j.atmosres.2008.05.017
Supporting Information
Text S1: Statistical Treatment
The t-test for independent samples was used to determine if the PM10 mean concentration for a given wind speed class of the lowest NDVI class is significantly different from the PM10 mean concentration for the same wind speed class but for another NDVI class. We used t-test only when the number of observations was greater or equal to 30 for each wind speed class. We used two non-parametric tests (Wilcoxon-Mann-Whitney test and Kolmogorov-Smirnov test) when the number of observations for a wind speed class was between 6 and 29. We did not perform statistical test when the number of observations was lower than 6 for one of the wind speed classes. We classically fixedsignificance level as =0.05. The computations were made using XLSTAT®.
Text S2: Computation of the respective role of wind speed and vegetation in controlling dust emission
A rough computation was performed in order to estimate the respective role of wind speed and
vegetation in controlling dust emission. By assuming that the PM10 concentrations for the lowest NDVI class and for a given wind speed class correspond to the PM10 concentration level expected for this wind speed class before the vegetation begins to grow, one can roughly estimate the overall theoretical effect of the vegetation growth during the rainy season on the total "emitted" concentrations. For this, we first calculate the total concentration measured over the rainy season (= number of wind
occurrences multiplied by the average PM10 concentration of each wind class of each NDVI class). We then calculated the theoretical concentration that would have been produced if there was no
vegetation (= number of wind occurrences multiplied by the average PM10 concentration of each wind speed class of the lowest NDVI class). The difference between these two computations provides a rough estimate of the effect of vegetation during the whole rainy season. It is estimated to 15% for Banizoumbou and to 3% for Cinzana.
Figure S1. Mean PM10 concentrations (µg m-3) for different wind speed classes in Banizoumbou (left panel) and Cinzana (right panel)for the period May 1 to September 30 and for years 2006-2015.
Table S1. Recovery rates of the wind speed, rainfall and PM10 data in Banizoumbou (Niger) and Cinzana (Mali) for the period May 1 to September 30 and for years 2006-2015.