HAL Id: pastel-00688113
https://pastel.archives-ouvertes.fr/pastel-00688113
Submitted on 16 Apr 2012
HAL is a multi-disciplinary open access
archive for the deposit and dissemination of sci-entific research documents, whether they are pub-lished or not. The documents may come from teaching and research institutions in France or
L’archive ouverte pluridisciplinaire HAL, est destinée au dépôt et à la diffusion de documents scientifiques de niveau recherche, publiés ou non, émanant des établissements d’enseignement et de recherche français ou étrangers, des laboratoires
Multifunctional Rare Earth Vanadate Nanoparticles:
Luminescent Labels, Oxidant Sensors and Magnetic
Resonance Imaging Contrast Agents
Markus Schoeffel
To cite this version:
Markus Schoeffel. Multifunctional Rare Earth Vanadate Nanoparticles: Luminescent Labels, Oxidant Sensors and Magnetic Resonance Imaging Contrast Agents. Materials Science [cond-mat.mtrl-sci]. Ecole Polytechnique X, 2012. English. �pastel-00688113�
THESE
pr´
esent´
ee pour obtenir le grade de
DOCTEUR DE L’ECOLE POLYTECHNIQUE
Sp´
ecialit´
e : Physique
par
Markus SCH ¨
OFFEL
Multifunctional Rare Earth Vanadate
Nanoparticles: Luminescent Labels,
Oxidant Sensors and Magnetic
Resonance Imaging Contrast Agents
Soutenue publiquement le 22 mars 2012 devant le jury compos´
e de
Prof. St´
ephane PETOUD
CNRS Orl´
eans
Pr´
esident
Prof. Olivier TILLEMENT
Universit´
e Lyon 1
Rapporteur
Dr. Claire WILHELM
Universit´
e Paris 7
Rapporteur
Dr. Caroline ROBIC
Guerbet France
Examinateur
Dr. Thierry GACOIN
Ecole Polytechnique
Examinateur
Dr. Isabelle MAURIN
Ecole Polytechnique
Examinateur
There’s plenty of room at the bottom.
(Title of the talk given by Richard Feynman at the annual meeting of the American Physical Society on December 29th, 1959.)
Acknowledgments
I would like to express my deep and sincere gratitude to my supervisor Antigoni Alexandrou for hosting me in her group at the Laboratoire d’Optique et Biosciences (LOB) at the Ecole Polytechnique (EP). She gave me the possibility to work on the fascinating interface between physics, chemistry, and biology. I appreciated greatly the freedom she gave me during my research but also that she sometimes limited my ambitions spreading too large and brought me back to my subject. Her wide knowledge, encouraging and personal guidance have provided an excellent basis for the present PhD thesis. I wish to express my warm and sincere thanks to C´edric Bouzigues also from the LOB who co-supervised my thesis especially concerning the topics of biological applications of nanoparticles in general and hydrogen peroxide detection in particular. His comprehensive experience in this area allowed to design experiments properly and to solve encountered problems quickly.
I am deeply grateful to Isabelle Maurin from the Laboratoire de Physique de la
Mati`ere Condens´ee (LPMC) at the EP who always found the time to answer my
questions concerning X-ray diffraction and magnetism. Without her help, many of the results concerning the material characterization would not not have been obtained and many conclusions would not exist. The detailed and constructive comments after the proofreading of the manuscript were of great value for me. It is difficult to overstate my gratitude to Thierry Gacoin and Jean-Pierre Boilot from the LPMC for the unique opportunity to synthesize and characterize myself the materials in their laboratory and, more importantly, for the fact that I could benefit from pioneering and extensive know-how in the field. It was this collaboration that enabled me to combine applications of nanoparticles to biology with the conception and characterization of nanoparticles with expanded functionalities.
I do not want to miss the opportunity to express my gratefulness to the other members of the jury for their huge effort to evaluate this work. I want in particular thank Olivier Tillement and Claire Wilhelm who have accepted the labor intensive mission to be the reviewers of the manuscript. Their helpful comments have shown to me the enormous work they have accomplished and allowed to improve the manuscript. I am grateful to St´ephane Petoud for being the president of the jury and to Caroline Robic for her feedback from the point of view of a researcher in industry.
I am indebted to many colleagues who made contributions to this work. The study dealing with the influence of the nanoparticles on proton relaxation would not have been possible without the collaboration with Olivier Cl´ement, and the assistance by Laetitia Pidial and Gwennhael Autret from the Laboratoire de Recherche en
measurements on the clinical MRI system, for giving me access to the relaxometer as well as the fruitful discussions and helpful advice. I highly appreciated the introduction to the relaxation time measurement procedure given by Florence Gazeau from the Laboratoire Mati`ere et Syst`emes Complexes at the Universit´e Paris
7. Pierre Levitz from the LPMC found despite his tight schedule the time to perform
on his special equipment frequency-dependent measurements on proton relaxation. The obtained data were of great utility for the comprehension of the effects linked to Eu-doping. Fran¸cois Devreux also from the LPMC showed me how to carry out gas adsorption measurements. The results constituted an important element in the understanding of the morphology of the nanoparticles.
I would like to thank numerous former and current PhD students of the LPMC: Genevi`eve Mialon acquainted me with the field of colloidal nanoparticle synthesis. Charlotte Vichery helped me perform the measurements on the SQUID magnetome-ter and indicated to me the right conversions when I was lost between cgs and SI unit systems. Blaise Fleury always had a helpful solution if something went wrong with a synthesis. Am´elie Revaux introduced me to the experimental techniques necessary for my teaching subject.
I am grateful to the former PhD students of LOB Silvan T¨urkcan and Thanh Liˆem Nguyˆen. They familiarized me with the microscopy setup, explained to me the programs for data analysis and showed me how to culture cells and put nanoparticles inside without killing them all.
It was a pleasure to work with my kind and helpful colleagues at the LOB. I would like to especially thank my office colleagues Yannick Goulam Houssen, Thanh Liˆem Nguyˆen, Byung-Kuk Yoo, Silvan T¨urkcan, Ga¨el Latour and Rachid Rezgui for making these three years so enjoyable.
Contents
Abstract XIII
R´esum´e XV
Zusammenfassung XVII
List of Figures XXII
List of Tables XXIII
Introduction 1
Nanotechnology for biological imaging and therapy . . . 1
Rare earth vanadate nanoparticles . . . 2
Positioning of this work . . . 4
1 Synthesis and characterization of bulk rare earth vanadates 7 1.1 Synthesis of bulk gadolinium vanadate . . . 7
1.1.1 Solid state synthesis . . . 7
1.1.2 Synthesis by coprecipitation . . . 9
1.1.3 Experimental protocol . . . 10
1.1.3.1 Ceramic method . . . 10
1.1.3.2 Coprecipitation and thermal treatment . . . 10
1.1.4 Results and discussion . . . 11
1.2 Characterization by X-ray diffraction . . . 12
1.2.1 Crystal structure . . . 12
1.2.2 Experimental protocol . . . 13
1.2.3 Results and discussion . . . 13
1.2.3.1 Identity . . . 13
1.2.3.2 Purity . . . 14
1.2.3.3 Stoichiometry . . . 16
1.3 Characterization of the magnetic properties . . . 20
1.3.1 Paramagnetism . . . 20
1.3.2 Long range antiferromagnetic order . . . 21
1.3.3 Cooperative magnetic effects in GdVO4 . . . 22
1.3.4 Experimental protocol . . . 23
1.3.5 Results and discussion . . . 23
Contents
2 Synthesis and characterization of rare earth vanadate nanoparticles 27
2.1 Synthesis of nanoparticles . . . 27
2.1.1 Nanoparticle formation by coprecipitation . . . 27
2.1.2 Nanoparticle formation control by complexation . . . 29
2.1.3 Stabilization of colloids . . . 30
2.1.3.1 Van der Waals attraction . . . 30
2.1.3.2 Electrostatic repulsion . . . 30
2.1.3.3 Kinetic stabilization . . . 31
2.1.3.4 Steric repulsion . . . 32
2.1.4 Experimental protocol . . . 34
2.1.4.1 Reactant preparation . . . 34
2.1.4.2 Synthesis by normal route . . . 34
2.1.4.3 Citrate synthesis route . . . 35
2.1.4.4 Synthesis of core-shell nanoparticles . . . 35
2.1.4.5 Purification . . . 36
2.1.4.6 Size selection . . . 37
2.2 Surface modification of nanoparticles . . . 38
2.2.1 Silica coating . . . 38
2.2.2 Functionalization . . . 39
2.2.3 Experimental protocol . . . 41
2.2.3.1 Silica coating of the nanoparticles . . . 41
2.2.3.2 Functionalization . . . 42
2.2.3.3 Analysis of the surface modifications . . . 42
2.2.4 Results and discussion . . . 43
2.3 Vanadate concentration . . . 45 2.3.1 Quantification by UV absorption . . . 46 2.3.2 Colorimetric quantification . . . 47 2.3.3 Experimental protocol . . . 48 2.3.3.1 Reactant preparation . . . 48 2.3.3.2 Calibration graph . . . 49 2.3.3.3 Sample quantification . . . 49
2.3.3.4 Synthesis yield determination . . . 50
2.3.4 Results and discussion . . . 50
2.3.4.1 Molar extinction coefficient . . . 50
2.3.4.2 Error in vanadate quantification . . . 51
2.3.4.3 Influence of the rare earth . . . 52
2.3.4.4 Synthesis yield . . . 52
2.4 Stability . . . 54
2.4.1 Toxicology of nanoparticle decomposition products . . . 54
2.4.1.1 Rare earth ions . . . 54
2.4.1.2 Vanadate . . . 55
2.4.2 Colorimetric rare earth quantification . . . 57
2.4.3 Experimental protocol . . . 58
2.4.3.1 Preparation of xylenol orange solution . . . 58
2.4.3.2 Preparation of rare earth solutions . . . 58
Contents
2.4.3.4 Quantification of free rare earths in nanoparticle
dispersions . . . 59
2.4.4 Results and discussion . . . 59
2.4.4.1 Calibration equation . . . 59
2.4.4.2 Rare earth leaching from nanoparticles . . . 62
2.5 Particle size . . . 64
2.5.1 Experimental protocol . . . 64
2.5.2 Results and discussion . . . 64
2.5.3 Comparison to electron microscopy data . . . 66
2.6 Microstructural analysis of X-ray data . . . 68
2.6.1 Theoretical considerations . . . 68 2.6.1.1 Coherence length . . . 69 2.6.1.2 Williamson-Hall analysis . . . 69 2.6.1.3 Anisotropic broadening . . . 70 2.6.2 Experimental protocol . . . 72 2.6.2.1 Data acquisition . . . 72
2.6.2.2 Manual Williamson-Hall analysis . . . 72
2.6.2.3 Automated microstructural analysis . . . 72
2.6.3 Results and discussion . . . 73
2.6.3.1 Crystal structure . . . 73
2.6.3.2 Spherical crystallite model . . . 74
2.6.3.3 Non-spherical crystallite model . . . 75
2.7 Specific surface . . . 80
2.7.1 Experimental protocol . . . 80
2.7.2 Results and discussion . . . 81
2.8 Magnetic properties of Gd-containing nanoparticles . . . 83
2.8.1 Finite size effects in nanomaterials . . . 83
2.8.2 Experimental protocol . . . 84
2.8.3 Results and discussion . . . 84
2.9 Conclusion . . . 86
3 Rare earth vanadate nanoparticles as optical hydrogen peroxide sensor 89 3.1 Luminescence of rare earth vanadates . . . 89
3.1.1 Electronic structure of lanthanides . . . 89
3.1.2 Electronic excitations and energy levels . . . 90
3.1.3 Radiative transitions . . . 92
3.1.3.1 Free rare earth ions . . . 92
3.1.3.2 Rare earth ions in a crystal . . . 92
3.1.4 Non-radiative transitions . . . 94
3.1.4.1 Multiphonon relaxation . . . 95
3.1.4.2 Energy transfer . . . 95
3.1.5 Optical properties of Y1-xEuxVO4 materials . . . 96
3.1.6 Luminescence spectra and quantum yield . . . 99
3.1.6.1 Excitation- and emission spectra . . . 100
Contents
3.2 Hydrogen peroxide detection . . . 102
3.2.1 Hydrogen peroxide in living organisms . . . 102
3.2.1.1 Hydrogen peroxide as a cellular second messenger . . 102
3.2.1.2 Generation of hydrogen peroxide by NADPH oxidases103 3.2.1.3 Regulation of NADPH oxidases . . . 105
3.2.2 Hydrogen-peroxide mediated signaling pathways . . . 106
3.2.2.1 Switching on the signaling cascade . . . 106
3.2.2.2 Switching off the signaling cascade . . . 107
3.2.2.3 Hydrogen peroxide regulation of growth, prolifera-tion and apoptosis . . . 109
3.2.3 Techniques for the measurement of hydrogen peroxide . . . 110
3.2.3.1 Nonreversible molecular probes . . . 110
3.2.3.2 Reversible probes . . . 115
3.2.3.3 Europium-doped inorganic nanoparticles . . . 117
3.2.4 Experimental protocol . . . 120
3.2.4.1 Luminescence microscopy setup . . . 120
3.2.4.2 Sample preparation for nanoparticle observation . . . 120
3.2.4.3 Nanoparticle response to hydrogen peroxide . . . 122
3.2.4.4 Cell culture . . . 122
3.2.4.5 Loading cells with nanoparticles . . . 123
3.2.4.6 In vivo hydrogen peroxide monitoring . . . 124
3.2.4.7 Data analysis . . . 125
3.2.5 Results and discussion . . . 126
3.2.5.1 Kinetics of photoreduction and reoxidation . . . 126
3.2.5.2 Intracellular hydrogen peroxide production . . . 126
3.3 Conclusion . . . 129
4 Rare earth vanadate nanoparticles as multimodal contrast agent 133 4.1 Magnetic resonance imaging . . . 133
4.1.1 Magnetic relaxation . . . 134
4.1.2 Bloembergen-Purcell-Pound relaxation theory . . . 135
4.2 Contrast and contrast agents . . . 136
4.2.1 Contrast generating mechanisms . . . 136
4.2.1.1 Contrast from chemical shift . . . 137
4.2.1.2 T1 contrast . . . 137
4.2.1.3 T2 contrast . . . 138
4.2.1.4 Proton density contrast . . . 138
4.2.2 Contrast enhancing agents . . . 138
4.2.2.1 Mode of action . . . 138
4.2.2.2 Types and design . . . 139
4.2.3 Paramagnetic relaxation enhancement . . . 140
4.2.3.1 Inner-sphere relaxivity . . . 141
4.2.3.2 Outer-sphere relaxivity . . . 143
4.2.4 Clinically approved contrast agents . . . 143
4.2.4.1 Gd-containing positive contrast agents . . . 144
Contents
4.2.4.3 Negative contrast agents . . . 146
4.2.5 New positive, inorganic and nanostructured contrast agents . . 149
4.2.6 Nanoparticles as multimodal agents for imaging and therapy . 151 4.2.6.1 Coupling of MRI and optical imaging . . . 152
4.2.6.2 Coupling of MRI and positron emission tomography or single-photon emission computed tomography . . 153
4.2.6.3 Coupling of MRI and X-ray computed tomography . 154 4.2.6.4 Coupling of MRI and ultrasonography . . . 154
4.2.6.5 Coupling of MRI and chemotherapy . . . 155
4.2.6.6 Coupling of MRI and neutron-capture therapy . . . . 155
4.3 Materials and methods . . . 156
4.3.1 Sample preparation . . . 156
4.3.2 Measurement of relaxation times . . . 156
4.3.3 Relaxivity data analysis . . . 157
4.3.4 Nuclear magnetic resonance dispersion spectroscopy . . . 157
4.3.5 Response to hydrogen peroxide . . . 158
4.4 Results and discussion . . . 158
4.4.1 Relaxation times at 20 MHz . . . 158
4.4.2 Frequency-dependent relaxation times . . . 163
4.4.3 Luminescence . . . 165
4.4.4 Hydrogen peroxide detection . . . 166
4.5 Conclusion . . . 169
Summarizing discussion and outlook 171 A Theory of characterization methods 175 A.1 X-ray powder diffraction . . . 175
A.1.1 Bragg-Brentano parafocussing geometry . . . 175
A.1.2 Technical data of the X-ray diffractometer . . . 176
A.1.3 Calibration for instrumental aberrations . . . 177
A.1.4 Correction factor for sample eccentricity . . . 177
A.1.5 Profile shape function . . . 178
A.1.6 Determination of the instrumental resolution . . . 180
A.1.7 Material for resolution calibration . . . 181
A.1.8 Rietveld refinement . . . 182
A.1.9 Debye-Waller factor . . . 183
A.1.10 Algorithm for Rietveld refinement . . . 183
A.1.11 Agreement factors . . . 184
A.1.12 Crystal structure refinement of GdVO4 samples . . . 185
A.2 Magnetism and magnetometry . . . 186
A.2.1 Quantum numbers . . . 186
A.2.2 Paramagnetism . . . 187
A.2.3 Magnetic susceptibility . . . 189
A.3 Dynamic light scattering . . . 191
A.3.1 Scattering experiment . . . 191
Contents
A.3.3 Size averages . . . 193
A.4 Scanning electron microscopy . . . 195
A.4.1 General considerations . . . 195
A.4.2 Experimental protocol . . . 196
A.5 Gas adsorption . . . 197
A.5.1 Adsorption isotherms . . . 197
A.5.2 Brunauer-Emmett-Teller theory . . . 197
A.6 Luminescence spectroscopy . . . 199
A.6.1 Quantum yield . . . 199
A.6.2 Acquisition of luminescence spectra . . . 200
A.6.3 Quantum yield determination . . . 200
A.6.4 Instrument calibration . . . 201
A.7 Nuclear magnetic resonance . . . 202
A.7.1 Nuclear spin . . . 202
A.7.2 Interaction spin–magnetic field . . . 203
A.7.3 Macroscopic magnetization . . . 204
A.7.4 Resonant energy absorption . . . 205
A.7.5 Signal detection . . . 206
A.7.6 Pulse sequences . . . 206
A.7.7 Image formation . . . 208
B Crystallographic and magnetic properties of selected rare earth
com-pounds 211
Abstract
Multimodal imaging techniques are of great interest due to the wealth of information they provide. This thesis is devoted to the development and characterization of nanoparticles which can be applied as luminescent probes, for oxidant detection and as contrast agents in magnetic resonance imaging. The work is based on previous studies on Y0.6Eu0.4VO4 nanoparticles which show strong, non-blinking and stable
luminescence. Time and space resolved optical oxidant detection is feasible after reversible photoreduction of Eu3+ to Eu2+ and reoxidation by e. g. H2O2. This
oxidation is detectable by a modification of the luminescence properties.
The incorporation of paramagnetic Gd3+ confers proton relaxation enhancing
properties to the system. We synthesized nanoparticles of either 10 nm or 40 nm diameter and of the compositions GdVO4 and Gd0.6Eu0.4VO4 as well as
core-shell systems containing a Y0.6Eu0.4VO4 core and a GdVO4 shell with 40 nm
total diameter. X-ray microstructural analysis in combination with dynamic light scattering and electron microscopy enabled us to propose a model for the relationship between the shape of the nanoparticles and the crystallites contained in them. Complexometric titration indicated that rare earth leaching is negligible making this type of nanoparticles well suited for in vivo applications. We demonstrated that even after substitution of Y3+ by Gd3+, the nanoparticles retain the ability
of H2O2 detection by luminescence modulation. Temperature and magnetic field
dependent measurements of the magnetization of Gd0.6Eu0.4VO4 nanoparticles
confirmed the paramagnetic behavior according to a Curie-Weiss law in the temperature range from 290 K down to 5 K. We found that the proton relaxivity of GdVO4 and Gd0.6Eu0.4VO4 nanoparticles of 10 nm diameter as well as of the
core-shell nanoparticles is higher than that of the commercial chelate compound Dotarem®. Nuclear magnetic resonance dispersion spectroscopy showed higher proton relaxivities for nanoparticles made up from Gd0.6Eu0.4VO4 than from pure
GdVO4.
The present data suggest that rare earth vanadate nanoparticles containing simultaneously Gd and Eu are very promising candidates for applications as in vivo multifunctional probe. This system might also be useful as a target in gadolinium neutron capture therapy or for positron emission tomography.
R´
esum´
e
Les techniques d’imagerie multimodale peuvent apporter une grande richesse d’information. Cette th`ese est consacr´ee au d´eveloppement et `a la caract´erisation de nanoparticules qui peuvent ˆetre utilis´ees en tant que marqueurs luminescents, pour la d´etection d’oxydants et comme agents de contraste pour l’imagerie `a r´esonance magn´etique. Ces travaux sont bas´es sur des ´etudes pr´ec´edentes concernant des nanoparticules de composition Y0,6Eu0,4VO4, qui pr´esentent une forte luminescence
stable sans clignotement. La d´etection optique d’oxydants r´esolue temporellement et spatialement se base sur la photor´eduction r´eversible d’Eu3+ vers Eu2+ et la
r´eoxydation d’Eu2+ vers Eu3+ induite par exemple par H
2O2. Cette oxydation est
d´etectable suite `a une modification des propri´et´es de luminescence.
L’incorporation de Gd3+ paramagn´etique permet l’acc´el´eration de la relaxation
de l’aimantation des protons. Nous avons synth´etis´e des nanoparticules de 10 nm et 40 nm de diam`etre de composition GdVO4 et Gd0,6Eu0,4VO4, ainsi que des syst`emes
cœur-coquille contenant un cœur de Y0,6Eu0,4VO4 et une coquille de GdVO4 avec
un diam`etre total de 40 nm. L’analyse microstructurale par rayons X combin´ee avec la diffusion dynamique de la lumi`ere et la microscopie ´electronique `a balayage nous a permis de proposer un mod`ele liant la forme des nanoparticules `a celle des cristallites les composant. La titration complexom´etrique a indiqu´e que le taux de relargage de terres rares est n´egligeable, ce qui rend envisageable l’utilisation de nanoparticules de ce type pour des applications in vivo. Nous avons d´emontr´e que les nanoparticules conservent, mˆeme apr`es substitution de Y3+ par Gd3+, la
capacit´e de d´etecter H2O2 par une modification de leur luminescence. Des mesures
de l’aimantation des nanoparticules Gd0,6Eu0,4VO4 en fonction du champ et de la
temp´erature ont confirm´e leur comportement paramagn´etique conforme `a une loi de Curie-Weiss dans une gamme de temp´erature allant de 290 K `a 5 K. Nous avons trouv´e que la relaxivit´e par rapport aux protons induite par les nanoparticules GdVO4 et Gd0,6Eu0,4VO4 d’un diam`etre de 10 nm est plus importante que pour
le compos´e commercial ch´elat´e Dotarem®. Des mesures de dispersion de relaxation magn´etique nucl´eaire ont indiqu´e une relaxivit´e plus ´elev´ee pour les nanoparticules compos´ees de Gd0,6Eu0,4VO4 par rapport `a celles de GdVO4.
Les donn´ees actuelles indiquent que les nanoparticules de vanadate de terres rares contenant simultan´ement Gd et Eu sont des candidats prometteurs pour une application in vivo en tant que sonde multifonctionelle. Ce syst`eme pourrait ´egalement ˆetre utile comme cible pour la th´erapie par capture de neutrons utilisant les ions de gadolinium ou pour la tomographie par ´emission de positrons.
Zusammenfassung
Multimodale bildgebende Verfahren sind von hohem Interesse da sie einen großen Informationsreichtums zur Verf¨ugung stellen. Diese Doktorarbeit ist der Entwicklung und Charakterisierung von Nanopartikeln gewidmet, welche als lumineszierende Marker, zur Detektion von Oxidanzien und als Kontrastmittel f¨ur die Magnetre-sonanztomographie verwendet werden k¨onnen. Die Arbeit basiert auf vorherigen Studien bez¨uglich Y0,6Eu0,4VO4 Nanopartikeln, welche eine starke und stabile
Lumineszenz ohne Blinken zeigen. Diese erm¨oglichen eine zeitlich und r¨aumlich aufgel¨oste optische Detektion von Oxidanzien durch reversible Photoreduktion von Eu3+ zu Eu2+ und R¨uckoxidation von Eu2+ zu Eu3+ mit z. B. H
2O2. Diese Oxidation
kann aufgrund der Ver¨anderung der Lumineszeneeigenschaften detektiert werden. Das Einf¨ugen von paramagnetischem Gd3+ verleiht dem System
protonenrela-xationsverst¨arkende Eigenschaften. Wir synthetisierten Nanopartikel von entweder 10 nm oder 40 nm Durchmesser und mit den Zusammensetzungen GdVO4 und
Gd0,6Eu0,4VO4 wie auch Kern-Schale Systeme bestehend aus einem Y0,6Eu0,4VO4
Kern und einer GdVO4 Schale mit einem Gesamtdurchmesser von 40 nm.
Mi-krostrukturelle R¨ontgenanalyse zusammen mit dynamischer Lichtstreuung und Elektronenmikroskopie erlaubten es uns, ein Modell des Zusammenhanges zwischen der Form eines Nanopartikels und derjenigen der Kristallite, die es aufbauen, vorzu-schlagen. Eine komplexometrische Titration ergab, dass die Freisetzung von seltenen Erden vernachl¨assigbar ist und best¨atigte die Eignung dieses Types von Nanoparti-keln f¨ur in vivo Anwendungen. Wir zeigten dass selbst nach der Substitution von Y3+
durch Gd3+ die Eigenschaft der Nanopartikel, durch Lumineszenzmodulation H 2O2
zu Detektieren, erhalten bleibt. Temperatur- und magnetfeldabh¨angige Messungen der Magnetisierung von GdVO4 Nanopartikeln best¨atigten das paramagnetische
Verhalten gem¨aß eines Curie-Weiss Gesetzes im Temperaturbereich von 290 K bis zu 5 K. Wir stellten fest, dass die Protonenrelaxivit¨at von GdVO4 Nanopartikeln von
10 nm Durchmesser wie auch von Kern-Schale Nanopartikeln h¨oher ist, als die der kommerziellen Chelatverbindung Dotarem®. Die Spektroskopie der Dispersion der kernmagnetischen Resonanz zeigte h¨ohere Protonenrelaxivit¨aten f¨ur Nanopartikel aus Gd0,6Eu0,4VO4 verglichen mit solchen aus GdVO4.
Die vorliegenden Daten deuten darauf hin, dass Seltenerdvanadat-Nanopartikel, die gleichzeitig Gd und Eu enthalten, sehr aussichtsreiche Kandidaten als multi-funktionelle in vivo Sonden sind. Dieses System k¨onnte auch f¨ur die Gadolinium-Neutroneneinfangtherapie oder f¨ur die Positronenemissionstomographie n¨utzlich sein.
List of Figures
1.1 Photograph of bulk GdVO4 powder from different synthesis methods 11
1.2 Crystal structure of YVO4 . . . 12
1.3 Comparison of the diffraction pattern of GdVO4 from coprecipitation
with thermal treatment and from the ceramic method . . . 14 1.4 Comparison of the diffraction patterns of GdVO4 obtained by the
ceramic method with those of the precursor oxides . . . 16 1.5 Rietveld refinement of the X-ray diffraction data for GdVO4 samples
obtained by both synthesis pathways . . . 18 1.6 Susceptibility of an antiferromagnet . . . 22 1.7 Molar susceptibility of bulk GdVO4 as a function of the temperature 23
1.8 Magnetic moment of Gd3+ in bulk GdVO
4 as a function of the
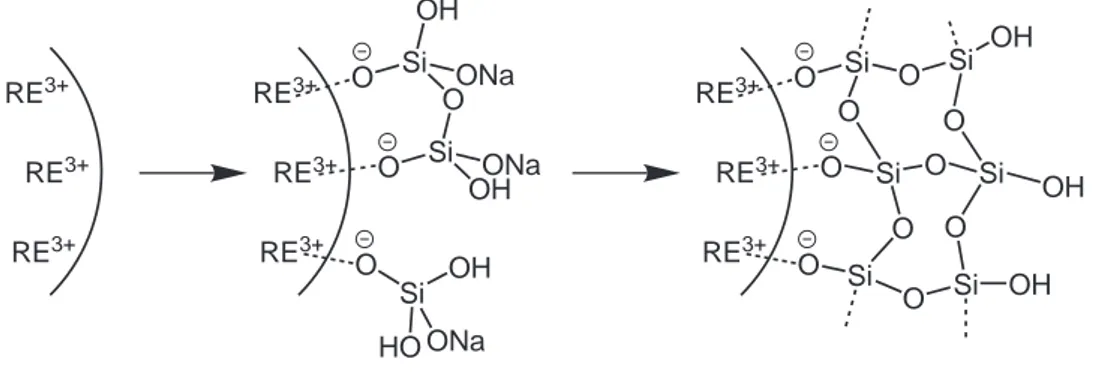
magnetic field . . . 25 2.1 Nucleation-growth models for the synthesis of uniform nanoparticles . 28 2.2 Structure formula of the citrate molecule . . . 29 2.3 Electric double layer on the surface of a nanoparticle . . . 31 2.4 Interplay between electrostatic repulsion and van der Waals attraction 32 2.5 Schematic view of steric repulsion between particles . . . 33 2.6 Interplay between steric repulsion and van der Waals attraction . . . 33 2.7 Hydrolysation and condensation of sodium metasilicate . . . 39 2.8 Silication of rare earth vanadate nanoparticles . . . 40 2.9 Structure formula of the APTES molecule . . . 40 2.10 Functionalization of silica coated rare earth vanadate nanoparticles . 41 2.11 Infrared spectra of pristine, silica coated and APTES functionalized
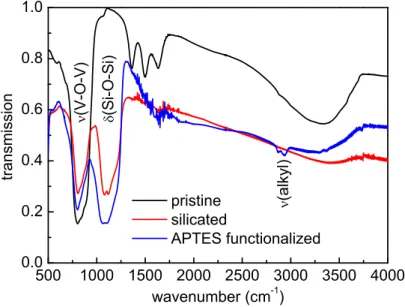
Y0.6Eu0.4VO4 nanoparticles . . . 43
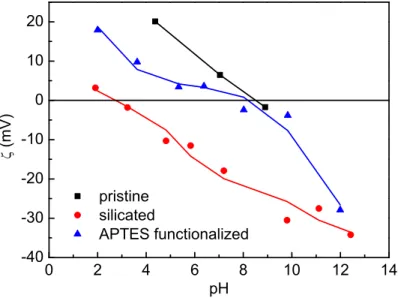
2.12 Zeta potential of pristine, silica coated and APTES functionalized Y0.6Eu0.4VO4 nanoparticles . . . 44
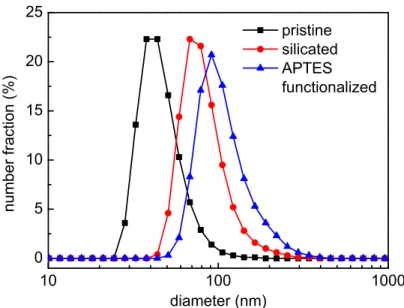
2.13 Number average size distribution of pristine, silica coated and APTES functionalized Y0.6Eu0.4VO4 nanoparticles . . . 45
2.14 UV-VIS spectrum of silica coated Y0.6Eu0.4VO4 nanoparticles . . . . 46
2.15 Hypothetical trigonal-bipyramidal structure of the monoperoxovana-dium(V) complex . . . 48 2.16 Absorbance of calibration samples for the colorimetric determination
of orthovanadate . . . 50 2.17 Calibration curve for the colorimetric determination of orthovanadate 51 2.18 X-ray structure of the Mg2+–ADP–orthovanadate complex in the
myosin ATPase domain . . . 56 2.19 Structure formula of the ADP–orthovanadate complex . . . 57
List of Figures
2.20 Structure formula of the xylenol orange molecule . . . 57
2.21 Absorbance of the xylenol orange – rare earth complex . . . 60
2.22 Calibration curve for the colorimetric determination of free rare earths 61 2.23 Temporal evolution of the absorption spectrum of xylenol orange due to rare earth leaching . . . 62
2.24 Temporal evolution of the free rare earth concentration . . . 63
2.25 SEM micrographs of silica coated GdVO4 nanoparticles . . . 67
2.26 X-ray diffraction patterns of bulk and nanoparticulate GdVO4 . . . . 73
2.27 Williamson-Hall plot for GdVO4 nanoparticles . . . 74
2.28 Coherence length for GdVO4 nanoparticles . . . 75
2.29 Microstructural analysis of the X-ray data for GdVO4 nanoparticles . 76 2.30 Reconstruction of the crystallite shape . . . 78
2.31 3D view of the crystallite shape . . . 79
2.32 Formation of nanoparticles from crystallites . . . 80
2.33 Nitrogen adsorption isotherm for silica coated GdVO4 nanoparticles . 81 2.34 BET analysis of the nitrogen adsorption data for silica coated GdVO4 nanoparticles . . . 82
2.35 Molar susceptibility of Gd0.6Eu0.4VO4cit nanoparticles as a function of the temperature . . . 84
2.36 Magnetic moment of Gd3+ in GdVO 4cit and in Gd0.6Eu0.4VO4cit nanoparticles as a function of the magnetic field . . . 85
3.1 Dieke energy level structure for trivalent rare earth ions in LaF3 . . . 93
3.2 Pathways of non-radiative RE3+ deexcitation . . . 94
3.3 Non-radiative transitions with energy trapping inside the crystal . . . 96
3.4 Excitation and emission spectra for bulk Y0.95Eu0.05VO4 . . . 97
3.5 Mechanism of Eu3+ luminescence in a rare earth vanadate matrix . . 98
3.6 Energy diagram of Eu3+ luminescence in a rare earth vanadate matrix 99 3.7 Luminescence excitation and emission spectrum for Y0.6Eu0.4VO4 nanoparticles . . . 100
3.8 H2O2 generation by NOX-type transmembrane enzymes . . . 104
3.9 Architecture of the active gp91phox/NOX2 complex . . . 105
3.10 The H2O2 cycle inside the cell . . . 107
3.11 Conformational change induced by intramolecular disulfide linkage . . 108
3.12 H2O2 mediated signaling pathways in endothelial cells . . . 109
3.13 Hydrogen peroxide detection using Amplex Red . . . 111
3.14 Hydrogen peroxide detection using dichloro-dihydrofluorescein . . . . 111
3.15 Hydrogen peroxide detection by deprotection of a fluorescein boronate derivative . . . 112
3.16 Hydrogen peroxide detection by deprotection of a coumarin boronate derivative . . . 112
3.17 Hydrogen peroxide detection by deprotection of a fluorescein sul-fonate derivative . . . 113
3.18 Hydrogen peroxide detection by photoinduced electron transfer . . . . 114
3.19 Hydrogen peroxide detection by emission wavelength shift . . . 114
List of Figures
3.21 Europium complex for reversible hydrogen peroxide detection . . . 115 3.22 Reversible hydrogen peroxide detection using HyPer . . . 116 3.23 Excitation and emission spectra of Y0.6Eu0.4VO4 nanoparticles before
and after photoreduction . . . 118 3.24 Cyclic photoreduction and reoxidation of a single Y0.6Eu0.4VO4
nanoparticle . . . 118 3.25 Concentration-dependent luminescence recovery of Y0.6Eu0.4VO4
nanopar-ticles . . . 119 3.26 Luminescence microscopy setup . . . 121 3.27 Luminescence of silica coated Y0.6Eu0.4VO4 nanoparticles detected
individually . . . 127 3.28 Luminescence of silica coated Y0.6Eu0.4VO4 nanoparticles in ensemble
detection . . . 128 3.29 White-light transmission image of a vascular smooth muscle cell . . . 129 3.30 Individually detected silica coated Y0.6Eu0.4VO4 nanoparticle as a
cellular hydrogen peroxide sensor . . . 130 4.1 Magnetic resonance and relaxation . . . 134 4.2 Rotational correlation times dependent relaxation times according to
the BPP theory . . . 136 4.3 Mode of action of a contrast agent . . . 139 4.4 Multiple contributions to the overall relaxivity . . . 140 4.5 Structure of clinically approved contrast agents based on a
tetraaza-cyclododecanetetraacetic acid ligand . . . 146 4.6 Structure of clinically approved contrast agents based on a
diethylen-etriaminepentaacetic acid ligand . . . 147 4.7 Structure of mangafodipir trisodium . . . 148 4.8 Relaxation times for Dotarem® . . . 159 4.9 Relaxation times for Gd0.6Eu0.4VO4cit nanoparticles . . . 160
4.10 Comparison of the NMRD profiles for several Gd-containing nanopar-ticles . . . 163 4.11 NMRD profiles for three clinically approved Gd3+ contrast agents . . 164
4.12 Luminescence emission spectrum for Gd0.6Eu0.4VO4 nanoparticles . . 165
4.13 Gd0.6Eu0.4VO4 nanoparticles as hydrogen peroxide sensors in
ensem-ble detection . . . 167 4.14 Y0.6Eu0.4VO4/GdVO4 core-shell nanoparticles as hydrogen peroxide
sensors in ensemble detection . . . 168 A.1 Bragg-Brentano parafocussing geometry . . . 175 A.2 Data acquisition in Bragg-Brentano geometry . . . 177 A.3 Displacement of the reflection positions of silicon . . . 178 A.4 Integral breadth of the Bragg peaks of calibration samples . . . 181 A.5 Comparison of the integral breadths of the Bragg peaks for silicon
and bulk GdVO4 . . . 182
A.6 Geometry of a scattering experiment . . . 192 A.7 Dependency of the average particle size on the weighting method . . . 194
List of Figures
A.8 Contrast through secondary electron emission . . . 195 A.9 Polymers used for surface coating for SEM observation . . . 196 A.10 Main types of gas physisorption isotherms, according to the IUPAC
classification . . . 198 A.11 Structure formula of rhodamine 6G hydrochloride . . . 199 A.12 Emission spectrum of rhodamine 6G . . . 201 A.13 Calibration curve for the quantum yield determination . . . 202 A.14 Zeeman splitting of the nuclear energy niveaus in a static magnetic
field . . . 204 A.15 Larmor precession of a nuclear spin in a static magnetic field . . . 205 A.16 Effect of an electromagnetic pulse on the magnetization vector . . . . 206 A.17 NMR signal detection . . . 207 A.18 Inversion recovery pulse sequence . . . 207 A.19 CPMG pulse sequence . . . 208 A.20 Transverse relaxation time measurement . . . 208 A.21 MRI scanner gradient magnets . . . 209 A.22 Pulse and gradient timing during image acquisition . . . 210
List of Tables
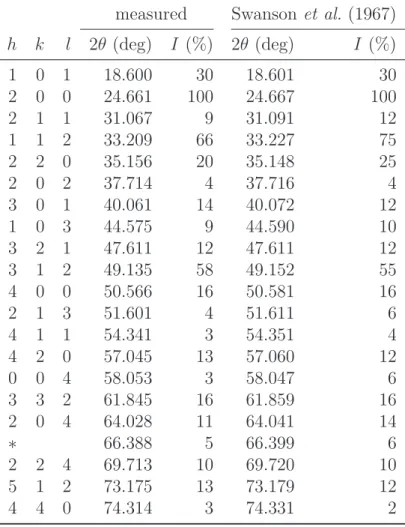
1.1 Peak positions and intensities for GdVO4 . . . 15
1.2 Sample stoichiometry derived from elemental analysis . . . 16 1.3 Parameters obtained from Rietveld refinement . . . 19 2.1 Molar extinction coefficients for aqueous solutions of
trichloromonoper-oxovanadium(V) in the presence of rare earth ions . . . 51 2.2 Yield of nanoparticle syntheses by the normal and citrate route . . . 53 2.3 Fit parameters for the quantification of free rare earth ions . . . 61 2.4 Nanoparticle sizes obtained from dynamic light scattering . . . 65 2.5 Nanoparticle size analysis . . . 67 2.6 Parameters obtained from the microstructural analysis . . . 77 3.1 Electronic configurations of rare earth ions used in this study . . . 90 3.2 Energy scales of different interactions encountered in solid rare earth
compounds . . . 91 3.3 Selection rules for transitions in lanthanide ions in a crystal . . . 94 3.4 Luminescence quantum yields for nanoparticle dispersions . . . 101 3.5 Characteristic data for cellular ROS species . . . 103 4.1 FDA approved Gd-containing contrast agents in the USA . . . 144 4.2 Approved Gd-containing contrast agents in the EU . . . 145 4.3 Physical constants of main contrast agents . . . 145 4.4 Approved negative contrast agents . . . 148 4.5 Physical constants of negative contrast agents . . . 149 4.6 New nanoparticulate positive contrast agents . . . 151 4.7 Imaging and therapeutic techniques and their targeting component . 152 4.8 Relaxivities for rare earth vanadate nanoparticles . . . 161 B.1 Crystal structure of selected REXO4 . . . 212
Introduction
Nanotechnology for biological imaging and therapy
Currently, nanotechnologies enjoy great popularity in many scientific domains. In particular, nanoobjects are of special interest for biological imaging and therapy. The use of nanoparticles allows to tailor a probe for the intended application and to incorporate the functionalities needed. Biological and medical imaging applications rely mainly on luminescence and magnetic resonance imaging so that a nanoparticle suited for such applications should possess convenient luminescence and magnetic properties. Chemo- and radiotherapy are widely used potent therapy methods for which nanoparticles can be used beneficially if they are able to carry a drug to a specific target or if they possess a radiosensitizing effect.
A large variety of luminescent nanoobjects for imaging has been proposed. Exogenously introduced organic fluorophores or endogenously genetically encoded fluorescent proteins are well documented but they suffer from rapid photobleaching (Goldys, 2009) and have therefore a limited application range for biological processes which have to be studied on long time scales in the minute to hour range. Semiconductor fluorescent nanocrystals have a high quantum yield and photostability but studies of biological molecules labeled with a single quantum dot may be hindered by the blinking of these particles (Michalet et al., 2005). Potential cytotoxicity and a complex surface modification chemistry constrain further their applications. Newer developments include luminescent nanodiamonds (Chang et al., 2008) or composites made up from inorganic nanoparticles conjugated to organic fluorophores (Burns et al., 2006). Rare earth doped nanoparticles exhibit interesting optical properties and low cytotoxicity that make them ideal candidates for biological luminophores (Bouzigues et al., 2011). Their promising photophysical properties include high photostability, no blinking, narrow emission lines, long lifetimes and simple surface functionalization procedures. They have additionally the potential to detect oxidants in a time- and space-resolved manner.
Another widely used imaging technique especially in the human body is magnetic resonance imaging (Westbrook and Kaut, 1998) where the different relaxation times of the protons in water depending on the environment are used to reconstruct an image. Contrast can significantly be increased and scanning times reduced when administering a contrast agent containing paramagnetic ions. Clinically approved contrast agents contain Gd3+ ions bound to an organic chelator so that liberation
of toxic Gd3+ ions is prevented. Incorporation of gadolinium ions in nanoparticles
would allow for high local concentrations, increased relaxivity values, long circulation times and negligible leaching rates.
List of Tables
complementary information can be obtained in the same time. Multimodal imaging and sensing can contribute to more efficient and less time-consuming medical examinations rendering possible the use of less xenobiotic substances and a cost reduction.
One of the major topics in chemotherapy is the toxicity of the administered drug (Perry, 2007). Targeting allows to reduce unwanted side effects on healthy parts of the organism and can deliver the active principle at a high concentration to the region or the organ to treat. For a target-oriented delivery of the active compound, the latter has to be conjugated with an addressing moiety (Hillery et al., 2001). Strategies often involve the packing of the active compound in a biodegradable polymer containing the address sequence. However, conjugation of drugs to nanoparticles which can be observed with the imaging techniques cited above adds the possibility to track the drug and to monitor the release process. Special forms of radiotherapy such as neutron capture therapy use the radiation produced by an internal target in the body (Alessio, 2011). Nanoparticles open up the possibility to combine imaging and therapy as the image-yielding compound and the target for the nuclear reaction may be incorporated in one and the same object.
Rare earth vanadate nanoparticles
Multifunctional rare earth vanadate nanoparticles can be used for biological imaging and therapy. Luminescent rare earth vanadate and phosphate nanoparticles have been developed in the Laboratoire de Physique de la Mati`ere Condens´ee (LPMC) at the Ecole Polytechnique and their properties have been studied thoroughly. Several applications including oxidant detection and single particle tracking have been demonstrated by the Laboratoire d’Optique et Biosciences (LOB). In the following, we will give a short chronological summary of the studies carried out at the LPMC and LOB laboratories and devoted to this type of nanomaterials in the two laboratories where this thesis work was performed:
• Huignard (2001) developed two aqueous synthesis protocols for the production of lanthanide-doped yttrium vanadate YVO4 nanoparticles of either 10 nm
or 40 nm diameter. Eu3+ doping of the matrix material yielded a strong
luminophore emitting in the red spectral region. It was shown that the synthesized nanoparticles can be functionalized by adding a silica layer onto their surface. Characteristic material parameters were reported and the optical properties as well as the mechanism of luminescence of Eu3+-doped YVO
4 were
studied in a comprehensive manner.
• Buissette (2004) adapted the colloidal synthesis protocol to produce rare earth phosphates. (La,Ce,Tb)PO4 nanoparticles of 5 nm diameter presenting green
luminescence emission were described. It was shown that the cerium ions can be protected from oxidation by growing a crystalline LaPO4 layer on the core
nanoparticles. These core-shell composites could further be covered with a silica layer for functionalization. The feasibility of white luminescence emission was demonstrated using mixtures of Eu3+-doped YVO
List of Tables
CePO4. The incoporation of these nanoparticles in silica yielded transparent
and luminescent layers.
• Giaume (2006) studied the method of surface functionalization by a two step process in which first a silica layer is added and then an organic layer. Conditions for different surface functionalization reactions were reported and detailed analysis of the obtained organic surface as well as its reactivity for coupling reactions were provided. The size and shape of nanoparticles with and without a silica layer was determined by electron microscopy with good statistics due to a large number of analyzed particles.
• Casanova (2008) analyzed the physics of the photoinduced bleaching process in Eu3+-doped YVO
4 nanoparticles. It was discovered that the photobleaching is
due to a reduction of the Eu3+ ions which is reversible upon adding an oxidant
like hydrogen peroxide. This finding opened the way for the application of such nanoparticles as an optical hydrogen peroxide sensor. The response of single nanoparticles to hydrogen peroxide was studied and the detection of endogenously produced hydrogen peroxide was shown in cells. Furthermore, tracking of nanoparticles coupled to the bacterial ǫ-toxin was demonstrated. • Mialon (2009) investigated the crystallinity of Eu3+-doped YVO
4
nanoparti-cles. It was shown that polycrystalline particles obtained from the colloidal synthesis can be treated thermally after their embedding in a solid silica matrix in order to avoid coalescence so that monocrystalline particles can be recovered. Optical properties before and after annealing as well as in different solvents and with changing Eu-doping levels were studied. An upconversion process in ytterbium- and erbium-codoped nanoparticles was described and analyzed.
• Nguyˆen (2009) used Eu3+-doped YVO
4 nanoparticles for the detection of
hydrogen peroxide with temporal resolution. The characterization of the luminescence response to different hydrogen peroxide concentrations allowed to calibrate the nanoparticles as a quantitative sensor. The hydrogen peroxide production in cells after stimulation of the latter with a signaling molecule was shown using internalized nanoparticles. The temporal resolution enabled the characterization of different signaling pathways and their interplay. The versatility of the nanoparticles for the elucidation of cellular signaling pathways was demonstrated.
• T¨urkcan (2010) employed Eu3+-doped YVO
4 nanoparticles as a luminescent
probe linked to peptidic pore-forming toxins. Single molecule tracking of the receptor-bound labeled toxins by luminescence microscopy allowed to investigate the receptor motion on the cell membrane. It was shown that the toxin receptors undergo confined diffusion in stable domains of the cell membrane. These domains were demonstrated to be lipid rafts. Introduction of receptor-bound nanoparticle-labeled toxins into a microfluidic channel enabled the application of a force to the receptor and to study its behavior under non-equilibrium conditions.
List of Tables
Positioning of this work
The aim of the present thesis was to further develop the system of rare earth vanadate nanoparticles so that it can accommodate additional functionalities. During this task, we could rely on the comprehensive knowledge concerning the synthesis and the luminescence properties of the system. A promising approach consisted in rendering the particles detectable for magnetic resonance imaging. Gd3+ ions are effective proton relaxation enhancing agents and due to the chemical
similarity of rare earths, the synthesis of gadolinium-containing rare earth vanadate nanoparticles was possible using the protocols developed previously. Various architectures of the nanoparticles are possible. The gadolinium ions may either be mixed with the europium ions so that the luminescent and relaxation enhancing properties are concentrated in one phase or the core-shell principle may be revisited so that a luminescent phase is combined with a relaxation enhancing phase. In both cases, it has to be verified if the luminescence properties and the ability to detect hydrogen peroxide are retained. The presence of gadolinium in the nanoparticles opens up simultaneously the possibility for therapeutic applications. These topics will be discussed in the manuscript as follows:
1. The present study is devoted to multifunctional nanoparticles, however, the first chapter will deal with the synthesis as well as the crystallographic and magnetic properties of bulk rare earth vanadates, in particular those of GdVO4.
The knowledge of the properties of the bulk material is crucial for several characterizations of the nanoparticles. We will discuss the advantages and drawbacks of two methods for the synthesis of the bulk material. The products were analyzed thoroughly and especially concerning the aspects of purity and stoichiometry. The magnetic character conferred to the compound by incorporation of Gd3+ ions was characterized to be able to assess later in the
manuscript the influence of the finite size of the nanoparticles on this property. 2. The second chapter deals with the synthesis and characterization of nanoparti-cles. We will review the basics of the colloidal chemistry process which allows the formation of nanoparticles of either about 10 nm or 40 nm diameter. The stability aspects of aqueous nanoparticle dispersions will be discussed and the possibility of nanoparticle coating with a silica layer which can also serve as a base for the functionalization with reactive organic groups will be presented. As the exact knowledge of the concentration of rare earth or vanadate ions contained in the particles is of crucial importance for their application in magnetic resonance imaging, special attention is paid to their quantification. Both free rare earth and vanadate ions are toxic to animals and humans, therefore the determination of the stability of the particles, in particular the ion leaching rates, is necessary. Perhaps the most important question when dealing with nanoobjects is their size and shape. We will therefore discuss the methods of dynamic light scattering and scanning electron microscopy which allow for determination of the size of a nanoobject. These techniques are complementary to the microstructural analysis of the X-ray diffraction pattern obtained for the nanoparticles. We will present the corresponding
List of Tables
analysis and make an attempt to provide a model in order to explain the relationship between one crystallite and one nanoparticle. This model will be completed by gas adsorption measurements aiming to determine the specific surface of the nanoparticles. The last section will be devoted to magnetic measurements on the nanoparticles.
3. We will start the third chapter with an overview of the luminescence properties of rare earth ions. The optical properties of Eu3+-doped YVO
4
materials follow and we will then discuss the results of the quantum yield determination on nanoparticles of various compositions. The next section will be devoted to the cellular role of hydrogen peroxide as a second messenger, its endogenous production and an overview of signaling pathways involving hydrogen peroxide. We will then review intracellular techniques for detection of hydrogen peroxide and put hereby the focus on the properties of Eu-doped rare earth nanoparticles. Finally, the results of in vitro measurements concerning the photoreduction and luminescence recovery of individual nanoparticles as well as of ensembles of nanoparticles will be discussed and data on in vivo detection of hydrogen peroxide will be presented. These data confirm previously obtained results and show the reproducibility of the oxidant detection properties for successive syntheses.
4. The fourth chapter will deal with the application of Gd-containing rare earth vanadate nanoparticles as contrast agents in magnetic resonance imaging. For this purpose, we will first review the relaxation mechanisms in nuclear magnetic resonance and discuss the parameters influencing them. Contrast and contrast enhancing mechanisms will be discussed and an overview of the currently clinically approved contrast agents will be given. We will furthermore present newer developments in contrast agent design which are mainly based on nanoparticles. A summary of the multimodal aspects of imaging will complete the theory part. We will then present and discuss the results concerning the relaxation times at fixed and variable magnetic field of various designs of rare earth vanadate nanoparticles. The last section will deal with the luminescence properties of Gd-containing rare earth vanadate nanoparticles as well as their response to hydrogen peroxide thus demonstrating the multifunctional properties of these nanoparticles.
Chapter 1
Synthesis and characterization of
bulk rare earth vanadates
The present chapter deals with bulk rare earth vanadate materials. Although the intended applications require that the material is used in form of nanoparticles, it is important to study thoroughly the properties of the bulk material before investigating additional finite size effects. The knowledge of parameters derived from the bulk material is of crucial importance for the characterization of the nanoparticles. We will start with the description of two different synthesis routes for the production of gadolinium vanadate. Comparative characterization of the two obtained samples allows the assessment of their quality. One synthesis protocol is simple and rapid but it is possible that it does not result in the needed quality while the other can produce a high quality compound but at the expense of a time-consuming procedure. As a pure and stoichiometric GdVO4 compound must be
guaranteed, we will pursue with a comprehensive characterization of the obtained products by X-ray diffraction. The last section of the chapter will be devoted to the study of the magnetic properties conferred to the material by incorporation of paramagnetic gadolinium ions. The obtained data will be compared in the next chapter to those obtained for the nanoparticles and will allow to determine the influence of the finite size on the magnetism.
1.1 Synthesis of bulk gadolinium vanadate
Synthesis of bulk rare earth vanadates and in particular of gadolinium vanadate may be performed by two different methods. The intended material can either be produced by a solid state synthesis at high temperature or by first employing the colloidal chemistry route for precipitating the material from soluble salt solutions in water and followed by a thermal treatment in order to increase the particle size.
1.1.1 Solid state synthesis
Inorganic solids are most commonly prepared by the ceramic method consisting of mixing and heating of solid precursors so that they react to form the desired compound (Smart and Moore, 2005). Generally, one takes stoichiometric amounts of the precursors, which are ground finely to the smallest particle size possible and then heated for several hours in a furnace. Applied to the particular case
Chapter 1 Synthesis and characterization of bulk rare earth vanadates
of gadolinium vanadate, the most facile reaction scheme is to produce GdVO4 as
the sum of gadolinium oxide Gd2O3 and vanadium pentoxide V2O5:
Gd2O3 + V2O5 −→ 2GdVO4
The ceramic method demands a high temperature, essential to provide the activation energy so that the highly coordinated ions can leave their lattice position and diffuse over long distances. Lower temperatures often render the reaction impossible or unreasonably slow. However, this high temperature may cause problems concerning the stability of the precursors or the product. In the general case, the ceramic method is a solid state synthesis and the reaction temperature does not reach the melting temperature of any of the precursors or products but is ideally about two-thirds of them. In our special case, this condition cannot be fulfilled due to the large difference in the melting temperatures of vanadium pentoxide and gadolinium oxide. V2O5 melts already at 681◦C (Lide, 2008) whereas Gd2O3 needs
to be heated to 2339◦C (Lide, 2008) for fusion. A temperature well below 700◦C
would extremely slow down the synthesis as the diffusion process is the time limiting step. Diffusion can be facilitated by small grain sizes and thorough mixing but a high temperature remains still necessary.
Working with vanadium pentoxide in the liquid phase may cause problems due to volatility and decomposition of this compound. Boussi`eres et al. (1958) reported that V2O5 has a non-negligible vapor pressure at high temperatures. They measured
a value of 12 hPa at 1200◦C meaning that prolonged heating at temperatures in
this range results in a loss of V2O5. Milan (1929) has measured the dissociation
pressure of vanadium pentoxide. At 1125◦C, they have determined an oxygen
partial pressure of 235 hPa and an amount of 4.7 mol % VO2 produced by reduction
of V2O5. The authors state that the decomposition is reversible as long as the
oxygen is not removed. However, the oxygen partial pressure in air is only 211 hPa and thus smaller than the partial pressure from the oxygen originating from V2O5
decomposition. A reaction in an open system results therefore in a net oxygen loss and production of VO2. We note that the resulting compound VO2 has a melting
point of 1967◦C (Lide, 2008) and that one reobtains the conditions of a real solid
state reaction upon reduction of V2O5 to VO2.
Unfortunately, the literature is ambiguous on the question if, and in the affirmative case how, stoichiometric GdVO4 can be prepared by the ceramic method.
Cook and Cashion (1979) reported that mixing stoichiometric amounts of Gd2O3
and V2O5 results after sintering in a product containing a few percent of unreacted
gadolinium oxide. Sage (2006) stated that an about 2 % excess of V2O5 is necessary
in order to compensate its volatility. On the other hand, Schwarz (1963) explained that problems due to evaporation and reduction of V2O5 can be circumvented when
controlling carefully the reaction conditions. They reported that a slow heating of the mixture between the rare earth oxide and V2O5 up to 950◦C over a period
of 4 h prevents fusion of V2O5 which has still not reacted. This behavior may be
interpreted by the initial formation of GdVO4 at the surface of V2O5 grains. As this
compound has a melting point of about 1800◦C (Higuchi et al., 2004), the vapor
1.1 Synthesis of bulk gadolinium vanadate
report that after this slow heating ramp, the end temperature can be increased to 1100◦C without the risk of oxygen loss. Also higher end temperatures have
been reported. Gaur and Lal (1983) prepared GdVO4 from Gd2O3 and V2O5 at
temperatures of about 1250◦C and using two firing cycles. However, they do not
state the heating ramp.
Based on these literature data, a thorough characterization of the obtained sample is required. The compound will be analyzed by X-ray diffraction in order to exclude any contamination. Possible impurity phases could involve unreacted Gd2O3 due to
a partial evaporation of the reaction partner V2O5 or the parasitic phase GdVO3
formed by reduction of GdVO4. It it also possible to obtain a non-stoichiometric
GdVO4 phase with vacancies on the vanadium and oxygen sites due to evaporation
and reduction of V2O5.
1.1.2 Synthesis by coprecipitation
Huignard et al. (2000) have studied the synthesis of Eu-doped yttrium vanadate nanoparticles at ambient temperature by coprecipitation from soluble yttrium and europium nitrate and sodium orthovanadate salts. Although we focus on bulk material in this chapter and not on nanoparticles, the general findings, with exception made to the conditions for size control, are transposable to the present case. The authors have shown that the reaction strongly depends on the pH and that yttrium orthovandate can only be obtained in a narrow pH range between 12.5 and 13.0. The reaction involves in a first step the precipitation of the kinetically favored hydroxide YxEu1−x(OH)3
(YxEu1−x)3++ 3OH−−→ YxEu1−x(OH)3 ↓
which, in a second step, reacts with orthovanadate to form thermodynamically stable YxEu1−xVO4
YxEu1−x(OH)3+ VO43− −→ YxEu1−xVO4 + 3OH−.
In very alkaline conditions with pH > 13, yttrium and europium hydroxides are precipitated and cannot react with orthovanadate. An acidic pH favors the formation of condensed vanadate species and the production of a rare earth orthovanadate is not feasible.
We note that Huignard (2001) has only investigated the properties of aqueous Y3+ and Eu3+ ions and not those of other trivalent rare earth solutions, but
Chang and Mao (2007) have also obtained Gd(OH)3 by a colloidal hydrothermal
method using a soluble Gd3+ salt and NaOH at pH 13. Holleman et al. (1995)
states generally that all rare earth hydroxides are not soluble in water and only soluble in acids. These data suggest that the synthesis conditions derived from Y3+
and Eu3+ solutions can also be applied to Gd3+.
For the synthesis of a bulk reference material, we are not interested in a well-defined particle size so that a careful control of the growth process is not necessary. The solution method has the advantage that it is carried out at ambient temperature and circumvents any possible problem linked to the high temperature
Chapter 1 Synthesis and characterization of bulk rare earth vanadates
solid state synthesis described in section 1.1.1. However, a drawback resides in the fact that one may obtain only little extended crystalline regions comprising defects due to the rapid precipitation of GdVO4 upon combination of the precursor
solutions. Mialon et al. (2008) have shown that the crystallinity of yttrium vanadate nanoparticles can be significantly increased by thermal treatment at temperatures of 900◦C and above. We can use a similar process for increasing the crystallite size in
a GdVO4 precipitate. This two step synthesis process starting with coprecipitation
followed by thermal treatment is more time consuming than the direct synthesis via the ceramic method but problems arising from the use of V2O5 are avoided.
1.1.3 Experimental protocol
1.1.3.1 Ceramic method
We synthesized bulk gadolinium vanadate GdVO4 by a high temperature solid state
synthesis based on the protocol presented by Gaur and Lal (1983) and using the heating rate given by Schwarz (1963). 0.03 mol (10.875 g) powdered Gd2O3 (purity
99.99 %, MW = 362.50 g/mol, Strem Chemicals) and 0.03 mol (5.456 g) powdered
V2O5 (spectrographically standardized, MW = 181.88 g/mol, Johnson Matthey) are
ground and mixed intimately in a agate mortar. The obtained powder is poured into an alumina crucible with alumina lid and placed in an oven. The thermal treatment cycle consists in a heating ramp at 4 K/min to 1250◦C and a subsequent plateau of
10 h. The oven is allowed to cool down to ambient temperature without temperature control. The obtained brown-grey powder is ground in the agate mortar and then placed again in the alumina crucible. A second thermal cycle is performed under identical conditions as the first one yielding a red-brown product. The reaction yield is determined based on the mass of the final powder product after grinding.
1.1.3.2 Coprecipitation and thermal treatment
Gadolinium vanadate GdVO4 bulk material is also prepared by coprecipitation from
solution. For this purpose, sodium orthovanadate Na3VO4 (purity 99.9 %, MW =
183.91 g/mol, Alfa Aesar) is dissolved in ultrapure water with a specific resitance of at least 18.2 MΩ · cm to a final concentration of 0.1 M. The pH of the solution is verifed using a pH meter and is adjusted if necessary to the range 12.5–13.0 by adding 1 M sodium hydroxide (Merck). The solution is then filtered through a 0.22 µm vacuum filter system (Corning) in order to remove nonsoluble impurities. Gd(NO3)3· 6H2O (purity 99.9 %, MW = 451.36 g/mol, Alfa Aesar) is dissolved in
ultrapure water to a final concentration of 0.1 M and is used as prepared. We note that GdCl3 can equally be employed under otherwise unchanged conditions.
A volume of 0.1 M Na3VO4 solution is placed in a recipient and stirred vigorously
at ambient temperature. The same volume of 0.1 M Gd(NO3)3 solution is poured
into the recipient and the stirring is maintained for 30 min. We note that the synthesis can also be performed using solutions with a concentration of 0.2 M in order to reduce the reaction volume.
1.1 Synthesis of bulk gadolinium vanadate
dispersion is spun at 26,323 g for 20 min. The supernatant is discarded and the precipitate recovered in a glass flask. Complete redispersion is achieved in about 80 mL ultrapure water under stirring for several hours. Plastic recipients should not be used as prolonged stirring may contaminate the nanoparticle dispersion with plastic particles difficult to remove. The initial suspension can be highly concentrated in this step by a factor of 10 to 20 facilitating and speeding up all further purification steps. The centrifugation-redispersion cycles are repeated 3 to 5 times depending on the concentration factor and until a conductivity of the dispersion below 100 µS/cm is reached. In the last centrifugation step, the precipitate is not redispersed but placed in a recipient and dried overnight at 100◦C.
The obtained product is ground to a fine white powder and the reaction yield is determined based on the mass of the final powder product after grinding.
The crystallite size in the GdVO4 powder is increased by thermal treatment. The
sample is placed in an alumina crucible and subjected to a temperature program consisting in a 2 h ramp to 900◦C and a 10 h step at this temperature. All annealing
reactions are conducted in an oxidizing air atmosphere.
1.1.4 Results and discussion
GdVO4 bulk material was produced by the ceramic method as well as by
coprecipitation and subsequent thermal treatment. Synthesis yields reached 95 % in the case of the ceramic method and about 75 % for the coprecipitation pathway. The yields of the coprecipitation reaction are generally lower and differ from one to another synthesis although the same protocol was employed. This finding can be explained by the fact that purification demands several centrifugation and redispersion steps with a slight loss of material during each step.
The visual comparison of the two thermally treated powders and the precursor from the precipitation reaction shows a significant difference in color (fig. 1.1). The powder obtained from room temperature coprecipitation is white to slightly
Figure 1.1: Photograph of bulk GdVO4powder from different synthesis methods. Samples were
obtained from coprecipitation at room temperature (left, sample MS20), from coprecipitation and subsequent thermal treatment at 900◦
C (middle, MS11) and from the ceramic method at 1250◦
C (right, MS8).
yellow. After thermal treatment at 900◦C, this powder darkens its color to become
Chapter 1 Synthesis and characterization of bulk rare earth vanadates
difference in the color can be explained by either a non-stoichiometry of the product of by a second parasitic phase. The following section will therefore be devoted to a X-ray study in order to elucidate further this question.
1.2 Characterization by X-ray diffraction
1.2.1 Crystal structure
Most of the phosphates, arsenates and vanadates as well as chromates of rare earths crystallize in the tetragonal zircon structure (Schwarz, 1963) having the space group I41/amd (no. 141, Hahn (2005)). This structure is in particular
found for YVO4 (fig. 1.2) and GdVO4. One unit cell contains four formula units
Figure 1.2: Crystal structure of YVO4. Atoms are drawn to 0.25 of their respective van-der-Waals
radius and sticks are 0.1 ˚A thick. Oxygen atoms are shown in red, vanadium atoms in grey and yttrium atoms in light blue. Left drawing: 3D view of the structure. Right drawing: Projection of the structure along the crystallographic c-axis visualizing the chains of [VO4] tetrahedra and [YO8]
distorted dodecahedra. Crystallographic data is from Broch (1933) deposited in the crystallographic information file (CIF) 1011156 on the Crystallography Open Database (Grazulis et al., 2009).
of YVO4. These are organized so that along the crystallographic c-axis, [VO4]
tetrahedra containing the vanadium atom in their center alternate with [YO8]
polyhedra made up from a central yttrium atom and oxygen atoms in their corners. The two types of polyhedra are interconnected by edge sharing resulting in isolated [VO4] tetrahedra. We note that the [YO8] polyhedra are distorted dodecahedra in
which the yttrium ion occupies a non-centrosymmetric crystallographic site with D2d symmetry. This distortion is due to the presence of two different sets of Y–O
bond lengths. While 4 Y–O bonds measure 2.30 ˚A, the 4 others are longer and measure 2.43 ˚A (Guillot-No¨el et al., 1998). This property is of crucial importance for the luminescence of Eu3+ ions introduced as dopants in the host structure and
1.2 Characterization by X-ray diffraction
occupying the crystallographic site of the Y3+ ion. We will discuss this topic in
section 3.1.
It is interesting to note that many rare earth vanadates show a low temperature Jahn-Teller distortion of their tetragonal structure to an orthorhombic geometry (tab. B.1). However, such a crystallographic transition has neither been found for YVO4 (Elliott et al., 1972) nor for GdVO4 (Cashion et al., 1969).
1.2.2 Experimental protocol
A comprehensive description of the X-ray diffraction technique as well as a detailed disucssion of the applied corrections is given in appendix section A.1. In brief, data acquisition is performed on a X-ray powder diffractometer in Bragg-Brentano geometry using Cu Kα radiation at a wavelength of λ = 1.5418 ˚A. A 2θ range
from 10◦ to 75◦ is used for routine measurements or up to 130◦ for measurements
employed in Rietveld refinement. A step width of 0.005◦ is defined for GdVO 4
samples and of 0.01◦ for the Gd
2O3 and V2O5 precursors. The integration time per
angular step is set to 100 s except for the GdVO4 sample from coprecipitation and
thermal treatment where a diffraction pattern with a high signal-to-noise ratio was acquired using an integration time of 500 s.
1.2.3 Results and discussion
1.2.3.1 Identity
We have recorded the X-ray powder diffraction patterns of bulk GdVO4 obtained
by the ceramic method and from coprecipitation and thermal treatment at 900◦C.
The results are shown for comparison in fig. 1.3. A perfect agreement of the two diffraction patterns is found indicating that both synthesis pathways were able to produce the same compound. A detailed analysis of the peak profiles (data not shown) confirmed that the peak widths are almost identical for the two samples. This finding signifies that a material with the same crystallite size may be obtained either by the ceramic method at 1250◦C or from coprecipitation and annealing at
900◦C. We can therefore compare in the following these two samples to verify if
the applied conditions during the synthesis of GdVO4 from Gd2O3 and V2O5 were
appropriate to avoid evaporation of V2O5 and the formation of a non-stoichiometric
compound as discussed in section 1.1.1.
The identity of the material can readily be assessed by comparing the X-ray diffraction pattern of GdVO4 obtained by coprecipitation and thermal treatment to
the peak list for GdVO4 reported by Swanson et al. (1967). Table 1.1 lists the
obtained peak positions and intensities together with those from the literature. The comparison shows generally a good agreement between the measured and the literature values although the difference is somewhat bigger for the (211), (112) and (220) peaks. This proves that the synthesized product is made up from GdVO4. The
material obtained from the ceramic method displays a likewise good agreement with the literature values (data not shown). However, as the visual comparison of the samples obtained by the two synthesis pathways (fig. 1.1) showed different colors,