HAL Id: insu-01876085
https://hal-insu.archives-ouvertes.fr/insu-01876085
Submitted on 18 Sep 2018
HAL is a multi-disciplinary open access
archive for the deposit and dissemination of
sci-entific research documents, whether they are
pub-lished or not. The documents may come from
teaching and research institutions in France or
abroad, or from public or private research centers.
L’archive ouverte pluridisciplinaire HAL, est
destinée au dépôt et à la diffusion de documents
scientifiques de niveau recherche, publiés ou non,
émanant des établissements d’enseignement et de
recherche français ou étrangers, des laboratoires
publics ou privés.
Nondilatant brittle deformation of serpentinites:
Implications for Mohr-Coulomb theory and the strength
of faults
J. Escartín, G. Hirth, B. Evans
To cite this version:
J. Escartín, G. Hirth, B. Evans. Nondilatant brittle deformation of serpentinites: Implications for
Mohr-Coulomb theory and the strength of faults. Journal of Geophysical Research, American
Geo-physical Union, 1997, 102 (B2), pp.2897-2913. �10.1029/96JB02792�. �insu-01876085�
JOURNAL OF GEOPHYSICAL RESEARCH, VOL. 102, NO. B2, PAGES 2897-2913, FEBRUARY 10, 1997
Nondilatant brittle deformation of serpentinites:
Implications for Mohr-Coulomb theory and the strength of faults
J. Escartin 1 and G. Hirth
Department of Geology and Geophysics, Woods Hole Oceanographic Institution, Woods Hole, Massachusetts B. Evans
Earth, Atmospheric and Planetary Sciences, Massachusetts Institute of Technology, Cambridge, Massachusetts
Abstract. We conducted
deformation
experiments
to investigate
the strength,
deformation
processes,
and nature of the brittle-ductile
transition
of lizarditc and antigorite
serpentinites.
A
transition
from localized
to distributed
deformation
occurs
as confining
pressure
increases
from
-200 to -•400 MPa at room temperature.
Deformation in both brittle (localized) and ductile
(distributed)
regimes
is accommodated
by shear
microcracks,
which form preferentially
parallel to
the (001) cleavage. Axial microcracks
(mode I) are infrequently
observed.
Volumetric strain
measurements
demonstrate
that brittle deformation
is mostly nondilatant,
consistent
with the
shear-dominated
microcracking.
Three observations
indicate
that deformation
in the ductile
regime is accommodated
by cataclastic
flow: (1) a lack of evidence
for crystal
plastic deformation,
(2) a positive
pressure
dependence
of the maximum differential
stress,
and (3) abundant
evidence
for brittle microcracking.
The weakness
of serpentinites
relative to other brittle rocks is explained
by a low fracture
strength
along the (001) cleavage,
combined
with the low pressure
dependence
of strength. The transition
from brittle to ductile deformation
occurs
at the crossover
between
the
strength
of intact serpentinite
and the friction law unique
to each type of serpentinite,
rather than
the more general
Byerlee's law. If brittle deformation
regimes
are defined
based
on the mode of
microcracking
and on the occurrence
of crystal
plasticity,
serpentinites
define an end-member
style of nondilatant
brittle deformation.
This deformation
style may result in extremely
weak
faults in nature,
and it may also strongly
influence
the tectonic
evolution
of the oceanic
lithosphere
where serpentinite
is present.
Introduction
Serpentine is probably the most abundant alteration phase in
ultramafic rocks from the oceanic lithosphere [e.g., Aumento and Loubat, 1971; Bonatti, 1976]. Such alteration products can influence the rheological properties of shear zones [e.g., Vernon, 1977; Brodie and Rutter, 1985; Mdvel and Cannat, 1992; Gillis et al., 1993]. However, rheological models [e.g., Chen and Molnar, 1983; Lin and Parmentier, 1989; Neumann and Forsyth, 1993] do not include these phases, owing partly to the scarcity of mechanical data, but also to a lack of information on their distribution and abundance. Instead, lithospheric strength is typically modeled using Byerlee's friction law and experimental plastic flow laws for unaltered quartzite, diabase, and olivine [e.g., Brace and Kohlstedt, 1980; Kohlstedt et al., 1995].
The importance of serpentine for the tectonics of the oceanic
lithosphere has been debated since at least the early 1960s when
Hess [1962] proposed that oceanic layer 3 is composed mostly of serpentinites. Peridotites dredged or drilled along slow spreading
mid-ocean ridges and fracture zones invariably show a high
•Now at Department of Geological Sciences, University of Durham,
South Road, Durham, England.
Copyright 1997 by the American Geophysical Union. Paper number 96JB02792.
0148-0227/97/96JB-02792509.00
degree of serpentinization [e.g., Aumento and Loubat, 1971;
Bonatti, 1976; Dick, 1989; Cannat et al., 1992], indicating that
hydration of peridotite occurs in very young (<1 Ma) oceanic lithosphere. In addition, studies on the Josephine ophiolite have documented oceanic serpentinization of the lithosphere at or near the ridge axis [Coulton et al., 1995]. Consequently, the tectonics of slow spreading mid-ocean ridges, fracture zones, subduction zones, and obducted ophiolites are likely affected by the presence
of serpentinites.
The serpentine group is composed of the polytypes lizardite, chrysotile, and antigorite. Lizardite, the most abundant serpentine mineral, occurs mainly in retrograde metamorphic assemblages [e.g., Moody, 1976; }Vicks and Whittaker, 1977] and is common along mid-ocean ridges [Aumento and Loubat, 1971 ]. Antigorite is the second most abundant polytype and the main component of prograde serpentinites [e.g., Coleman, 1971; }vicks
and }vhittaker, 1977]. Antigorite and lizardite are stable at
temperatures <400ø-500øC [Caruso and Chernosky, 1979; Janecky and Seyfried, 1986; Ulmer and Trommsdorff 1995] and lithospheric pressures. Chrysotile, the least abundant polytype, is stable below 300øC [Caruso and Chernosky, 1979; O'Hanley et al., 1989] and is a minor component of both prograde and retrograde serpentinites [}vicks and O'Hanley, 1988].
Previous experimental work shows that serpentinites are generally weaker than other common lithospheric rocks and that lizardite is weaker than antigorite. Raleigh and Paterson [1965, p. 3965] concluded that antigorite had an "... ultimate strength
2898 ESCARTIN ET AL.: NONDILATANT BRITTLE DEFORMATION OF SERPENTINITES
similar to that of granite at room temperature..." Unfortunately, this assertion has been generalized to all serpentinites, even though those experiments and subsequent work [Raleigh and Paterson, 1965;Murrell and Ismall, 1976] indicated that lizardite is considerably weaker than both antigorite and granite. The frictional strength of lizardite is also less than that of antigorite [Dengo and Logan, 1981; Reinen et al., 1994; Moore et al., 1995]; friction coefficients (p) of lizardite gouge vary between p=0.15-0.35 [Reinen et al., 1994] and p=0.4 [Moore et al., 1995] and increase to p=0.50-0.56 for polished surfaces [Dengo and
Logan, 1981]. The coefficient of friction is higher for both
antigorite gouge (p=0.5-0.85 [Reinen et al., 1994], p=0.47 [Moore et al., 1995]) and polished surfaces (u,=0.77 [Dengo and Logan, 1981]). Note that the lizardite used by Reinen et al. [1994] may have been mostly chrysotile instead of lizardite [Reinen and Tullis., 1995].
We conducted experiments on lizardite and antigorite to investigate the processes responsible for the transition from localized to distributed deformation and to determine why serpentinites are weaker than other lithospheric rocks. We
measured volumetric strain and correlated the mechanical data
with deformation microstructures. We observed a new style of mostly nondilatant brittle deformation. This style of deformation
may substantially weaken serpentinite-bearing faults and thus
control the mechanical evolution of the oceanic lithosphere where serpentinites are present.
Experimental Details
Samples
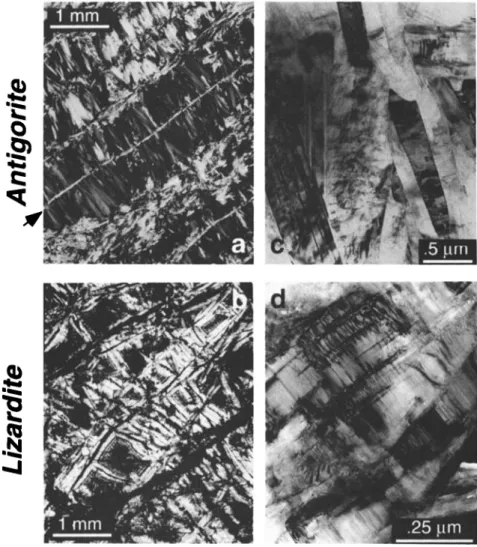
Antigorite serpentinite. We used an antigorite serpentinite
(VM3) that is ---90% antigorite, with less than 5% Fe oxides, and
minor amounts of magnesite along veins; this is the same material studied by Reinen et al. [1994]. The rock has a weak
macroscopic foliation; bands of elongated antigorite grains (<300
pm in length) with basal planes parallel to the overall foliation (bladed texture [Maltman, 1978]) alternate with veins that contain
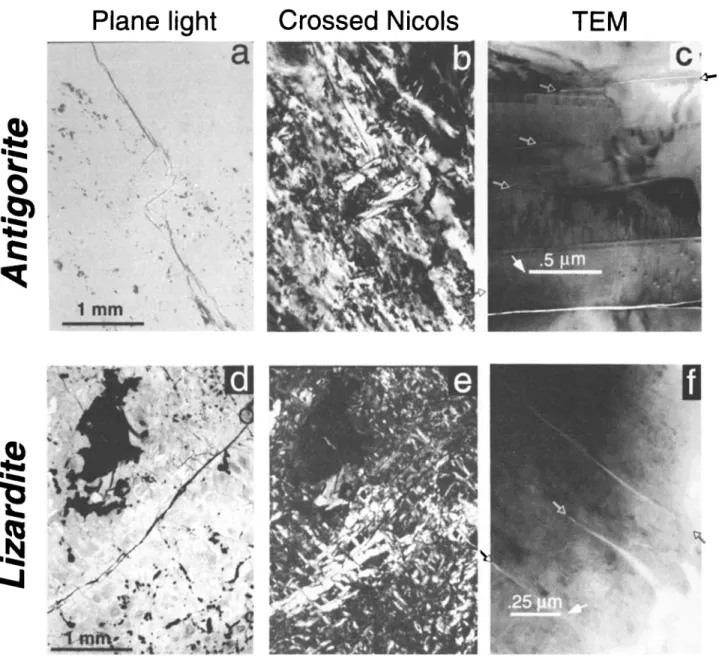
grains (<100 pm) oriented perpendicular to the foliation (Figure la). Zones with smaller (<50 pm), randomly oriented grains are sometimes present at the center of veins (Figure l a). The grains within the bladed zones and veins are primarily oriented parallel
Figure 1. Optical (crossed Nicols) and TEM micrographs (bright field) of undeformed (top) antigorite and (bottom) lizardite. The foliation in antigorite (marked by arrows in Figure l a) is defined by bands of grains oriented parallel and perpendicular (bladed bands and veins, respectively) to the overall foliation. Lizardite is characterized by a mesh texture that surrounds zones of micritic material (Figure lc). The TEM micrographs of both serpentine polytypes show elongated grains, closed grain boundaries, no preexisting open microcracks, and a
ESCARTIN ET AL.' NONDILATANT BRITTLE DEFORMATION OF SERPENTINITES 2899
a)
b)
20
10
Trace
of macroscopic
foliation
30 20 10
Veins
BladedII bands
o o ø 45 ø 90 ø 135 ø 180 øEntire sample
00 ø
45 ø
90 ø
135 ø
180 ø
Orientation (ø)
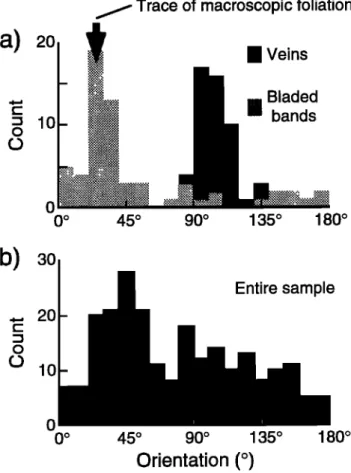
Figure 2. Lattice preferred orientation data for amigorite. (a) Histogram of the orientation of the trace of (001) from both the bladed bands (number of measurements n=65) and the veins (n=48) from a plane perpendicular to the foliation. The trace of the macroscopic foliation is shown by the black arrow. (b) A histogram of mineral orientations for the entire sample (n=129)
shows that the mineral fabric on the whole is relatively weak. The 0 ø orientation is arbitrary.
and perpendicular to the macroscopic foliation, respectively (Figure 2a). However, the lattice preferred orientation (LPO) of the entire sample is weak (Figure 2b). Scanning and transmission electron microscopy (SEM and TEM, respectively) show little pre-existing porosity, few open microcracks, and a large number of crystal defects (twins and dislocations, Figure lb). The density
of this material
(2690
kg/m
3) is slightly
higher
than
that
of pure
antigorite
(of 2600
kg/m
3) [Deer
et al., 1966].
Assuming
that
the
excess density is due to the presence of iron oxides (density 5000
kg/m3),
the oxides
would
comprise
3.4% of the sample
volume,
consistent with the modal abundance estimated from thin sections.
Lizardite serpentinite. Lizardite samples were cored from serpentinized oceanic peridotites dredged along the central Mid- Atlantic Ridge (samples AII60 9-10, AII60 9-75, and AII60-5 from the Woods Hole Oceanographic collection) and one of
unknown origin (X). All of these rocks are comprised of >80%
lizardite, minor amounts of chrysotile, and <10% magnetite and chlorite, as indicated by powder X ray diffraction patterns, optical microscopy, and TEM observations; traces of olivine, enstatite,
and other Fe oxides are also found. The microstructure of the
lizardite serpentinites is more complex than that of antigorite
serpentinites. Lizardite serpentinites have a "mesh texture"
matrix [Wicks et al., 1977; see O'Hanley, 1996, and references therein] surrounding lizardite pseudomorphs of pyroxenes called bastites [Wicks and Whittaker, 1977; Dungan, 1979], "amorphous" areas (grains <0.01 gm long), and zones with magnetite and other opaque minerals (Figure l c). The lizardite grains within the mesh-textured zones are <20 gm long. The grain size of lizardite is too small to determine the LPO using optical microscopy. At the TEM scale, the mesh-textured regions show no preexisting porosity or open microcracks and a high density of crystal defects (dislocations and uncharacterized planar defects, Figure 1 d). A small amount of porosity (<5%) is present in some of the amorphous zones. As these zones comprise <10% of the sample volume, we estimate that the porosity of the samples is <0.5%. The density of the lizardite serpentinite (2660
kg/m
3) is higher than that of pure lizardite
(2550 kg/m3),
requiring -• 4.5% vol of iron oxides to account for the excess
mass.
Westerly granite. Westerly granite was used to compare our volumetric strain measurements with data obtained previously using the same techniques [e.g., Brace et al., 1965]. The characteristics of the particular block of Westerly granite we used
are described elsewhere [e.g., Brace, 1965; Wong, 1982].
Methods
Gas confining medium apparatus. Experiments at confining pressures (Pc) less than 400 MPa were conducted using argon as a confining medium. Cylindrical samples 15.88 mm in diameter and 25.4 + 2.5 mm in length were jacketed in copper foil and sealed with copper end caps. The samples were then pressurized
to -•100 MPa, and then returned to ambient conditions, to seat the
jacket and to ensure a gas-tight seal. All experiments were conducted at room temperature, and at displacement rates that
correspond
to strain
rates
from
-•3.5
x 10
'4 to •3.8 x 10
'6 s
'l in
average, at a constant confining pressure. The load and displacement were externally measured and digitally recorded;the load is accurate to 0.3 MPa. Two electrical strain gauges were
mounted onto the collapsed copper jacket to measure axial and
radial strain. Volumetric strain was calculated using the
relationship:
•v = • + 2 x •r, where •v, •a, and •r are the
volumetric, axial, and radial engineering strain, respectively
(these and other symbols are summarized in the notation section). The calculated volumetric strain is accurate at strains <5% and/or prior to the localization of deformation on a discrete fault [e.g.,
Brace et al., 1966; Brace, 1978]; strain gauge measurements are precise to strains of 0.001% and accurate to -•0.02% due to
electronic noise. The small initial porosity (and therefore small
permeability) of both serpentine rocks makes measurement of
volume changes by variations in pore volume impractical [e.g.,
Brace, 1978].
Solid confining medium apparatus. Higher-pressure experiments (Pc>300 MPa) were conducted in a modified Griggs-type apparatus using lead as the confining medium. The runs were conducted at room temperature, confining pressures from 300 to 1000 MPa, and constant displacement rates
corresponding
to strain
rates
of-l.5 x 10
'5 and
-•1.5
x 10
'6 s 'l in
average. Axial load and displacement were measured externally;the load is accurate to -•50 MPa. Differential stress versus axial
strain curves were calculated assuming that the samples deformed homogeneously and that the volume remained constant. Cylindrical cores (6.3 mm in diameter, 10 to 14 mm long) were jacketed in a 0.25-mm-thick silver tube.
2900 ESCARTIN ET AL.: NONDILATANT BRITTLE DEFORMATION OF SERPENTINITES
materials and ground to obtain flat ends and parallel sides.
Samples of antigorite were cored at approximately 0 ø, 30 ø, 45 ø,
60 ø, and 90 ø to the weak foliation to investigate the effects of textural anisotropy.
Results of Deformation Experiments
The results of deformation experiments on antigorite, lizardite,
and Westerly granite are summarized in Tables 1 and 2.
Stress Versus Strain Curves
Stress-strain curves for antigorite illustrate a transition from unstable faulting or strain weakening to flow at a constant stress
with increasing pressure (Figures 3a and 3b). Unstable faulting
was observed at Pc=60 MPa, while strain weakening was
observed at Pc = 150 and 195 MPa. The jackets of these samples
showed that deformation localized on a single fault. At Pc =325 and 345 MPa the flow stress was constant (after an initial strain weakening in the first case); these samples showed a transitional style of deformation with the development of an -2-mm-wide shear zone composed of several anastomosing faults. Slight strain hardening was observed at Pc =725 and 1000 MPa; these samples deformed homogeneously.
The strength of lizardite is approximately half of that of
antigorite, although the macroscopic deformation behavior of both materials is similar (Figure 3). At Pc=200 MPa the stress-
strain curves show strain weakening associated with shear
localization on a fault; the run at Pc =50 MPa was stopped at the
Table 1. Summary of Experimental Conditions and Results
Run* Pc,
MPa e, x 10
4 S
-17
Oma x, MPa gy, MPa a, degAntigorite (VM3) a-1 200 34.63 335 317 30 a-2 0 0.35 155 no yield 30 a-3 200 3.77 662 584 30 a-4 195 3.46 713 561 30 a-5 200 3.46 704 577 30 a-6 200 3.46 778 650 30 a-7b 200 3.46 736 632 30 (a-8b) 200 3.46 656 603 30 (a-9) 60 3.46 382 n.m. 30 a-10c 200 3.46 335{} 328 30 a-16c 150 3.46 670 563 30 a-17d 345 3.46 952 724 30 (a-19) 205 3.46 895 814 90 (a-20) 206 3.46 913 734 60 (a-21d) 202 3.46 786 684 45 (a-22d) 208 3.46 688 578 30 a-23 325 1.50 1038 799 30 a-24 1000 1.50 1888 1341 30 a-25 725 1.50 1660 1112 30 a-28 725 i.50 1564 1126 30 a-29 725 1.50 1541 1233 30 (a-30) 200 3.46 809 566 0 a-32c 202 3.46 832 466 0 (a-33c) 201 3.46 838 687 0 a-36 0 3.46 304 n.m. 0 (a-37b) 200 3.46 656 590 45 (a-38b) 200 3.46 735 529 45 (a-57) 50 3.22 446 320 45 1-12 200 (1-14) 200 1-34 350 1-35 350 1-39 725 1-40 725 1-41 950 1-42 199 1-43 50 (1-44) 128 1-45 306 1-50 0 3.46 3.46 1 50 1 50 1 50 1 50 1 50 317 3.34 3.29 3.30 3.46 Lizardite (AII60 5) (1-46) (1-47) 1-51 1-52 1-53 (1-55d) 393 322 none 441 354 none 335 231 none 356 174 none 671 369 none 701 477 none 1141 571 none 368 217 none 252 186 none 326 176 none 398 247 none 50 n.m. none Lizardim (AII60 9-1• 200 3.13 413 211 none 201 3.21 375 334 none 300 1.50 491 339 none 700 1.50 712 491 none 840 1.50 871 462 none 200 3.16 406 367 none
Regime,
Apparatus
$
l,g a,g l,g l,g l,g l,g l,g l,g l,g l,g l,g l,g l,g l,g l,g d, s d, s d, s d,s d, s d, s l,g l,g l,g a, g l,g l,g l,g l,g l,g d, s d, s d, s d, s d, s l,g l,g l,g l,g a, g l,g l,g d, s d, s d, s d,gESCARTIN ET AL.: NONDILATANT BRITTLE DEFORMATION OF SERPENTINITES 2901
Table 1. (continued)
Run* Pc,
MPa •, x 10
'5
S
-1'•
lJmax,
MPa (Sy,
MPa ix,
deg Regime,
Apparatus
$
Lizardite (AII60 9-75) (1-48) 200 3.18 432 302 none l,g (1-49) 201 3.31 365 241 none l, g (1-54d) 200 3.26 427 324 none 1, g (1-58) 50 3.22 278 245 none l, g (1-59) 100 3.22 291 230 none l, g 1-60 5 3.26 137 n.m. none 1, g 1-61 400 3.25 537 270 none d, g 1-31 b 200 3.46 (g-18) 200 3.46 g-26 0 3.46 (g-27) 200 3.46 Lizardite (X) 441 384 none 1, g Westerly Granite 1096 638 none l, g 124 n.m. none a, g 1008 655 none l, g
Abbreviation n.m., not measured.
* Runs
for
which
volumetric
data
are
available
(Table
2) are
indicated
in parenthesis.
t The
bulk
of the
experiments
were
conducted
at e -• 10
-5
s
-1.
?Deformation
regime:
a, axial
splitting;
1,
localized
deformation;
d, distributed
deformation.
Apparatus: g, gas confining medium; s, solid confining medium.
õRun
10c
faulted
after
yielding
but
prior
to attaining
the
maximum
stress.
peak stress, prior to strain localization (Figure 3c). Steady state flow or slight strain hardening was observed at Pc >- 300 MPa (Figures 3c and 3d). Similar to our observations for antigorite, the jackets of samples deformed at 300 and 400 MPa revealed a
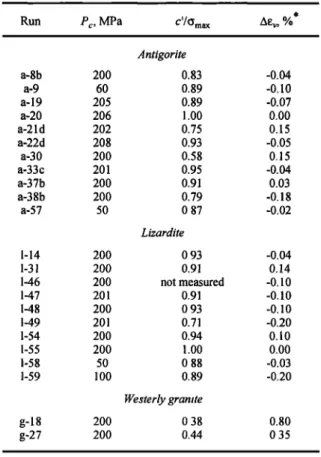
Table 2. Volumetric Strain Data
Run
Pc,
MPa
C'/lJma
x
Aœv,
%*
Antigorite a-8b 200 0.83 -0.04 a-9 60 0.89 -0.10 a-19 205 0.89 -0.07 a-20 206 1.00 0.00 a-21d 202 0.75 0.15 a-22d 208 0.93 -0.05 a-30 200 0.58 0.15 a-33c 201 0.95 -0.04 a-37b 200 0.91 0.03 a-38b 200 0.79 -0.18 a-57 50 0.87 -0.02 Lizardi• 1-14 200 0.93 -0.04 1-31 200 0.91 0.14 1-46 200 not measured -0.10 1-47 201 0.91 -0.10 1-48 200 0.93 -0.10 1-49 201 0.71 -0.20 1-54 200 0.94 0.10 1-55 200 1.00 0.00 1-58 50 0.88 -0.03 1-59 100 0.89 -0.20 Westerly granite g-18 200 0.38 0.80 g-27 200 0.44 0.35
*Difference
between
measured
and
extrapolated
elastic
volumetric strain at failure
transitional style of deformation, while those of samples
deformed at 700, 840, and 950 MPa showed no evidence for
strain localization.
The elastic portion of the stress-strain curves (i.e., Young's
modulus) is similar for experiments on antigorite conducted in both the gas and the solid medium apparatus (Figures 3a and 3b).
In contrast, the Young's modulus of lizardite displays some
variability; in Figure 3d the differential stress at 2% strain varies by ---200 MPa. The similarity of the Young's modulus observed for antigorite runs indicates that results from the two apparatus are comparable. Cyclic loading experiments on lizardite
demonstrate that deformation in the preyield portion of the stress- strain curves is elastic. Results from a cyclic loading experiment
are shown in Figure 3c. In run 1-54 the sample was successively loaded at Pc =200 MPa to differential stresses of 51, 82, 305 and 424 MPa; permanent strain was only observed after the sample was loaded to 305 MPa, past the yield point (i.e., deviation from an approximately linear loading curve).
Pressure Dependence
In both
serpentine
polytypes,
the yield stress
(cry)
and
the
maximum differential stress 0Jmax) depend positively onpressure, but the pressure dependence is somewhat lower for
lizardite than for antigorite (Figure 4). At a given pressure, the strength of antigorite lJma x varies by ---250 MPa, while that of lizardite varies by ---150 MPa (Figure 4b). Part of the scatter in
the strength of antigorite can be attributed to mechanical
anisotropy. As shown in Figure 5, the strength of antigorite depends on the angle between the macroscopic foliation and the shortening direction; for any given orientation the strength of
antigorite varies by---150 MPa.
The strength and the pressure dependence of strength are lower for both serpentinites (but most notably for lizardite) than for other rocks deformed in the brittle regime. This observation is illustrated by the Mohr envelopes shown in Figure 6a. These envelopes were calculated using the data listed in Table 1, data
2902 ESCARTIN ET AL.: NONDILATANT BRITTLE DEFORMATION OF SERPENTINITES 000 - a 800-
600-
400200
Antigorite
1000 - -- 345 MPa•
800
-
195
ß 600 -150
400
-
Stress
drop
(X
= 30"
•60
T .- 20"C
200
-
•
•• ~ 10-5
•S-1
i 0 2 4 6 0 Lizardite T- 20"C •,., 10-5 S-1 400 MPa/•00
I I 2ooo- b • 1500 - 13,. • 1000 - ! • 500_••1000
e'---•-
725
34•
325
_
•
(z
= 60
r
T-
•.., 10-5 S-1 I I I I 0 5 10 15 20(%)
2ooo d T~ 20øC • .., 10-5 S-1 1500 950ooo-I
soo
J
O• 4,00 ,
,
,
0 5 10 15 20(%)
Figure 3. Differential stress ((•] - (•3) versus axial strain (ea) curves for (left) antigorite and (right) lizardite as a
function of pressure. Figures 3a and 3c correspond to runs conducted in the gas rig at Pc < 400 MPa. Figures 3b
and 3d correspond to runs conducted in the solid-medium rig at Pc > 300 MPa; a run from the gas rig has also been plotted in both figures 3b and 3d for comparison (at Pc = 345 and Pc = 400 MPa, respectively). Both antigorite and
lizardite show a positive pressure dependence of the maximum stress. The elastic modulus of antigorite measured from runs in the solid- and gas-confining medium apparatus are the same. The variability in the elastic properties of lizardite is larger than for antigorite, even among runs conducted in the same apparatus. The run at 60 MPa in
Figure 3a showed a sudden drop (faulting). The triangle in Figure 3c indicates where confining pressure was
increased slightly to maintain Pc '• 400 MPa. Curves are shown for runs a-24 (1000 MPa), a-25 (725 MPa), a-23
(325 MPa), a-17d (345 MPa), a-4c (195 MPa), a-16c (150 MPa), and a-09 (60 MPa) for antigorite, and from runs 1- 41 (950), 1-53 (840 MPa), 1-52 (700 MPa), 1-61 (400 MPa), 1-51 (300 MPa), 1-54 (200 MPa), and 1-43 (50 MPa) for
lizardite; c• is the angle between the shortening direction and the foliation (see notation section).
for Westerly granite from Brace et al. [ 1965], and data for dunite
from Shimada et al. [1983]. All of the experiments were conducted at strain rates between 10 '6 and 10 '5 s '1. As the strain
rate dependence of the maximum stress in the brittle regime is small [e.g., Sano et al., 1981 ], the failure envelopes for each rock type can be compared directly. The lower strength of serpentinites can be attributed partly to their lower pressure dependence of strength. However, at high pressures the
coefficients of internal friction •t) of lizardite, antigorite, and
granite are similar (I. ti -• 0.35-0.45). Thus the differences in
strength at normal stresses (On) greater than 1000 MPa must be attributed to other properties of these rocks (e.g., cohesive strength).
The differences in strength and the pressure dependence of strength shown by the Mohr envelopes in Figure 6a may also be
correlated with observations made during frictional sliding
experiments on serpentinite at lower pressures [e.g., Dengo and Logan, 1981; Reinen et al., 1994; Moore et al., 1995]. While the
coefficient of friction (It) for antigorite is somewhat lower than
the value of g-• 0.85 predicted by "Byerlee's law" [Byerlee,
1978] at (•n < 200 MPa, lizardite is substantially
weaker
than
either
antigorite
or rocks
that follow Byerlee's
law (Figure
6b).
Volumetric Strain
Most crystalline rocks that undergo brittle deformation exhibit significant dilation associated with the opening of axial microcracks [e.g., Brace et al., 1966; Paterson, 1978]. However,
volumetric strain data indicate that brittle deformation of
serpentinites
is mostly
nondilatant.
Strain
gauges
were only used
on samples deformed in the gas apparatus (13 runs on antigorite,
12 runs on lizardite, and 2 runs on granite, Table 2). Minor
amounts of dilatancy (< 0.15% A•v) were only observed during 3 of 13 experiments on antigorite and 2 of 12 experiments on lizardite. In all other cases deformation resulted in either minor amounts of apparent compaction (< 0.2% Aev) or no resolvable permanent volume change (Table 2).
Both polytypes show a range of mechanical behavior involving small amounts of apparent dilation, compaction, or no
ESCARTIN ET AL.' NONDILATANT BRITTLE DEFORMATION OF SERPENTINITES 2903
a)
1500 - 1000 500 ßi .•..
. I ....
I ....
I ....
I ß
0 250 500 750 10001000
-
Ormax
•iiiiiili•iiii!!•ii•!:!:• ... ..::iiiiii .......
•*•¾'•iii!i•i•!•i•i•i•i•i•i!i!•'•i'
400 200 , 9O - Pc = 200 MPa -::i:::•i::- T • 20øC • = 3 x 10⁻⁵S -1 0 30(z(¸)
b)
•
BL
2000
.•
O
Figure
5. Mechanical
anisotropy
resulting
from
the
•,
• •
macroscopic
foliation
in antigorite.
Both
the
peak
(Omax,
denoted
03 1500 t ß Localized
Ct
0 •' Distributed
as
solid
circles)
and
yield
stress
(o'y,
open
circles)
depend
on
the
•
fi,
inclination
of the
foliation
(see
inset).
Both
Oma
x and
oy..
are
• 1000
•
(5
•(53 lowest
at ct = 45. The
variability
in strength
at any
given
•
- - - •
- - - • _
orientation
is
-•150
MPa.
o
a) 1500-
0 250 500 750 1000C)
BL
Lizardite
J
•.:•0
'5
500 .. --•.'.-•,•;..--;.-:.• ... •'•:" '•,.---•>'• p,=O. 3-/
ß
...
• / •••' ß Localized 0 250 500Po (MPa)
•isure 4. (a) The yield stress
o• and (b) maximum
stress
o•,x i• both anti8orite and lizardite show positive pressure dependence for P• up to 1 G•a. Lizardite is approximately a
factor of 2 weaker than anti8orite and shows a smaller pressure
dependence of stre•Stb. The 8ray li•e i• FiSures 4a and 4b corresponds to Goetze's criterio• (o]- os = os). (c) The
transitio• from localized to distributed deformatio• is ofie•
observed wbe• the stre•Stb of a material becomes less than Byerlee's frictio• law. •owe•er, the results i• lizardite J•dicate that this criterio• should i•co•orate the frictio• law deri•ed for each rock type i•stead of Byedee's law (li•e labeled BL i• FiSures 4b and 4c). Upper and lower limits of the frictio• law of lizardite correspond to p = 0.3 [Rei•e• ez •L, 1994] and p = 0.5 [De•o •d Lo•, 1 ½81 ] for lizardite selective Souses and bare surfaces, respectively. 1250 - 1000- 750 - 500 - 250 - 0
permanent
volume change
(Figure 7). For antigorite,
three
examples are shown in Figure 7a, one that resulted in dilation,
another in compaction (both at Pc=200 MPa) and a third that showed no resolvable permanent volume change (Pc =50 MPa). Lizardite exhibits similar variability in volumetric strain behavior
/
Lizardite
•0.43
• Antigorite ,, ••
Granite
* •3'1'•
•
0.34
• • Dunite • •.••
_•
u.,•
0.8 . _•. ._,•j'-..:•:
•..• ?( i i i i i i 0 500 1000 1500 2000 2500 3000 (DOb) 200-g=
150 100 5O/BL
/x
,•,• Lizardite
•
t O
Antigorite
i 0 100 200 300 400O
n (MPa)
Figure 6. (a) Mohr envelopes and (b) friction data for lizardite and antigorite deformed at room temperature. Figure 6a shows a comparison of Mohr envelopes for antigorite and lizardite serpentinite compared to Mohr envelopes derived from data on granite [Brace et al., 1966] and dunite [Shirnada et al., 1983].
The coefficient
of internal
friction
p/is given
by the slope
of the
Mohr envelope. Figure 6b shows friction data from experiments on bare polished surfaces (open symbols [Dengo and Logan,1981]) and fault gouge (solid symbols [Reinen et al., 1994]) of antigorite and lizardite serpentinites. For comparison, Byedee's law (BL) and a friction law for serpentinite with p=0.35, corresponding to the coefficient of internal friction shown in Figure 6a, are also plotted.
2904 ESCARTIN ET AL.' NONDILATANT BRITTLE DEFORMATION OF SERPENTINITES
- Antigorite
800 -600
-
400
200
0 200 MPa. e.
200 MPa
:
.
s.'
50MPa
• i ) / '\ t /
•
0 0 0 0b ' œizrdite
600
200
MPa
200
MPa
400 50
MPa
ß .,/•"' .... ß
200
'
0
o
o
(%) o
o
c x 0.8- t::} o.4- ! I::) o.2- . 0.0 -0.2 0.0 0.2 0.4d
a-3 1-31
I•. 400-
300 - t::> 200- -C' q" • lOO - + • o(%)
•• ' Z
ß Antigor/toizardite
(%)
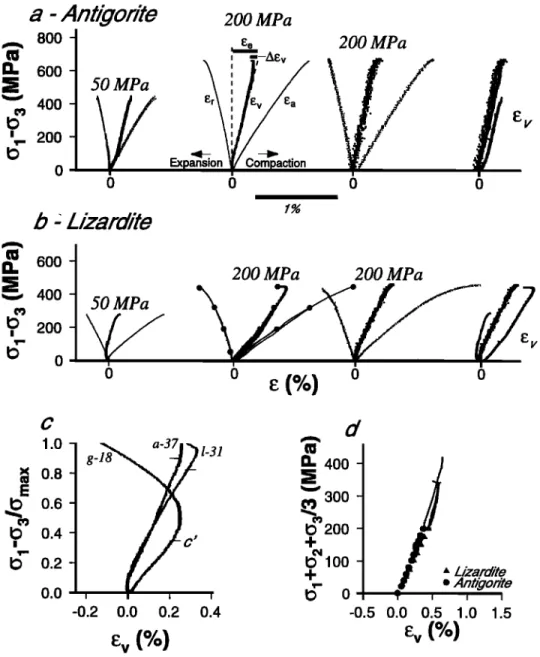
Figure 7. Stress versus volumetric strain curves. (a) Curves for experiments on antigorite. The finer connected
dots correspond to axial (%, positive) and radial strains (er, negative), and the bold dots are the calculated
volumetric strains (ev = ea + 2 x er). The deviation from the linear trend of ev corresponds to the onset of dilatancy
or compaction (c). The magnitude of dilatancy or compaction (Aev) is the difference between the observed volumetric strain and the elastic strain ee extrapolated along a line to lJma x. To facilitate comparison, individual curves are displaced laterally, and the calculated volumetric strain curves are plotted together on the right. The variability in the width of the curves is due to electronic noise. Although all experiments resulted in localized brittle deformation, little or no dilatancy was observed prior to failure. Curves are shown for runs a-57 (50 MPa), a-22, and a-38 (200 MPa). (b) Curves for experiments on lizardite; 1-58 (50 MPa), 1-55, and 1-14 (200 MPa). The gray dots on the central curve indicate the end of successive loading and unloading cycles. (c) Comparison of ev
observed for lizardite and antigorite (1-31 and a-37) to ev for Westerly granite (g-18) deformed at the same
conditions (Pc = 200 MPa, T-•20øC). The magnitude of volume change is significantly smaller for serpentinite. In addition, c' for serpentinite (thin lines) occurs much later in the loading history. In this figure the differential stress has been normalized by (lma x to facilitate comparison. (d) Mean stress ((lm=[(ll+ 62+ 63]/3 ) versus œv curves for experiments conducted on lizardite and antigorite at Pc = 200 MPa. The ev up to (I m = 200 MPa was measured during pressurization. The hydrostatic portion of the curve (large dots, C•m < 200 MPa) yields a bulk modulus
similar to that determined during triaxial loading (fine dots, Om > 200 MPa).
(Figure 7b). Two of the examples
display
limited compaction
(Pc
=50 and 200 MPa), while another
for a sample
deformed
at
Pc =200 MPa shows a small amount of dilation.
The variability in the volumetric strain behavior does not
appear
to correlate
with sample-scale
textural
anisotropy
(i.e., the
location of strain gauges with respect to the foliation in
antigorite). In the case of the lizardite samples there is no recognizable macroscopic foliation. As discussed below, a possible explanation for the variability in the volumetric strain
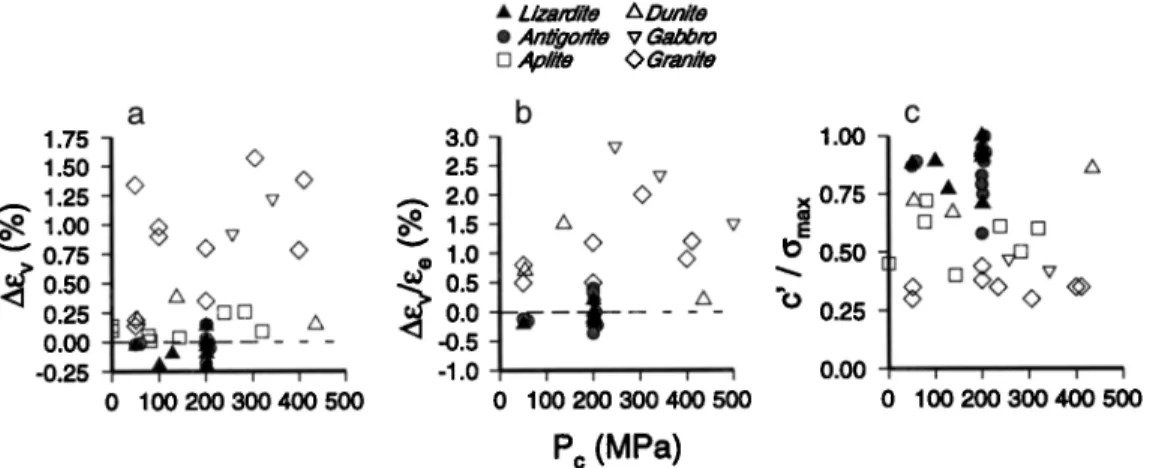
ESCARTIN ET AL.: NONDILATANT BRITTLE DEFORMATION OF SERPENTINITES 2905 ß œizardite •Dunite ß Antigo#re v Gabbro [] Aplite 0 Granite a b c
1.75
3.0 v
1.00 •
1.50 O 2.5 4,* A.• 1.25 •
v ¸
• 2.0
Ov
•x
0.75 z• ß
o--e.
1.00 • O•
• 1.5 A
•
•e• •
• 0.75 • ß
1.0 • • • 0.50 8•G
,-
0.0 ß ß• 0.25 • • • • -0.5
0.00 ß -0.25 , , -1.0 , , , 0.00 I I I I I 0 100 200 300 400 500 0 100 200 300 400 500 0 100 200 300 400 500Pc (MPa)
Figure 8. Volumetric
strain
data for serpentinite
and other
rocks. (a) Both serpentine
polytypes
display
effectively
nondilatant
behavior
(lAevl<0.2%),
while granite,
dunitc
and gabbro
show
Aœ
v typically
>0.2%. Aplite
shows the smallest amount of dilatancy (0<Aœv<0.25%) of the other crystalline rocks. Data for granite and aplite
are from Brace et at. [1966], dunitc
and gabbro
are from Shimada
et at. [1983]. (b) Aœ
v normalized
by the
extrapolated
elastic
strain at failure (œv)- (c) Plot of C'/Oma
x versus
Pc showing
that dilation (or apparent
compaction)
of antigorite
initiates
very
close
to failure
for both
antigorite
and
lizarditc;
dilation
occurs
much
earlier
in the loading cycle for the other rocks.
caused by fault localization under or in the immediate vicinity of strain gauges.
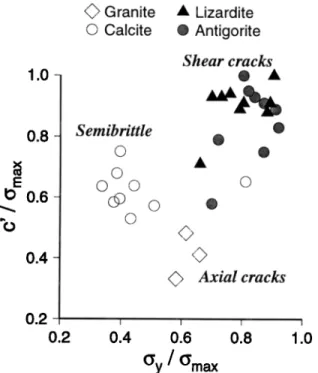
Even when serpentinites dilate, the volume increase is small when compared with that of granite deformed at the same conditions (Figure 7c). Note also that the deviation from elastic behavior (c', the stress at which stress and strain are not linearly related) occurs much later during the loading cycle in both serpentinites than in granite. Values of C'/Oma x for serpentinites range from 0.71 to 1 (Table 1), while those for granite range between 0.3 and 0.6 [Brace et at., 1965]. Both the lack of dilatancy and the high values of c'/Omax indicate that serpentinites define an end-member style of brittle deformation. The unique nature of the mechanical behavior of serpentinites is further appreciated when comparisons are extended to other rock types
such as aplite, granite, and gabbro (Figure 8). Serpentinites are
the only one of these rock types that do not show strongly dilatant volumetric strain behavior (Figure 8a). As shown in Figure 8b, the difference in volumetric strain behavior is more apparent when Aœ v is normalized by the extrapolated elastic strain œe [Brace et at., 1965]. The values of c'/6max for serpentinites are
generally >0.7, while the values measured for gabbro, dunitc, and
aplite are always <0.75 and can be as low as 0.25 (Figure 8c).
The volumetric strain measurements also illustrate the elastic
nature of deformation prior to yielding. Plots of mean stress
(Om=[O1+o2+(•3]/3) versus volumetric strain for both antigorite and lizarditc show a coincidence of the effective bulk modulus
measured during hydrostatic and subsequent triaxial loading
(Figure 7d). The effective bulk modulus is given by the slope of the o m versusœv curve; similar slopes are obtained during both the hydrostatic (01 =03) and triaxial (01 >IJ3) loading (Figure 7d, circles versus lines), indicating that significant pore collapse did
not occur during pressurization.
Microstructural Observations
As the confining pressure increases, the mode of deformation changes from localized (brittle) to distributed (ductile)
deformation in both antigorite and lizarditc. These observations
are summarized on a plot of IJma x versus Pc in Figure 4b.
Microstructural observations were made on samples deformed in
both regimes to determine the processes responsible for the transition in macroscopic deformation behavior.
Localized Deformation Regime
Optical
microscope
observations
on both serpentine
polytypes
indicate that deformation localizes on a single fault. In all casesthe faults form at high angles (300-45 ø ) to the shortening direction. Microcracking is generally restricted to the immediate vicinity of the shear zones; the microstructure at distances greater than-50 gm from the fault zones is indistinguishable from that of the starting material. However, incipient shear zones of limited
extent that accommodate small amounts of strain were observed
throughout.
In faulted samples of lizarditc and antigorite the
crystallographic
anisotropy
of individual grains controls
the
formation of microcracks and the localization of strain. Faults in
antigorite
form within the "bladed
bands,"
where
the grains
are
oriented parallel to the foliation. Microcracking is
crystallographically
controlled, as illustrated by optical
micrographs
of an antigorite sample that was unloaded
immediately
after the onset
of strain
weakening
(Figures
9a and
9b). Two incipient
fault zones
run along
two "bladed
bands";
in
both cases
the (001) cleavage
of the grains
within the bands
is
parallel to the faults. A TEM micrograph
of one of these
incipient faults illustrates that microcracks
form almost
exclusively along (001) grain boundaries,
although some
intragranular
cracks parallel to the (001) cleavage
are also
observed
(Figure 9c). The microcracks
illustrated
in Figure 9c
are oriented
at high angles
(>20 ø
) to the shortening
direction,
consistent with observations at the optical microscope scale. No
axial cracks are observed even at the TEM scale. Figures 9a and
9b also show that the "jog" connecting the two incipient faults is defined by cracks oriented along (001) grain boundaries.
Microcracks in faulted samples of lizarditc also form parallel
to the (001) cleavage.
Fault zones
tend
to follow the rims of the
mesh-textured
regions
(Figures
9d and 9e). A TEM micrograph
of a fault zone in a lizarditc sample deformed at the same conditions as that shown in Figure 9d is shown in Figure 9f. Both
29O6 ESCARTIN ET AL.' NONDILATANT BRITTLE DEFORMATION OF SERPENTINITES
Plane light
Crossed Nicols
TEM
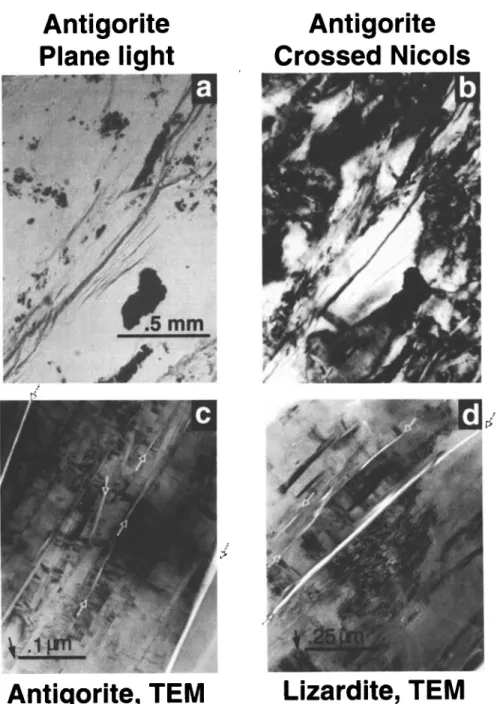
Figure 9. (a-c) Microstructures
of faulted
samples
of antigorite
and (d-f) lizardite
deformed
at low confining
pressures. In the optical micrographs the same region is shown in both plane light and crossed Nicols. In all cases faults and microcracks follow zones of subparallel grains and/or grain boundaries; Ol (shortening direction) is vertical for all the optical micrographs. Cracks are at a high angle to Ol indicating that they are shear microcracks. TEM micrographs from areas adjacent to faults (Figures 9c and 9t3 demonstrate that microcracks (open arrows) form parallel to the (001) cleavage and at high angles to the shortening direction (white arrow by scale bar). The micrographs correspond to samples a-7 (Figures 9a-9c), 1-31 (Figures 9d and 9e), and 1-49 (Figure 9t').
grain boundary and intragranular microcracks were observed
parallel to the (001) cleavage. Qualitatively, intragranular
microcracking is more abundant in lizardite than in antigorite. Distributed Deformation Regime
Microstructural observations for samples of both antigorite and lizardite deformed in the distributed ("ductile") deformation regime reveal numerous shear zones of limited lateral extent (0.01-1 mm long) that accommodate small amounts of strain. These shear zones are homogeneously distributed throughout the
sample, form at high angles to the shortening direction, and are
oriented in conjugate directions. Micrographs of samples
deformed in this regime demonstrate that the zone of microcracking associated with individual shear zones is wider than that observed in the localized regime (Figure 10). The change from localized to distributed deformation is characterized by a transitional style of deformation at Pc • 400 MPa. In the transitional regime strain is accommodated on-l-mm-wide fault zones that are composed of anastomosing and crosscutting shear
zones.
TEM observations demonstrate that the (001) cleavage also
controls microcracking in both antigorite and lizardite deformed
in the distributed deformation regime. Examples of both
ESCARTIN ET AL.' NONDILATANT BRITTLE DEFORMATION OF SERPENTINITES 2907
Antigorite
Plane light
Antigorite
Crossed
Nicols
a
'" : :'
*"•' ::":'
i,•':
...
,i•
...
:".
.... •: '"'-::"
• :•:::!:•:.: :.:';-'
.
....
:".}...
... .?., ::::::::::::::::::::::::::'.•:• ... ::,:,.'?:" • .... ?-:.:?•:..:,. ... ?:-'.:/----•. ,:??? • =========================== ... -,¾-•:.•....•'"
b
Antigorite, TEM
Lizardite, TEM
Figure 10. (a-c) Microstructures of"ductile" samples of antigorite and (d) lizardite deformed at high pressures. Although deformation was macroscopically ductile, the grain-scale microstructure is dominated by microcracks. Plene light and crossed Nicols optical micrographs of a grain-scale shear zone in antigorite (Figures 10a and 10b) display numerous cracks in a zone •0.2 mm wide. The cracks form parallel to the mineral cleavage, as confirmed by the TEM micrograph (Figure 10c). Microcracks (open arrows) are at high angles to the shortening direction (black arrow by scale bar). Numerous cracks along grain boundaries and within grains are observed. Lizardite displays similar microstructures at the TEM scale (Figure 10d); deformation is dominated by intragranular and grain boundary microcracks parallel to (001) cleavage. Microstructural observations did not show evidence for plastic deformation (microkinking, dislocation glide). The micrographs correspond to samples a-25 (Figures 10a and 10b), a-24 (Figure 10c), and 1-39 (Figure 10d). Compression direction in Figure 10a and 10b is vertical.
the (001) cleavage are shown in Figures 10c and 10d. The
microcracks form at high angles to the shortening direction,
consistent with the orientation of the small-scale shear zones
observed optically. Zones of uncracked material are scarce, both at optical and TEM scales, emphasizing the distributed nature of deformation in this regime.
Plastic Deformation Microstructures
Crystal plastic deformation does not appear to contribute significantly to strain in lizardite and antigorite in either the localized or the distributed deformation regimes. There is no resolvable difference between the density of dislocations or twins in uncleformed and deformed samples. However, because the
2908 ESCART1N ET AL.: NONDILATANT BRITTLE DEFORMATION OF SERPENT1NITES
a) t 60
>, 60
o
MPa,
{x=30
ß
ø 100
13 80
n=464
ß
n½=97
ß 40 o 600 • • •:•
%:.i:
0
-g0-45 0 45 go -g0-45 0b)
>,
60
20!MPa,
{x=4
ø
ß 40 .?:. ß - 20 0 -90-45 0 45 90C)
ß 40 ß - 20 0 -90-45 0 45 90 45 9O lOO n=476 'O 80ß
nc=79
o 60• 4O
o
xø. 20
o -90-45 0 45 90 lOO n=506 'O 80ß
nc=102
O 60O 40
• 20
0 -90-45 0 45 9O725
MPa,
{x=30
ø 100
]
n =464>, 60
'O 80
o
:::::!
ß
n•.=
170
ß 40
•.;-...:
o 60
ß
'
O 40
ß - 20 ß•:
'... •.:/::::
...
'•....-•.•.•
0 , , • 0 -90-45 0 45 90 -90-45 0 45 90Cleavage
Cleavage
90- -45 - '•' -90 , -90-45 0 r 2 = .9835 I I I 45 90 90- -45 - -90-45 0 r • = .9886 I I I 45 9O 90- e-..•
0-
o-45 -
-90 , -90-45 0 r 2 = .9895 I I I 45 9O 90-0-
-45
-90 r 2 = .9887 -90-45 0 45 90Cleavage
Figure 11. Histograms
of the orientation
of the (001) cleavage
and cracks
in deformed
antigorite.
The angle
of
the (001) cleavage of individual grains with respect to c•l is shown on the left (gray shading). The black shaded regions show the number and orientation of grains associated with either an intragranular or grain boundary crack.
The percentage of cracked grains for each orientation bin is shown in the center. The orientation of cracks is
plotted versus the orientation of the cleavage on the right. These data demonstrate that cracking occurs almost
exclusively
parallel
to the (001) cleavage
(r2>0.98
in all cases).
In each
case
the total
number
of measurements
n
and the number of cracked grains nc are indicated. With increasing pressure (Figures 1 l a to 11d) the total percentage of cracked grains increases, and the anisotropy in the orientation of the cracked grains decreases, consistent with a transition from localized to distributed deformation.
microstructure
of the starting
materials
is complex
(Figure
1), we
cannot rule out the possibility that some plastic deformation
occurred
without significantly
changing
the density
of crystal
defects.
Further
evidence
for a lack of crystal
plasticity
is given
by a comparison of microstructures in serpentinites to those in biotite schists deformed at similar conditions. Biotite, which has a crystal structure similar to that of serpentine, deforms
plastically at room temperature
and develops kink bands
associated
with dislocation
glide on the basal plane [Shea
and
Kronenberg, 1992]. Such kink bands were not observed in any of the deformed serpentinite samples.
Microcrack Orientations
![Figure 3. Differential stress ((•] - (•3) versus axial strain (ea) curves for (left) antigorite and (right) lizardite as a function of pressure](https://thumb-eu.123doks.com/thumbv2/123doknet/14710802.567503/7.861.222.658.84.548/figure-differential-stress-versus-antigorite-lizardite-function-pressure.webp)