HAL Id: hal-02134905
https://hal.archives-ouvertes.fr/hal-02134905
Submitted on 20 May 2019
HAL is a multi-disciplinary open access
archive for the deposit and dissemination of
sci-entific research documents, whether they are
pub-lished or not. The documents may come from
teaching and research institutions in France or
abroad, or from public or private research centers.
L’archive ouverte pluridisciplinaire HAL, est
destinée au dépôt et à la diffusion de documents
scientifiques de niveau recherche, publiés ou non,
émanant des établissements d’enseignement et de
recherche français ou étrangers, des laboratoires
publics ou privés.
Kinetic study of biomass char combustion in a low
temperature fluidized bed reactor
Mathieu Morin, Sébastien Pécate, Mehrdji Hemati
To cite this version:
Mathieu Morin, Sébastien Pécate, Mehrdji Hemati. Kinetic study of biomass char combustion in a
low temperature fluidized bed reactor. Chemical Engineering Journal, Elsevier, 2018, 331, pp.265-277.
�10.1016/j.cej.2017.08.063�. �hal-02134905�
Kinetic study of biomass char combustion in a low temperature
fluidized bed
reactor
Mathieu Morin
⁎, Sébastien Pécate, Mehrdji Hémati
Laboratoire de Génie Chimique, Université de Toulouse, CNRS, INPT, UPS, 4 allée Emile Monso, 31432 Toulouse, France
Keywords: Combustion Fluidized bed Char Kinetic TGA
A B S T R A C T
The purpose of this work is the kinetic study of biomass char combustion in a low temperaturefluidized bed reactor. This char was obtained from fast pyrolysis of beech stick in an annex batchfluidized bed reactor at 923 K and atmospheric pressure. Operating conditions of the combustion were thoroughly characterized so that the reaction takes place in isothermal conditions and a constant oxygen partial pressure. The kinetic study was performed for temperatures up to 643 K, oxygen partial pressures ranging from 5065 to 21273 Pa and cylindrical char particles (D = 4 mm and L = 9 mm). The Volumetric Model was found to be in very good agreement with experimental data. Values of activation energy and reaction order with respect to oxygen are respectively equal to 144 kJ/mol and 0.59. The reaction scheme during char combustion showed that charfirst reacts with oxygen to form CO which is further oxidized either at the particle surface or in the gas phase to produce CO2. Besides, it
was found that the char reactivity in combustion is higher in afluidized bed reactor compared to TGA. This was explained by diffusional effects of oxygen and CO oxidation within the crucible in the TGA.
1. Introduction
Biomass is a possible alternative to the direct use of fossil fuel in gasification process as it has the advantage of being neutral in regard to the CO2emissions considering photosynthesis reactions. Biomass gasi
fication produces synthesis gas which can be directly burned for heat and electricity production or used as a feedstock for the production of methane via Methanation process or liquid via Fisher Tropsch process. Biomass gasification is a thermochemical conversion occurring at high temperatures with many simultaneous reactions. It occurs in two stages: (i) for temperatures above 623 K, biomass undergoes a fast thermal conversion. This pyrolysis step converts the biomass into volatile pro ducts either condensable (steam and tars) or non condensable (H2, CO,
CO2, CH4and C2Hx) and a solid residue called char[1]; (ii) for tem
peratures greater than 973 K, the char reacts with steam and carbon dioxide. This gasification step converts the char into synthesis gas.
The reactive system of biomass conversion (i.e. pyrolysis + gasifi cation) is an endothermic process. A contribution of energy is necessary in order to maintain the temperature and the different reactions in the reactor. Two types of technologies exist for biomass gasification ac cording to the method of heat transmission[2]. Firstly, the heat can be supplied by partial combustion of the fuel in the gasifier itself. This process includes thefixed bed gasifiers (co and counter current) and the “bubbling fluidized bed” gasifiers. Secondly, the heat can be
provided from a source outside of the gasifier by external heat (plasma or solar) or internal recirculation of gas and char. In the latter ap proach, Fast Internally Circulating Fluidized Bed (FICFB)[3] is cur rently a promising process which uses a circulation of a medium be tween an entrained bed exothermic reactor and a dense endothermic reactor. In the exothermic reactor called combustor, a part of the char from the gasifier is burnt and heats the medium. In the endothermic reactor called gasifier, the medium provides the heat necessary for the biomass gasification.
During biomass gasification in dual fluidized bed, the char reacts with steam and carbon dioxide in the gasifier and with oxygen in the combustor. Information regarding the kinetic of char combustion in a fluidized bed reactor is then essential to better understand phenomena inside a combustor.
The char combustion proceeds in several steps: the external transfer of oxygen from the bulk to the external surface of the particle, the diffusion of oxygen within the pores of the solid, the oxygen chemi sorption on an active site (adsorption), the intrinsic chemical reaction and finally the products desorption [4,5]. Together, these different steps are strongly affected by the physicochemical properties of the char, the combustion temperature, the oxygen partial pressure, the size of the solid char particles and the type of reactor.
The physicochemical properties and the reactivity of biomass char depend on the pyrolysis operating conditions. This has been discussed
⁎Corresponding author.
E-mail addresses: [email protected](M. Morin), [email protected](S. Pécate), [email protected](M. Hémati).
in a previous paper [6]. It was shown that the pyrolysis operating conditions such as the heating rate, the pyrolysis temperature and the biomass nature strongly influence the amount of hydrogen, oxygen, carbon and ash content in the char as well as the presence of aromatic and amorphous carbons. Besides, a raise of the heating rate during biomass pyrolysis increases the char reactivity while a raise of thefinal pyrolysis temperature decreases the reactivity. The amount of ash in the char matrix may also catalyze the reaction of combustion.
The reaction of combustion can be divided into three main regimes according to the temperature, the oxygen partial pressure and the char particles size [5]. In Regime I (i.e. low temperatures), the intrinsic chemical reaction is low with respect to oxygen diffusion inside the pores and external transfer around the particle. The intrinsic chemical reaction is the limiting step. The Regime II (i.e. medium temperatures regime) is the transition regime where both the intrinsic chemical re action and the diffusion of oxygen play a significant role. In Regime III (i.e. high temperatures regime), the intrinsic reactivity of the solid is very high and oxygen molecules react as soon as they have passed the boundary layer around the particle. External mass transfer is then the limiting step. Consequently, to determine char O2combustion kinetic,
many authors [7 9]minimized mass and heat transfers by carefully choosing the combination of combustion temperature, oxygen partial pressure and particles size so that the combustion occurs in the che mical control regime (i.e. Regime I).
The char combustion is highly dependent on the combustion tem perature and the oxygen partial pressure. It is well known in the lit erature that the combustion rate increases by raising these two para meters [7,8,10 15]. Several authors[9,16 18]also showed that the char particles size influences oxygen diffusion inside the particle which
may lead to a non uniform oxygen concentration. Consequently, the combustion temperature, the oxygen partial pressure and the char particles size influence the regime of combustion (i.e. Regime I, II or III).
The most widely used treatment to represent char oxygen reaction is based on a simple global reaction[19 24]:
+ + + → + + + C η η O η η CO η CO 2 2 2 1 1 1 2 2 (1) where η represents the product ratio of CO over CO2.
However, there has been much controversy in the literature[23]to identify whether the reaction involved is
+ →
C 1O CO
2 2 (2)
followed by CO oxidation in the gas phase to form CO2, or, alter
natively, the reaction may be + →
C O2 CO2 (3)
Overall, the authors[25 29]focused on the determination of the CO/CO2product ratio in order to determine whether the carbon dioxide
is a primary product of the carbon oxygen reaction or a secondary product resulting from the gas phase oxidation of carbon monoxide.
Table 1summarizes some previous works in regard to the CO/CO2
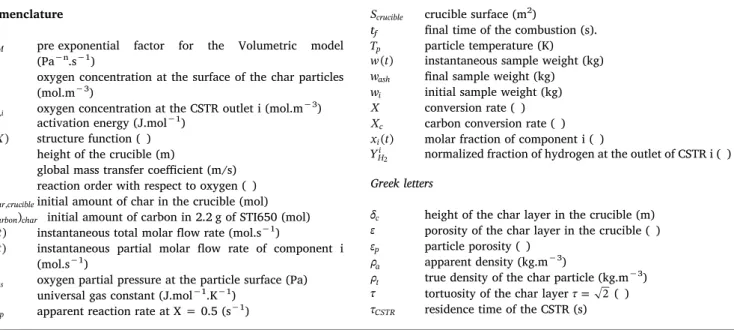
product ratio. In these studies, the researchers used several techniques such as low oxygen partial pressures, high gas velocities, gaseous in hibitors and low temperatures of the surrounding gas in order to minimize the CO oxidation in the gas phase. Consequently, they ex clusively measured the heterogeneous reaction between carbon and oxygen. For instance, Tognotti et al.[25]avoided oxidation of CO to Nomenclature
AVM pre exponential factor for the Volumetric model
(Pa−n.s−1)
COs
2 oxygen concentration at the surface of the char particles
(mol.m−3)
CO2,i oxygen concentration at the CSTR outlet i (mol.m
−3)
Ea activation energy (J.mol−1)
f X( ) structure function ( )
H height of the crucible (m)
Kc global mass transfer coefficient (m/s)
n reaction order with respect to oxygen ( )
nchar crucible, initial amount of char in the crucible (mol)
n
( carbon char) initial amount of carbon in 2.2 g of STI650 (mol)
n ṫ ( )t instantaneous total molarflow rate (mol.s−1)
n ṫ ( )i instantaneous partial molar flow rate of component i
(mol.s−1)
PO2,s oxygen partial pressure at the particle surface (Pa) R universal gas constant (J.mol−1.K−1)
Rapp apparent reaction rate at X = 0.5 (s−1)
Scrucible crucible surface (m2)
tf final time of the combustion (s).
Tp particle temperature (K)
w t( ) instantaneous sample weight (kg)
wash final sample weight (kg)
wi initial sample weight (kg)
X conversion rate ( )
Xc carbon conversion rate ( )
x ti( ) molar fraction of component i ( )
YHi2 normalized fraction of hydrogen at the outlet of CSTR i ( )
Greek letters
δc height of the char layer in the crucible (m)
ε porosity of the char layer in the crucible ( )
εp particle porosity ( )
ρa apparent density (kg.m−3)
ρt true density of the char particle (kg.m−3)
τ tortuosity of the char layerτ= 2( )
τCSTR residence time of the CSTR (s)
Table 1
Expression of CO/CO2product ratio from the combustion of carbon in the literature.
Ref Carbon type Reactor Temperature (K) PO2(bar) Expression CO/CO2
[25] Spherocarb char Electrodynamic balance 670–1670 0.05–1 − −
(
)
P50·exp 3070T ·O2 0.21
[26] Soot particle TGA 663–893 0.05–1 A·exp
(
−)
·P−T O
3200 20.27
[27] Graphon Static system 798–948 1.3·10−5
− −
(
)
P A·exp · T O 3200 20.22 − 2.6·10 4 [28] Artificial graphite Coal charFlow system 733–1173 0.05–0.25 2500·exp
(
−)
T
6240
[29] Petroleum coke Fluidized bed 850–970 0.21 −
(
)
1340·exp
T
•
During carbon combustion, the CO/CO2product ratio is constantafter a short induction period[25 28].
•
Both CO and CO2are primary products of the carbon oxygen reaction.
•
The ratio depends on several parameters including the temperature, the oxygen partial pressure, the solid nature and the presence of catalytic impurities.•
For temperatures in the range of 798 948 K and oxygen partial pressures between 0.05 and 1 bar, values of CO/CO2ratio vary between 0.5 and 6[25 27].
•
There is a general agreement that the ratio increases by raising the combustion temperature.•
The effect of oxygen partial pressure is not well defined. Some workers[28,29]reported no effect of this parameter while others [25 27]observed that the ratio decreases by increasing the oxygen partial pressure.•
Du et al.[26]studied the effect of calcium in the carbon during the combustion. They concluded that the presence of this component strongly favors the formation of CO2. For instance, at 663 K, theaddition of calcium in soot particles decreases the CO/CO2product
ratio from 0.53 to 0.007. Therefore, one hypothesis is that the CO formation takes place at the carbon edge while the CO2production
occurs at inorganic sites[26].
More recently, in the case of combustion influidized bed reactors, other researchers [30 33]considered that CO is the primary product according to Reaction(2), with the CO diffusing away from the carbon and being converted to CO2either immediately above thefluidized bed
or in the bubbles rising up through the bed. The CO conversion may be expressed by the following reaction:
+ →
CO 1O CO
2 2 2 (4)
The simplest way to represent Reaction(2)is that O2adsorbs on an
active site C() on the carbon surface to give a carbon oxygen complex C(O) which then further desorbs to produce CO[19,30]:
+ → → C O C O C O CO ( ) ( ) 1 2 2 (5) The different steps in Reaction (5) are known as the Langmuir Hinshelwood formulation which describes the competition between adsorption and desorption phenomena on the char surface.
Hurt and Calo[19]also suggested that the formation of CO2may
originate from a reaction between carbon oxygen complexes C(O) and gas phase oxygen according to the following reaction:
+ + → +
C() C O( ) O2 CO2 C O( ) (6)
In the mechanism given by Reactions(5) and (6), any of the steps may be a lumped description of several more elementary steps[19,20]. From the different viewpoints in the literature, it is not clear yet whether the formation of CO2originates from a gas phase reaction (i.e.
Reaction(4)) or occurs at the solid surface according to Reaction(6). The kinetic of biomass char combustion was mainly measured using a thermogravimetric analyzer [7,8,10 15,34 37]. This apparatus can continuously record the mass change of a char sample during its com bustion under a well known heating program. In the case of isothermal combustion in TGA, the char sample must undergo a thermal pre treatment before reaching the reaction temperature. Isothermal
conditions are then achieved by employing a switching gas method which consists in heating the TGA under an inert atmosphere to the desired temperature before switching the gas from inert to reactive to perform the combustion. After this switching gas method, the newly introduced gas has to diffuse and completely replace the former inert gas in the TGA. It is known that the time necessary for totally replacing the inert gas is likely to affect the char combustion rate as it would cause a continuous change in oxygen concentration. In a previous work [8], it was shown that it required 25 min for the air to totally replace nitrogen after the switching gas method.
The kinetic of char combustion in afluidized bed reactor has been studied in the case of coal char[30 32]or sewage sludge[33]. The use of a fluidized bed reactor has the advantage of uniform particles mixing, uniform temperature throughout the bed and rapid mass and heat transfers. It also enables a direct feed of the char sample once the reactor has reached the pre set combustion temperature and a steady state. To determine the kinetic of char combustion in afluidized bed reactor, the produced gases are sampled and their compositions are measured by gas analyzers. Besides, efforts must be made to keep the volume of the sampling gas lines as small as possible. Indeed, the produced gas concentration measured by the analyzer can differ from the one leaving thefluidized bed since the concentration is altered by gas mixing in both the freeboard zone and the sampling lines[32,33]. The response of the analyzer may also modify the produced gas con centration.
Several researchers[11,38,39]observed that the reactivity of char in gasification or combustion is dependent on the type of reactors. For instance, in the case of coal char gasification with CO2, the authors
[38,39]agreed that the reaction rate is higher in thefluidized bed than in the TGA. Zeng et al. [38] explained this phenomenon by the switching gas method in the TGA which leads to a non uniform CO2
partial pressure at the beginning of the reaction. This non uniform CO2
partial pressure decreases the char gasification rate. Besides, the au thors also mentioned that the difference in char reactivity in the flui dized bed reactor and in the TGA is less significant at higher gasification temperatures. Mueller et al.[39]also reported that, during the gasifi cation of high volatiles coal char with CO2 for temperatures above
1073 K, the fluidized bed reactor shows significantly higher carbon conversion rate and reactivity than the TGA. They explained this phe nomenon by thermal annealing during the heat up of the char particles in the TGA which decreases the reactivity. The authors concluded that the knowledge of the thermal history of the particle prior to gasification process is essential for analyzing kinetic data. Finally, Janse et al.[11] studied the difference in combustion reactivity of wood char in two different reactors. They reported that the combustion rate of pine wood char in a packed bed reactor is higher than in a TGA for temperatures up to 648 K. They attributed this difference to the chemisorption of oxygen on carbon which can disturb the weight loss measurement in the TGA. Above a combustion temperature of 648 K, the results of both techniques were found to be similar.
1.1. Brief review on char combustion kinetic
The reactivity of char combustion can be expressed by the rate of a solid state reaction according to the following equation:
=
dX
dt k T( )· (p h PO2,s)· ( )f X (7) whereX, PO s2, andTpare the conversion rate, the oxygen partial pres
sure at the particle surface (Pa) and the particle temperature (K), re spectively. f X( ) is the reaction model also known as the structure function. h P( O s2,) is the oxygen partial pressure function which re presents the effect of oxygen partial pressure on the reaction rate. k T( )p
is the temperature dependent rate constant which is described by the Arrhenius equation:
CO2 by heating a single char particle while maintaining the surrounding
gas at room temperature. Arthur [28] added POCl3 in the gas stream
with the intention of inhibiting the secondary reaction of CO to CO2.
Table 1 also shows that a wide range of carbon types, reactor types and operating conditions were applied. Conclusions drawn from these stu dies can be summarized in several points:
⎜ ⎟ = ⎛ ⎝ − ⎞ ⎠ k T A E RT ( )p ·exp a p (8)
where A is the pre exponential factor, Ea is the activation energy
(J.mol−1),Ris the universal gas constant (J.mol−1.K−1). The oxygen partial pressure function can be given in the form of a power law:
=
h P( O2,s) POn2,s (9)
where n is the reaction order with respect to oxygen.
Many reaction mechanisms have been proposed to represent the carbon oxygen reaction[19]. The most widely used treatment considers Reaction (1)as simple global reaction. The reaction rate is then ex pressed as follows: = = ⎛ ⎝− ⎞⎠ k T h P R A E RT P ( )· (p O2,s) global ·exp a · On2,s (10) In the literature, most of the authors employed Eqs.(7) and (10)to represent the kinetic of biomass char combustion[8,20]. Nevertheless, in the case of coal char combustion, some researchers [40,41] have used the Langmuir Hinshelwood formulation to represent kinetic data. The simplest Langmuir Hinshelwood formulation takes into account Reaction(5)and is given by:
= = + k T h P R k k P k P k ( )· (p O ) global d a O a O d s s s 2, 2, 2, (11)
wherekdandkaare the rate constants for desorption and adsorption
process respectively and follow an Arrhenius law.
Finally, Hurt and Calo[19]considered both Reactions(5) and (6)in the kinetic modelling. They described the kinetic of coal char com bustion by: = = + + k T h P R k k P k k P k P ( )· (p O ) global a O a d O a O k 6 2 2 s s s s d 2, 2, 2, 2, (12)
The structure function f X( ) represents the reactive surface of the particle. Its evolution during the gasification or combustion reaction is difficult to predict and is subject to discussion in the literature[42]. Due to the complex char structure, several kinetic models are reported in the literature to represent the structure function. The most commonly models used for biomass char combustion are the Power Law Model (PL) and the Volumetric Model (VM)[8,20]. The PL is totally empiric in nature while the VM assumes a homogeneous reaction throughout the
particle. In a previous work[8], it was shown that the Grain Model (GM) may also be used to represent kinetic data of biomass char com bustion in TGA. These three models (i.e. PL, VM and GM) are known as deceleratory models which represent a decrease in the reaction rate with conversion. However, during the char combustion or gasification, a bell shape relationship between reaction rate and conversion is fre quently observed. Two different points of view are found. First, in some works[10,21], this curve profile is attributed to a change of the char reactive surface during the reaction. The Random Pore Model (RPM) proposed by Bhatia and Perlmutter[43]has received much interest due to its ability to predict a maximum reaction rate. This model is classi fied as sigmoidal model. It introduces a structural parameter by con sidering that the char particle is porous and the reaction takes place at the internal surface of the pores. As the reaction proceeds, a random overlapping of the pores occurs which can increase or reduce the re active surface area. This model was largely used for gasification of char with CO2and steam[21]. A very few authors[10]also found that the
Random Pore Model satisfactorilyfitted the reaction rate of biomass char combustion. Finally, the second point of view is that the bell shape curve is due to the low gasification agent content in the reactive at mosphere just after switching the gas from inert to reactive[8].
The aim of the present study is to determine the combustion kinetic of a wood char in afluidized bed reactor. This char was obtained from fast pyrolysis in an annex batchfluidized bed reactor at 923 K and characterized in a previous work[6]to understand its physicochemical properties and reactivity. Experiments are carried out at atmospheric pressure and various temperatures ranging from 603 to 643 K and oxygen partial pressures ranging from 5065 to 21273 Pa.
2. Experimental, material & methods 2.1. Char preparation
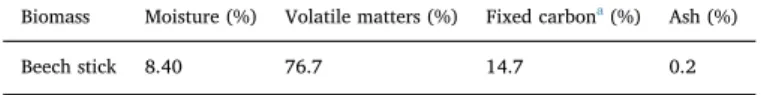
The biomass used in this work is a cylindrical beech stick (D = 6 mm, L = 10 mm). A picture of the raw material is given in Fig. 1(A). The proximate analysis of the biomass was carried out fol lowing the standard test method for chemical analysis of wood charcoal D 1762 84. The results are given inTable 2.
The pyrolysis procedure can be found in detail in a previous work [6]. Briefly, a well known mass of beech sticks is introduced in a batch fluidized bed reactor containing hot inert sand particles. The fast
pyrolysis of beech sticks is carried out at 923 K under an inert atmo sphere of nitrogen at atmospheric pressure. After the pyrolysis, the produced chars (called STI650) are cooled under a flow of nitrogen before being recovered the day after by sieving. A picture of the ob tained chars is given inFig. 1(B). The soaking time at bed temperature was approximatively 3 h. The produced char is stored inside a pill box until it was analyzed.
Fig. 1shows that the shape of the produced char particles remained cylindrical close to the initial biomass with a small size decrease (from 5 to 4 mm for the diameter and from 10 to 9 mm for the particle length).
The physical and chemical properties of the beech stick and STI650 are summarized inTable 3. In STI650, the ash is composed of 5.5% of magnesium (Mg), 10.8% of potassium (K), 1.8% of sodium (Na), 30.6% of calcium (Ca) and 51.3% of silica (Si). The apparent density was measured from the weight and volume offive well truncated particles. The true density was obtained by helium pycnometer. The porosity of the biomass and char particles was determined using the following expression: = − ε ρ ρ 1 p a t (13)
2.2. Char combustion in thefluidized bed reactor 2.2.1. Experimental setup
Isothermal combustion of STI650 was carried out in afluidized bed reactor. The experimental setup is shown inFig. 2. Thefluidized bed reactor consists of a tube of internal diameter of 5.26 cm and a height of 94 cm heated by an electric furnace (height : 27 cm, inner diameter : 36 cm) delivering 2.6 kW of electric power. About 580 g of olivine are used as fluidized solids with a surface mean diameter (d32) equal to
268μm and an apparent density (ρp) equal to 2965 kg/m3. The
minimum fluidization velocity (Umf) of olivine was measured experi
mentally and is equal to 5.5 cm/s at 623 K.
The reactor is supplied with nitrogen and air at different proportions according to the combustion operating conditions. The nitrogen and air massflow rates are carefully regulated by two mass flowmeters Aera FC 7700 CD. The feeding gas is preheated between 200 and 300 °C in a stainless steel tube (inner diameter 1 cm) forming a coil around the reactor. Then, preheated gas enters in a wind box beneath the reactor which isfilled with porous silicon carbide (SiC). This structure is used as a mixing zone. The temperature is controlled with a K thermocouple. The gas distribution in the bed is done by a perforated plate of 19 or ifices (orifices inner diameter of 1 mm) equipped at its base by a stainless steel sieve with 30μm of mesh.
The temperature inside the fluidized bed is controlled by two thermocouples located at 5 and 25 cm above the distributor. The former is used to regulate the temperature of the reactor using a PID controller.
A differential pressure transmitter is connected at 5 and 500 mm above the distributor in order to follow the pressure drop of the bed. At the reactor outlet, the elutriated particles and condensable gases are col lected by a cyclone and a condenser, respectively.
After reaching the operating conditions of the combustion and a steady state regime, a well known amount of char is introduced from the top of the reactor and directly falls down to the surface of the hot fluidized bed.
2.2.2. Sampling method and gas analysis
The sampling of gases is carried out by a stainless steel mobile probe (inner diameter 4 mm) located at thefluidized bed surface. A thermo couple is placed inside the mobile probe to measure the precise tem perature at the entrance of the probe. The gas sample is sucked by a vacuum pump connected to a flowmeter (volume flow rate of 100 mL.min−1at STP). At the mobile probe outlet, the pumped gas passes through a cyclone and afilter to separate gas from particles and through a wash bottle cooled at 0 °C to remove any traces of water. To prevent any condensations of steam, all of the lines from the reactor to the entrance of the condensation system are heated to a temperature of 150 °C.
A micro Gas Chromatograph (microGC) Agilent 490 is used to on line analyze the non condensable gases. It is equipped with a Poraplot U 10 m × 0.25 mm ID column connected to a Thermal Conductivity Detector (TCD) calibrated for CO2 and C2Hx quantification. A CP
Molsieve 5 A 10 m × 0.25 mm column connected to a TCD is calibrated for the analyses and quantification of N2, H2, O2, CO and CH4. The time
lapse between two quantifications is 3 min.
2.2.3. Thermal characterization of thefluidized bed
This section aims to establish thefluidization gas velocity and the char quantity during the experiments which enable the char combus tion to occur in isothermal conditions with a constant oxygen partial pressure and a good mixing between olivine and char particles. The experimental results are given in theSupplementary material (A)and led to the following operating conditions:
•
A gas velocity of 2.5 times the minimumfluidization velocity to enable a homogeneous temperature in the bed and to avoid any particles elutriation;•
A char sample mass of 2.2 g to perform the combustion in iso thermal conditions and a constant oxygen partial pressure;•
A mobile probe located at 27 cm above the distributor to avoid any reactions in the freeboard zone.2.2.4. Parameters of the study
For each experiment, the composition of the non condensable pro duced gases was analyzed as a function of time from the continuous micro GC analysis. The total molarflow rate at the outlet of the reactor is given by: = n t n x t ̇ ( ) ̇ ( ) t N N 2 2 (14)
where n ṫ ( )t is the instantaneous total molarflow rate (mol/s),ṅN2re
presents the molarflow rate of nitrogen at the entrance of the reactor (mol/s) and xN2( )t is the measured molar fraction of nitrogen at the
Biomass Moisture (%) Volatile matters (%) Fixed carbona(%) Ash (%)
Beech stick 8.40 76.7 14.7 0.2
aby difference
Table 3
Ultimate analysis and properties of the different chars.
Pyrolysis conditions Apparent density ρa(kg/m3) True density ρ t(kg/m
3) Solid porosity ε
p(%) Ultimate analysis (db, wt%) Chemical Formula
Materials Pyrolysis Temp. (K) Direct measurements He pycnometer – C H O Ash
STICK – 718±24 1362.5±1 47 44.63 6.37 45.24 0.2 CH1.71O0.76
STI650 923 212±32 1589.4±5 87 84.47 2.75 7.39 5.39 CH0.39O0.07
Table 2
[27] R. Phillips, F.J. Vastola, P.L. Walker Jr., Factors affecting the product ratio of the carbon-oxygen reaction– II reaction temperature, Carbon 8 (1970) 205–210. [28] J.R. Arthur, Reactions between carbon and oxygen, Trans. Faraday Soc. 47 (1950)
164–178.
[29] T.M. Linjewile, P.K. Agarwal, The product CO/CO2 ratio from petroleum coke spheres influidized bed combustion, Fuel 74 (1995) 5–11.
[30] I.M. Bews, A.N. Hayhurst, S.M. Richardson, S.G. Taylor, The order, Arrhenius parameters, and mechanism of the reaction between gaseous oxygen and solid carbon, Combust. Flame 124 (2001) 231–245.
[31] P.S. Fennell, J.S. Dennis, A.N. Hayhurst, The order with respect to oxygen and the activation energy for the burning of an anthracitic char in O2in afluidized bed, as
measured using a rapid analyser for CO and CO2, Proc. Combust. Inst. 32 (2009)
2051–2058.
[32] P.S. Fennell, S. Kadchha, H.Y. Lee, J.S. Dennis, A.N. Hayhurst, The measurement of the rate of burning of different coal chars in an electrically heated fluidized bed of sand, Chem. Eng. Sci. 62 (2007) 608–618.
[33] J.S. Dennis, R.J. Lambert, A.J. Milne, S.A. Scott, A.N. Hayhurst, The kinetics of combustion of chars derived from sewage sludge, Fuel 84 (2005) 117–126. [34] J. Adánez, L.F. de Diego, F. García-Labiano, A. Abad, J.C. Abanades, Determination
of biomass char combustion reactivities for FBC applications by a combined method, Ind. Eng. Chem. Res. 40 (2001) 4317–4323.
[35] A. Zolin, A. Jensen, P.A. Jensen, F. Frandsen, K. Dam-Johansen, The influence of inorganic materials on the thermal deactivation of fuels chars, Energy Fuels 15 (2001) 1110–1122.
[36] Md. Azharul Islam, M. Auta, G. Kabir, B.H. Hameed, A thermogravimetric analysis of the combustion kinetics of karanja (Pongamia pinnata) fruit hulls char, Bioresour. Technol. 200 (2016) 335–341.
[37] C. Branca, C. Di Blasi, Global kinetics of wood char devolatilization and combus-tion, Energy Fuels 17 (2003) 1609–1615.
[38] X. Zeng, F. Wang, Y. Wang, A. Li, J. Yu, G. Xu, Characterization of char gasification in a microfluidized bed reaction analyzer, Energy Fuels 28 (2014) 1838–1845.
[39] A. Mueller, H.D. Haustein, P. Stoesser, T. Kreitzberg, R. Kneer, T. Kolb, Gasification kinetics of biomass- and fossil-based fuels: comparison study usingfluidized bed and thermogravimetric analysis, Energy Fuels 29 (2015) 6717–6723.
[40] R.H. Essenhigh, Rate equations for the carbon-oxygen reaction: an evaluation of the Langmuir Adsorption Isotherm at atmospheric pressure, Energy Fuels 5 (1991) 41–46.
[41] R.H. Essenhigh, Influence of pressure on the combustion rate of carbon, Twenty-Sixth Symposium on Combustion (1996) 3085–3094.
[42] F. Mermoud, S. Salvador, L. Van de Steene, F. Golfier, Influence of the pyrolysis heating rate on the steam gasification rate of large wood char particles, Fuel 85 (2006) 1473–1482.
[43] S.K. Bhatia, D.D. Perlmutter, A random pore model forfluid-solid reaction: I. Isothermal, kinetic control, AIChE J. 26 (1980) 379–386.
[44] A. Gomez, R. Silberman, N. Mahinpey, A comprehensive experimental procedure for CO2 coal gasification: Is there really a maximum reaction rate? Appl. Energy 124 (2014) 73–81.
[45] P. Ollero, A. Serrera, R. Arjona, S. Alcantarilla, Diffusional effects in TGA gasifi-cation experiments for kinetic determination, Fuel 81 (2002) 1989–2000. [46] S. Schulze, P. Nikrityuk, Z. Abosteif, S. Guhl, A. Richter, B. Meyer, Heat and mass
transfer within thermogravimetric analyzer: from simulation to improved estima-tion of kinetic data for char gasificaestima-tion, Fuel 187 (2017) 338–348.
[47] A. Gómez-Barea, P. Ollero, R. Arjona, Reaction-diffusion model of TGA gasification experiments for estimating diffusional effects, Fuel 84 (2005) 1695–1704. [48] R.B. Bird, W.E. Stewart, E.N. Lightfoot, Transport phenomena, second ed., Wiley,
2002.
[49] F.A.L. Dullien, Porous Media: Fluid Transport and Pore Structure, second ed., Academic Press, 2012.
[50] A. Zolin, A.D. Jensen, P.A. Jensen, K. Dam-Johansen, Experimental study of char thermal deactivation, Fuel 81 (2002) 1065–1075.
[51] M. Kumar, R.C. Gupta, Influence of carbonization conditions on the gasification of acacia and eucalyptus wood chars by carbon dioxide, Fuel 73 (1994) 1922–1925.