Atherosclerotic plaque behind the stent changes
after bare-metal and drug-eluting stent implantation
in humans: Implications for late stent failure?
The MIT Faculty has made this article openly available.
Please share
how this access benefits you. Your story matters.
Citation
Andreou, Ioannis et al. “Atherosclerotic Plaque Behind the Stent
Changes after Bare-Metal and Drug-Eluting Stent Implantation in
Humans: Implications for Late Stent Failure?” Atherosclerosis 252
(September 2016): 9–14 © 2016 Elsevier Ireland Ltd
As Published
http://dx.doi.org/10.1016/J.ATHEROSCLEROSIS.2016.07.914
Publisher
Elsevier
Version
Author's final manuscript
Citable link
http://hdl.handle.net/1721.1/112774
Terms of Use
Creative Commons Attribution-NonCommercial-NoDerivs License
Atherosclerotic plaque behind the stent changes after
bare-metal and drug-eluting stent implantation in humans:
implications for late stent failure?
Ioannis Andreoua,b, Saeko Takahashic, Masaya Tsudad, Koki Shishidoc, Antonios P. Antoniadisa, Michail I. Papafaklisa, Shingo Mizunoc, Ahmet U. Coskune, Shigeru Saitoc,
Charles L. Feldmana, Elazer R. Edelmana,b, and Peter H. Stonea,*
aCardiovascular Division, Brigham and Women’s Hospital, Harvard Medical School, Boston, MA,
USA
bInstitute for Medical Engineering and Science, Massachusetts Institute of Technology,
Cambridge, MA, USA
cDepartment of Cardiovascular Medicine, Shonan Kamakura General Hospital, Kanagawa, Japan dDepartment of Cardiovascular Medicine, Hokkaido University, Sapporo, Japan
eMechanical and Industrial Engineering, Northeastern University, Boston, MA, USA
Abstract
Background and aims—The natural history and the role of atherosclerotic plaque located behind the stent (PBS) are still poorly understood. We evaluated the serial changes in PBS following bare-metal (BMS) compared to first-generation drug-eluting stent (DES) implantation and the impact of these changes on in-stent neointimal hyperplasia (NIH).
Methods—Three-dimensional coronary reconstruction by angiography and intravascular
ultrasound was performed after intervention and at 6–10-month follow-up in 157 patients with 188 lesions treated with BMS (n=89) and DES (n=99).
Results—There was a significant decrease in PBS area (−7.2%; p<0.001) and vessel area (−1.7%; p<0.001) after BMS and a respective increase in both areas after DES implantation (6.1%; p<0.001 and 4.1%; p<0.001, respectively). The decrease in PBS area significantly predicted neointimal area at follow-up after BMS (β: 0.15; 95% confidence interval [CI]: 0.10–
*Corresponding author: Cardiovascular Division, Brigham & Women’s Hospital, Harvard Medical School, 75 Francis Street, Boston,
MA 02115. Tel: +18573071965; Fax. +18573071955. pstone@partners.org (P.H. Stone).
Publisher's Disclaimer: This is a PDF file of an unedited manuscript that has been accepted for publication. As a service to our
customers we are providing this early version of the manuscript. The manuscript will undergo copyediting, typesetting, and review of the resulting proof before it is published in its final citable form. Please note that during the production process errors may be discovered which could affect the content, and all legal disclaimers that apply to the journal pertain.
Conflict of interest
The authors declared they do not have anything to disclose regarding conflict of interest with respect to this manuscript.
Disclosure Statement
All authors (Ioannis Andreou, MD, PhD, Saeko Takahashi, MD, Masaya Tsuda, MD, Koki Shishido, MD,Antonios P. Antoniadis,
HHS Public Access
Author manuscript
Atherosclerosis
. Author manuscript; available in PMC 2016 September 24.Published in final edited form as:
Atherosclerosis. 2016 September ; 252: 9–14. doi:10.1016/j.atherosclerosis.2016.07.914.
A
uthor Man
uscr
ipt
A
uthor Man
uscr
ipt
A
uthor Man
uscr
ipt
A
uthor Man
uscr
ipt
0.20, p<0.001) and DES (β: 0.09; 95% CI: 0.07–0.11; p<0.001) implantation. The decrease in PBS area was the most powerful predictor of significant NIH after BMS implantation (odds ratio: 1.13; 95% CI: 1.02–1.26; p=0.02).
Conclusions—The decrease in PBS area after stent implantation is significantly associated with the magnitude of NIH development at follow-up. This finding raises the possibility of a
communication between the lesion within the stent and the underlying native atherosclerotic plaque, and may have important implications regarding the pathobiology of in-stent restenosis and late/very late stent thrombosis.
Keywords
atherosclerosis; plaque; neointimal hyperplasia; neoatherosclerosis; in-stent restenosis; stent thrombosis
1. Introduction
The predictive power of atherosclerotic plaque located behind the stent (PBS) on subsequent neointimal growth and restenosis has been a focus for research over the past two decades. In the early era of percutaneous coronary revascularization, ample evidence showed that the amount of residual atherosclerotic plaque after coronary balloon angioplasty or atherectomy correlates with restenosis rate [1, 2]. In contrast, the role of PBS after coronary stenting remains controversial [3–6].
In-stent restenosis remains a major limitation of bare-metal stents (BMS). While drug-eluting stents (DES) drastically reduce its occurrence, they do not eliminate it [7]. It mainly results from aggressive neointimal hyperplasia (NIH), but recent data also indicate a shift in the underlying pathological substrate toward restenotic lesions with a higher proportion of in-stent atherosclerotic plaque or neoatherosclerosis [8]. The pathogenesis of in-stent atherosclerosis development is poorly understood.
The present post hoc analysis of Prediction of Progression of Coronary Artery Disease and Clinical Outcome Using Vascular Profiling of Shear Stress and Wall Morphology
(PREDICTION) study offers the opportunity to investigate the natural history of PBS after implantation of BMS compared to sirolimus-eluting (SES) and paclitaxel-eluting (PES) stents and provide insight into its role in neointimal formation.
2. Materials and methods
2.1. Study populationWe analyzed the data of patients enrolled in the PREDICTION study [9], a prospective, multicenter study investigating the role of endothelial shear stress and vascular remodeling in the anatomic natural history of coronary atherosclerosis in patients presenting with an acute coronary syndrome. The patients underwent intracoronary vascular profiling with intravascular ultrasound (IVUS) and angiography of all major coronary arteries at the time of percutaneous coronary intervention. A large subset of consecutive, unselected patients underwent routine follow-up vascular profiling after 6–10 months to assess the anatomic
A
uthor Man
uscr
ipt
A
uthor Man
uscr
ipt
A
uthor Man
uscr
ipt
A
uthor Man
uscr
ipt
natural history in relation to antecedent vascular characteristics. The study was performed in Japanese clinical sites because patients routinely undergo follow-up catheterization after successful percutaneous coronary intervention for an acute coronary syndrome, and this clinical practice facilitated the performance of a large natural history study. The
PREDICTION study found that new cardiac events (primarily requirement of a percutaneous coronary intervention for rapid progression of luminal obstruction), were correlated with a large plaque burden, but observed as well that local low endothelial shear stress was also an independent determinant of new cardiac events. The study population of the present analysis consisted of 157 patients with available serial (post-stenting and at 6–10-month follow-up) angiographic and IVUS data, who underwent BMS, SES (Cypher, Cordis, Johnson & Johnson, Miami Lakes, FL), or PES (Taxus, Boston Scientific Corporation, Natick, MA) implantation for culprit or non-culprit native de novo lesions (study flowchart in
Supplemental Fig. 1). The selection of stents depended on the operator’s decision and local hospital policy. Inclusion criteria of PREDICTION study included age >18 years and presentation with an acute coronary syndrome requiring percutaneous coronary intervention. Exclusion criteria included heart failure New York Heart Association class III/IV, unstable clinical status, left main or 3-vessel coronary artery disease, significant coronary
calcification precluding IVUS evaluation, renal failure such that additional contrast material would be contraindicated, clinically significant valvular disease, and life expectancy <12 months. The study protocol was approved by the ethics review committees at each participating center and all patients signed written informed consent before enrollment.
2.2. Three-dimensional coronary artery reconstruction procedure and analysis
The vascular profiling procedure was performed to reconstruct the coronaries arteries in three-dimensional (3D) space [9]. In brief, the 3D anatomy of the stented coronary artery was reconstructed from two planes of coronary angiography and electrocardiographically gated IVUS images (Galaxy IVUS system with the Atlantis 40 MHz SR Pro IVUS catheter, Boston Scientific, Natick, MA) performed with automated pullback at 0.5 mm/sec. The arterial lumen and outer vessel wall (area within the external elastic membrane [EEM]) were reconstructed from digitized and segmented end-diastolic IVUS frames, using a semi-automated system to trace the lumen and EEM borders. Each frame was aligned
perpendicular to the catheter core. The boundary points of each frame were connected by spline curves to rebuild the luminal and outer vessel wall geometry in 3D space. In the stented regions, the stent borders were manually traced in digitized and segmented end-diastolic IVUS frames and the 3D geometry of the stent was then reconstructed. The 3D geometry of the neointima was taken as the difference between the stent and the lumen. We divided the entire 3D-reconstructed stented artery into consecutive 1.5-mm segments. For analysis of serial anatomic changes, each arterial segment at baseline was compared with the identical segment at follow-up. Segments with incomplete apposition, defined as a
separation of at least one stent strut from the intimal surface of the arterial wall, were excluded from analysis (193 segments). The following measurements were obtained for each segment: (i) lumen area, (ii) stent area, (iii) vessel (EEM) area, (iv) neointimal area (stent area minus lumen area), and (v) PBS (plaque plus media) area (vessel area minus stent area). Change (Δ) in each parameter was provided as follow-up minus baseline measurement. Due to the very low rate of adverse events in our low-risk population we used significant NIH
A
uthor Man
uscr
ipt
A
uthor Man
uscr
ipt
A
uthor Man
uscr
ipt
A
uthor Man
uscr
ipt
(defined as neointimal area >50% of stent area) as a binary anatomic outcome.
Reproducibility and validation of IVUS measurements have been previously reported [10].
2.3. Statistical analysis
Continuous variables with normal and non-normal distribution are expressed as mean±SD and median and interquartile range (IQR), respectively. Categorical variables are presented as counts (percentages) and compared using the chi-square test. Analyses of area
comparisons were performed on a per-segment basis. The association of continuous response variables with categorical variables was evaluated by implementing mixed-effects analysis of variance with the patient designated as random effects to account for within-subject correlation due to the analysis of multiple segments in a single patient. Probability values were adjusted for multiple comparisons with the use of the Scheffé method. Linear mixed modeling was used to investigate the relationship between continuous response variables and continuous predictors. The association of binary response variable with baseline variables was evaluated by mixed-effects logistic regression. Factors entered into the univariable analysis included baseline vessel, lumen, and PBS areas and their respective changes from baseline to follow-up. Variables associated with anatomic outcomes on univariable analysis at p level <0.1 were considered for entry in the respective multivariable models, and non-significant variables were dropped by means of backward selection. Clinical variables (e.g., diabetes mellitus, statin use) were not associated with ΔPBS area and were, therefore, excluded from multivariable models. A value of p<0.05 was considered statistically significant.
3. Results
3.1. Patient and lesion characteristics
Patient characteristics are summarized in Table 1. Age, gender, and coronary risk factors were not different among stent groups. Moreover, comparable baseline demographic data indicate that the data in the present analysis are representative of the PREDICTION population. As shown in Table 2, the prevalence of underlying culprit lesion was higher in BMS than in SES and PES groups (89.9% vs. 54.4% vs. 48.4%, respectively; p<0.001). Stent lengths were shorter in BMS compared to SES and PES groups (19 mm [IQR: 16–26 mm] vs. 22 mm [IQR: 17–29 mm]) vs. 21 mm [IQR: 17–28 mm], respectively; p=0.02).
3.2. Quantitative IVUS data
Tables 3 and 4 present quantitative IVUS parameters post-procedure and at follow-up analyzed on a per-segment basis. Segments with BMS implantation were negatively remodeled during follow-up (−1.7%; IQR: −10.0–6.0%; p<0.001), while DES segments exhibited outward remodeling (4.1%; IQR: −3.6–13.4%; p<0.001). There was a significant decrease in PBS area after BMS (−7.2%; IQR: −19.3–5.2%; p<0.001) and a significant increase after DES implantation (5.7%; IQR: −4.6–16.9% for SES and 9.0%; IQR: −9.4– 29.5% for PES; p<0.001 for both). The difference in ΔPBS area remained significant in BMS vs. DES irrespective of lesion type and location with the exception of lesions in left circumflex that did not reach statistical significance (Supplemental Fig. 2A and B). There was no significant difference in ΔPBS area between SES and PES (p=0.13). Moreover,
A
uthor Man
uscr
ipt
A
uthor Man
uscr
ipt
A
uthor Man
uscr
ipt
A
uthor Man
uscr
ipt
neointimal area increased significantly in BMS and PES groups, but not in SES
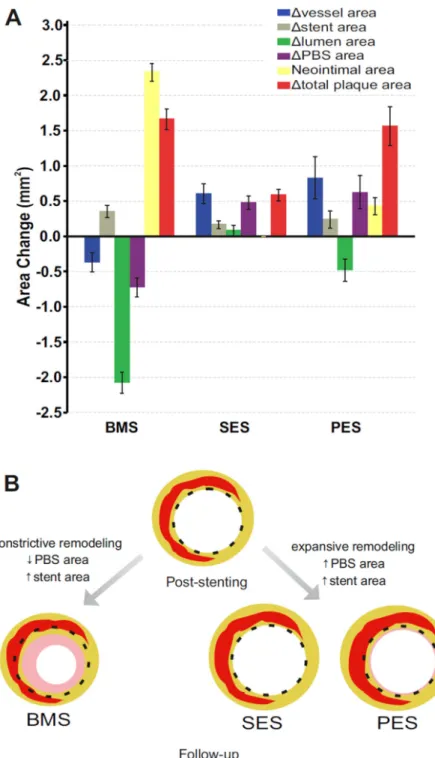
(BMS>PES>SES; p<0.001 for all comparisons). Of note, 77.7% of SES segments had no NIH at follow-up. The lumen area decreased at follow-up in BMS and PES groups, but not in SES group (BMS>PES>SES; p<0.001 for all comparisons). Regarding the total plaque area (i.e., sum of PBS area plus neointimal area), we observed significant increases in all 3 groups (BMS>SES; p<0.001, PES>SES; p<0.001, BMS=PES; p=0.42). Overall, the above mentioned differences in quantitative IVUS parameters were significantly different in BMS compared to entire DES group (Table 3). When comparing SES with PES, the area changes were similar except for the changes in neointimal, lumen, and total plaque areas (Table 4). Fig. 1A illustrates the natural history of vascular responses after stent implantation in all groups.
3.3. Relationship of changes in PBS area with neointimal area in BMS and DES
Multiple linear regression mixed modeling identified ΔPBS area (per mm2 decrease) as an independent predictor of neointimal area at follow-up after controlling for baseline vessel and lumen areas in BMS (β: 0.15; 95% confidence interval [CI]: 0.10–0.20; p<0.001), SES (β: 0.03; 95% CI: 0.02–0.04; p<0.001), and PES (β: 0.18; 95% CI: 0.12–0.24; p<0.001) (Supplemental Table 1). In addition, logistic mixed modeling revealed ΔPBS area (per mm2 decrease) as the most powerful predictor of significant NIH development at follow-up in BMS (odds ratio [OR]: 1.13; 95% CI: 1.02–1.26; p=0.02), while it showed a trend toward being an independent predictor of significant NIH in PES (OR: 2.04; 95% CI: 0.91–4.57; p=0.08) (Supplemental Table 2). SES segments were excluded from latter analysis as no segment demonstrated significant NIH at follow-up. Supplemental Tables 3 and 4 present the changes in IVUS parameters according to PBS area changes and NIH development during follow-up, respectively.
4. Discussion
The main findings of this study are as follows: (i) PBS significantly decreases after BMS implantation, whereas it increases after DES implantation irrespective of underlying lesion type and location; (ii) the changes in PBS are associated with parallel constrictive peri-stent remodeling in BMS and expansive remodeling in DES; and (iii) the decrease in PBS area is significantly associated with the extent of neointimal area at follow-up after BMS and DES implantation. Taken together, this continuum suggests a unified mass effect and
communication within the lesion where cells and tissue elements shift between the stent struts (Fig. 1B).
4.1. Role of PBS in neointimal formation
The role of intimal proliferation in restenosis after stent implantation has become the focus of much research. The contribution of PBS per se to the neointimal proliferative process following percutaneous coronary interventions is poorly understood. In the pre-stent era, residual atherosclerotic plaque assessed at the end of interventional procedures (e.g., balloon angioplasty, coronary atherectomy) appeared to be a consistent and independent predictor of subsequent restenosis [1]. Early evidence suggested that a positive correlation between the amount of residual PBS and the amount of late neointimal tissue growth also applied in the
A
uthor Man
uscr
ipt
A
uthor Man
uscr
ipt
A
uthor Man
uscr
ipt
A
uthor Man
uscr
ipt
context of bare-metal stenting [3]. These intriguing observations raised the possibility that the bulk of the intimal proliferation may be occurring at the original site of the lesion and led to an initial enthusiasm for plaque removal by adjunctive atherectomy before BMS
implantation with results pointing to a reduction in the incidence of in-stent restenosis [11]. Nevertheless, the role of PBS remained controversial, as there were also studies reporting no association between post-BMS placement PBS and neointimal tissue growth [4, 12]. On the other hand, IVUS analyses in the DES era supported the notion that late in-stent neointimal proliferation is not related to the amount of residual PBS after DES implantation [5]. It was hypothesized that the eluted drug negates the impact of PBS on NIH. However, it has also been reported that post-intervention PBS was a predictor of NIH two years after DES placement [6].
Our results indicate that the decrease in PBS area during follow-up is an important determinant of the neointimal area after BMS and DES placement. There are several potential mechanisms by which the native plaque could affect post-stenting neointimal formation. The underlying atherosclerotic plaque may be a source for cells, growth factors, and chemoattractants contributing to neointimal lesion and restenotic process. Smooth muscle and inflammatory cells, mainly monocytes, are the predominant cells involved in this process. Conversely, the native plaque may be a physical barrier that prevents rupture of the internal elastic lamina caused by stent struts and, therefore, attenuate neointimal formation. It is plausible that these opposite effects counteract each other, leading, at least partly, to the disparity in IVUS findings. Compared to previous studies, we undertook a more
comprehensive approach to examine the potential role of PBS taking into account the simultaneous accompanying changes in neointimal tissue and vessel area. Taken together, our findings support the idea that luminal dimensions after coronary stenting are determined by the combined effects of PBS, NIH, and remodeling forces. The decrease in PBS area after BMS implantation suggests that, as the underlying plaque progresses, it may expand across the stent struts, while the increase in PBS area after DES implantation suggests that the native atherosclerotic plaque continues to progress outwardly. The observed differential PBS changes after stent implantation provide insights into its biological effects and ultimately possible effect on clinical outcomes in BMS versus DES.
4.2. Vascular remodeling after stent implantation
Although BMS implantation eliminates the issue of immediate elastic recoil, it does not limit constrictive remodeling, as shown in our study, suggesting that the arterial wall may be squeezed through the stent strut interstices. In contrast, in line with our results, significantly increased vessel and plaque volume has been reported after DES placement [5]. Although the mechanism underlying positive vessel remodeling after DES and its impact on clinical outcome is still unclear, it has been assumed that expansive remodeling could be a reactive process to accommodate stent-related neointimal tissue proliferation and PBS progression to prevent restenosis. This may be analogous to arterial remodeling in the early atherosclerotic disease process, in which plaque accumulation is compensated for by an increase of total vessel area, and lumen area is usually not compromised until plaques are large.
Alternatively, one could hypothesize that DES constitute a ‘barrier’ that prevents the inward
A
uthor Man
uscr
ipt
A
uthor Man
uscr
ipt
A
uthor Man
uscr
ipt
A
uthor Man
uscr
ipt
expansion of atherosclerotic tissue, which expands in an outward fashion leading to positive remodeling.
4.3. Implications for in-stent restenosis and stent thrombosis
To date, the mechanisms and characteristics of luminal narrowing after stent implantation have not been fully understood. The present study strongly implies that the progression of the underlying plaque between stent struts may contribute to neointimal formation and restenosis. In this context, the question is raised whether this potential atherosclerotic tissue shift after stent placement may also be responsible for neoatherosclerosis. This disease entity has been reported in both BMS and DES, but the underlying mechanisms remain unknown [8]. Based on our findings, we hypothesize that it may involve, at least partly, the
progression of underlying residual atherosclerotic plaque in the native artery. In the same manner, PBS may progress after stent placement and might eventually rupture, thus,
resulting in late/very late stent thrombosis. Therefore, a plausible argument can be made that continued atherosclerotic disease activity and progression of PBS between the stent struts may be the missing link between in-stent restenosis and stent thrombosis, and, thus, partly account for a range of causes of late stent failure. This assumption, although speculative, is supported by optical coherence tomography (OCT) observations that challenge the paradigm that in-stent restenosis and stent thrombosis are distinct pathological entities [8, 13].
Interestingly, in a recent study, intensive lipid lowering with statins prevented neointimal growth after DES implantation [14]. Our present observations should be considered hypothesis-generating only and require testing in future studies. Imaging data from IVUS and a high-resolution technique, such as OCT, can be complementary and synergistic in improving our understanding about the role of PBS in these processes.
4.4. Limitations
The PREDICTION study is an observational natural history study with stent selection based on the operator’s decision and policies in different centers. Our findings are based on observations in a relatively small number of patients raising the possibility of selection bias. The results of this study may not be applicable to patients who have developed angiographic restenosis, as none of the patients in the PREDICTION study had >50% diameter stenosis at follow-up angiography. Follow-up was limited to 6–10 months and therefore may not predict findings on later time points. IVUS has intrinsic limitations in its ability to accurately detect mild amounts of neointima. We are also limited by not having radiofrequency IVUS characterization of plaque composition available. Therefore, the current in vivo findings are limited to area comparisons among the groups and do not account for potentially different cellular compositions of the areas around the stent. With the caveat of not analyzing the occurrence of neoatherosclerosis, our findings are provocative worthy of further study. The relevance of our findings to the latest generation devices, such as drug-coated balloons and bioresorbable vascular scaffolds, remains to be determined.
4.5. Conclusions
The present analysis demonstrated differential dynamics of vascular responses following BMS and DES deployment. PBS decreases after BMS implantation and is associated with parallel constrictive remodeling, while it increases after DES implantation and is
A
uthor Man
uscr
ipt
A
uthor Man
uscr
ipt
A
uthor Man
uscr
ipt
A
uthor Man
uscr
ipt
accompanied by expansive remodeling. The reduction in PBS over time significantly correlates with the extent of NIH in both stent types. These findings raise the possibility of a communication between the lesion within the stent and the underlying native atherosclerotic plaque with potential tissue shifts across the stent struts, and may have important
implications regarding the pathobiology of in-stent restenosis and late/very late stent thrombosis.
Supplementary Material
Refer to Web version on PubMed Central for supplementary material.
Acknowledgments
Financial support
This study was supported by Boston Scientific and George D. Behrakis Cardiovascular Research Program.
References
1. Mintz GS, Popma JJ, Pichard AD, et al. Intravascular ultrasound predictors of restenosis after percutaneous transcatheter coronary revascularization. J Am Coll Cardiol. 1996; 27:1678–1687. [PubMed: 8636553]
2. Honda Y, Yock PG, Fitzgerald PJ. Impact of residual plaque burden on clinical outcomes of coronary interventions. Catheter Cardiovasc Interv. 1999; 46:265–276. [PubMed: 10348121] 3. Prati F, Di Mario C, Moussa I, et al. In-stent neointimal proliferation correlates with the amount of
residual plaque burden outside the stent: an intravascular ultrasound study. Circulation. 1999; 99:1011–1014. [PubMed: 10051293]
4. Casserly IP, Aronow HD, Schoenhagen P, et al. Relationship between residual atheroma burden and neointimal growth in patients undergoing stenting: analysis of the atherectomy before MULTI-LINK improves lumen gain and clinical outcomes trial intravascular ultrasound substudy. J Am Coll Cardiol. 2002; 40:1573–1578. [PubMed: 12427408]
5. Tanabe K, Serruys PW, Degertekin M, et al. Chronic arterial responses to polymer-controlled paclitaxel-eluting stents: comparison with bare metal stents by serial intravascular ultrasound analyses: data from the randomized TAXUS-II trial. Circulation. 2004; 109:196–200. [PubMed: 14691036]
6. Kang SJ, Park DW, Mintz GS, et al. Long-term vascular changes after drug-eluting stent
implantation assessed by serial volumetric intravascular ultrasound analysis. Am J Cardiol. 2010; 105:1402–1408. [PubMed: 20451685]
7. Brener SJ, Prasad AJ, Khan Z, et al. The relationship between late lumen loss and restenosis among various drug-eluting stents: a systematic review and meta-regression analysis of randomized clinical trials. Atherosclerosis. 2011; 214:158–162. [PubMed: 21122853]
8. Yahagi K, Kolodgie FD, Otsuka F, et al. Pathophysiology of native coronary, vein graft, and in-stent atherosclerosis. Nat Rev Cardiol. 2016; 13:79–98. [PubMed: 26503410]
9. Stone PH, Saito S, Takahashi S, et al. Prediction of progression of coronary artery disease and clinical outcomes using vascular profiling of endothelial shear stress and arterial plaque characteristics: the PREDICTION Study. Circulation. 2012; 126:172–181. [PubMed: 22723305] 10. Coskun AU, Yeghiazarians Y, Kinlay S, et al. Reproducibility of coronary lumen, plaque, and
vessel wall reconstruction and of endothelial shear stress measurements in vivo in humans. Catheter Cardiovasc Interv. 2003; 60:67–78. [PubMed: 12929106]
11. Moussa I, Moses J, Di Mario C, et al. Stenting after optimal lesion debulking (sold) registry. Angiographic and clinical outcome. Circulation. 1998; 98:1604–1609. [PubMed: 9778324]
A
uthor Man
uscr
ipt
A
uthor Man
uscr
ipt
A
uthor Man
uscr
ipt
A
uthor Man
uscr
ipt
12. Hoffmann R, Mintz GS, Popma JJ, et al. Chronic arterial responses to stent implantation: a serial intravascular ultrasound analysis of Palmaz-Schatz stents in native coronary arteries. J Am Coll Cardiol. 1996; 28:1134–1139. [PubMed: 8890806]
13. Lee SY, Hur SH, Lee SG, et al. Optical coherence tomographic observation of in-stent
neoatherosclerosis in lesions with more than 50% neointimal area stenosis after second-generation drug-eluting stent implantation. Circ Cardiovasc Interv. 2015; 8:e001878. [PubMed: 25613674] 14. Jang JY, Kim JS, Shin DH, et al. Favorable effect of optimal lipid-lowering therapy on neointimal
tissue characteristics after drug-eluting stent implantation: qualitative optical coherence tomographic analysis. Atherosclerosis. 2015; 242:553–559. [PubMed: 26318104]
A
uthor Man
uscr
ipt
A
uthor Man
uscr
ipt
A
uthor Man
uscr
ipt
A
uthor Man
uscr
ipt
• Atherosclerotic plaque behind the stent (PBS) changes after stent implantation
• PBS decreases after bare-metal (BMS) implantation, whereas it increases after first-generation first-generation drug-eluting stent (DES) implantation
• PBS area decrease is associated with an increase in neointimal area
• PBS plays a role in neointimal formation after stent implantation
• PBS may be implicated in stent restenosis and thrombosis
A
uthor Man
uscr
ipt
A
uthor Man
uscr
ipt
A
uthor Man
uscr
ipt
A
uthor Man
uscr
ipt
Fig. 1. Vascular responses after bare-metal (BMS), sirolimus-eluting (SES), and paclitaxel-eluting (PES) stent implantation
(A) Changes in quantitative intravascular ultrasound parameters between post-procedure examination and follow-up. Bars represent median and 95% confidence interval around the median. (B) Simplified schematic representation of the natural history of vascular responses after stent placement. In-stent lesion composition at follow-up consists of neointimal tissue (pink color) as a wound healing response to vascular injury, and fibrous tissue (yellow color)
A
uthor Man
uscr
ipt
A
uthor Man
uscr
ipt
A
uthor Man
uscr
ipt
A
uthor Man
uscr
ipt
and atherosclerotic tissue (red color) as a result of the communication with the underlying native atherosclerotic plaque across the stent struts. PBS: plaque behind the stent.
A
uthor Man
uscr
ipt
A
uthor Man
uscr
ipt
A
uthor Man
uscr
ipt
A
uthor Man
uscr
ipt
A
uthor Man
uscr
ipt
A
uthor Man
uscr
ipt
A
uthor Man
uscr
ipt
A
uthor Man
uscr
ipt
T ab le 1 P atient characteristics. BMS (n=80) SES (n=60) PES (n=26) p V alue All patients (n=374) Age, yr 63.0±10.8 65.5±9.6 67.3±7.6 0.11 64.4±11.1 Male 60 (75.0) 49 (81.7) 19 (73.1) 0.51 298 (79.7) Hypertension 47 (58.8) 39 (65.0) 14 (53.8) 0.41 237 (63.4) Dyslipidemia 67 (83.8) 54 (90.0) 21 (80.8) 0.39 319 (85.3) LDL >100 mg/dL 65 (81.2) 51 (85.0) 21 (80.8) 0.62 324 (86.6) HDL <40 mg/dL 37 (46.2) 31 (51.7) 12 (46.2) 0.42 171 (45.7) Diabetes mellitus 22 (27.5) 20 (33.3) 7 (26.9) 0.40 132 (35.3) Insulin dependent 4 (5.0) 3 (5.0) 1 (3.8) 0.62 31 (8.3) F amily history 5 (6.3) 3 (5.0) 2 (7.7) 0.58 24 (6.4) Prior MI 4 (5.0) 2 (3.3) 1 (3.8) 0.50 26 (7.0) Prior PCI 5 (6.3) 3 (5.0) 1 (3.8) 0.34 35 (9.4) Statin use 54 (67.5) 41 (68.3) 19 (73) 0.42 262 (70.0)Data are mean±SD or n (%). P
atients treated with >2 types of stent in dif
ferent lesions were included in each corresponding group.
BMS: bare-metal stent; LDL: lo
w-density lipoprotein; HDL: high-density lipoprotein; MI: myocardial inf
arction; PCI: percutaneous coronary interv
ention; PES: paclitax
el-eluting stent; SES:
A
uthor Man
uscr
ipt
A
uthor Man
uscr
ipt
A
uthor Man
uscr
ipt
A
uthor Man
uscr
ipt
Table 2 Lesion characteristics. BMS (n=89) DES p Value BMS vs. DES SES (n=68) PES (n=31) Lesion type Culprit lesion 80 (89.9) 37 (54.4) 15 (48.4) <0.001 Non-culprit lesion 9 (10.1) 31 (45.6) 16 (51.6) Lesion location LAD 51 (57.3) 42 (61.8) 19 (61.3) 0.13 RCA 25 (28.1) 10 (14.7) 4 (12.9) LCX 13 (14.6) 16 (23.5) 8 (25.8) Proximal lesion 47 (52.8) 32 (47.1) 14 (45.2) 0.57 Mid/distal lesion 42 (47.2) 36 (52.9) 17 (54.8) Stent length, mm 19 (16–26) 22 (17–29) 21 (17–28) 0.02Data are n (%) or median and interquartile range.
BMS: bare-metal stent; DES: drug-eluting stent; LAD: left anterior descending; LCX: left circumflex; PES: paclitaxel-eluting stent; RCA: right coronary artery; SES: sirolimus-eluting stent.
A
uthor Man
uscr
ipt
A
uthor Man
uscr
ipt
A
uthor Man
uscr
ipt
A
uthor Man
uscr
ipt
T ab le 3 Quantitati v e IVUS data in BMS vs. DES group. BMS (89 Stents, 1262 Segments) DES (99 Stents, 1553 Segments) p V alue BMS vs. DES Baseline F ollo w-up p V alue Baseline F ollo w-up p V alue V essel area, mm 2 20.46 (16.76–25.33) 19.72 (16.53–24.66) <0.001 16.92 (14.04–20.89) 17.68 (14.67–21.44) <0.001 <0.001 Stent area, mm 2 9.99 (8.12–12.23) 10.28 (8.48–12.81) <0.001 8.46 (6.95–10.03) 8.72 (7.15–10.41) <0.001 0.15 Lumen area, mm 2 9.99 (8.12–12.23) 7.49 (5.87–9.64) <0.001 8.46 (6.95–10.03) 8.26 (6.67–9.99) <0.001 <0.001 PBS area, mm 2 10.67 (8.01–13.55) 9.53 (7.42–12.15) <0.001 8.50 (6.37–10.97) 9.01 (6.99–11.22) <0.001 <0.001 Neointimal area, mm 2 2.33 (1.11–3.71) 0.00 (0.00–0.38) <0.001 Total plaque area
a , mm 2 10.67 (8.01–13.55) 12.13 (9.87–15.44) <0.001 8.50 (6.37–10.97) 9.42 (7.28–11.79) <0.001 <0.001
Data are median and interquartile range. a Represents the sum of PBS and neointimal areas. BMS: bare-metal stent; DES: drug-eluting stent; IVUS: intra
v
A
uthor Man
uscr
ipt
A
uthor Man
uscr
ipt
A
uthor Man
uscr
ipt
A
uthor Man
uscr
ipt
T ab le 4 Quantitati ve IVUS data in SES
vs. PES group. SES (68 Stents, 1068 Segments) PES (31 Stents, 485 Segments) p V alue SES vs. PES Baseline F ollo w-up p V alue Baseline F ollo w-up p V alue V essel area, mm 2 17.15 (14.13–20.90) 17.81 (14.53–21.70) <0.001 16.35 (13.84–20.71) 17.37 (14.98–20.85) <0.001 0.15 Stent area, mm 2 8.51 (7.07–10.07) 8.78 (7.20–10.52) <0.001 8.34 (6.71–9.88) 8.58 (7.09–10.08) <0.001 0.63 Lumen area, mm 2 8.51 (7.07–10.07) 8.69 (6.99–10.31) <0.001 8.34 (6.71–9.88) 7.74 (6.14–8.98) <0.001 <0.001 PBS area, mm 2 8.75 (6.52–10.96) 9.53 (7.42–12.15) <0.001 8.01 (5.79–11.11) 9.01 (6.99–11.22) <0.001 0.13 Neointimal area, mm 2 0.00 (0.00–0.00) 0.43 (0.15–1.39) <0.001 T
otal plaque area
a , mm 2 8.75 (6.52–10.96) 9.22 (7.17–11.39) <0.001 8.01 (5.79–11.11) 9.71 (7.74–12.57) <0.001 <0.001
Data are median and interquartile range. a Represents the sum of PBS and neointimal areas. IVUS: intra
v
ascular ultrasound; PBS: plaque behind the stent; PES: paclitax