HAL Id: hal-02954755
https://hal.inrae.fr/hal-02954755
Submitted on 1 Oct 2020
HAL is a multi-disciplinary open access
archive for the deposit and dissemination of
sci-entific research documents, whether they are
pub-lished or not. The documents may come from
teaching and research institutions in France or
abroad, or from public or private research centers.
L’archive ouverte pluridisciplinaire HAL, est
destinée au dépôt et à la diffusion de documents
scientifiques de niveau recherche, publiés ou non,
émanant des établissements d’enseignement et de
recherche français ou étrangers, des laboratoires
publics ou privés.
Flexibility of Waste Resource Recovery Facilities for
water Reuse
Farouk Aichouche, Boumediéne Benyahia, Marc Heran, Jérôme Harmand
To cite this version:
Farouk
Aichouche,
Boumediéne
Benyahia,
Marc
Heran,
Jérôme
Harmand.
Flexibil-ity of Waste Resource Recovery Facilities for water Reuse.
2020 European Control
Conference (ECC), https://ecc20.eu/,
May 2020,
Sant Petersburg,
Russia.
pp.570-574,
Flexibility of Waste Resource Recovery Facilities for water Reuse
Farouk Aichouche
1,3, Boumedi´ene Benyahia
3, Marc H´eran
2and J´erˆome Harmand
1Abstract— In this paper, a new flexible wastewater treatment scheme is proposed to be used within the framework of wastewater reuse (REUSE). From a configuration where the water is treated to guarantee normative constraints, we propose a flexible configuration able to adapt, in minimal time, the quality and the quantity of water to usage. In other terms, the proposed scheme is able to treat water for purpose. Using model analysis and simulations, we show how a simulation platform may be used to demonstrate the flexible characteristics of the scheme, in particular when dealing with the decoupling of water fluxes and the different forms of nitrogen contents in the output treated water.
I. INTRODUCTION
Actual wastewater treatment plants (WWTP) aim at trea-ting wastewater in such a way they comply with normative constraints before discharged into environment (rivers lakes etc). However there is the need nowadays for a paradigm shift within the framework of circular economy: from a waste to be treated wastewater can be viewed as new resources to be processed for purpose. To do so, WWTP have to be operated with more ‘flexibility’.
Although intensive attention has been given to WWTP, especially to biological nitrogen and carbon removal pro-cesses [1], a large number of alternative configurations have been proposed [2] in order to improve the performance of the treatment either in terms of cost [7] or in terms of quality [6]. In any case, the configuration should contain an aerobic capacity to promote the nitrification while an anoxic zone must be used to promote denitrification. The two-steps nitrification-denitrification process revealed to be the most economical viable for the total elimination of nitrogen and carbon.
Conventional WWT is accomplished by combining denitri-fication and nitridenitri-fication steps requiring oxygen and organic carbon, respectively. The separation of conditions may be done in time or in space by imposing sequentially anoxic and aerobic conditions in a single reactor [9], or, by having a minimum of 2 reactors of which one is maintained anoxic and the other aerobic. The pre-denitrification and the post-denitrification configurations are the most widespread [8]. In the pre-denitrification design, the anoxic tank is placed upstream of the aerobic reactor in order to use the carbon present in the effluent for the denitrification. Therefore,
1F. Aichouche and J. Harmand are with LBE, Univ
Montpel-lier, INRA, Narbonne, Franceaichouche.farouk@gmail.com, jerome.harmand@inra.fr
2M. H´eran is with IEM, Univ Montpellier, Montpellier, France
marc.heran@umontpellier.fr
3B. Benyahia and F. Aichouche are with Laboratory of
Automa-tic Control, Faculty of Technology, University of Tlemcen, Algeria
b.benyahia.ut1@gmail.com
nitrified liquor recycling to the anoxic reactor is needed to recirculate nitrate from the aerobic reactor. In the post-denitrification configuration, the anoxic tank is placed down-stream of the aerobic reactor. This configuration allows a better nitrate removal efficiency than the pre-denitrification process. However, since carbon source is consumed in the aerated tank, it may become limiting in the anoxic reactor. Therefore, the addition of carbon source may be required in order to achieve an efficient denitrification.
The flexibility concept in WWTP relates to its capacity to adjust - as quickly as possible - to changes in demand, corresponding for instance to plant needs within the con-text of treated wastewater reuse. On one side, the flexible configuration allows to operate the WWTP in a mode to eliminate the components from wastewater or, on the other side, to keep nutrients or to decouple the water content from the water quantity (play with nutrient contents in the output effluent). In classical configurations, the nitrogen in ammoniacal form (NH4+) is oxidized into nitrates (NO−3) and then reduced into nitrogen gas (N2). In a flexible system, it is expected that the level of the different forms of nitrogen may be adjusted with respect to agriculture requirements. for instance, in some cases, the ammoniacal form of nitrogen (NH4+) will be favored while in others the nitrate form will be preferred. Moreover, keeping (NH4+) requires lower energy consumption than when water is treated to provide nitrates (NO−3). Indeed, performing nitrification requires much more energy because nitrifying bacteria need more time to develop and thus induce a higher oxygen consumption. However,the ammoniacal nitrogen is not directly assimilable by plants: microorganisms in the soil are responsible for transforming (NH4+) into (NO−3) that are more bioavailable.
In the present paper, a new flexible configuration is suggested in the aim to control the transition between the conventional treatment (full treatment mode) and the adaptive treatment (reuse mode) by considering different scenarios. Our first objective is to analyze the best combination between valves positions, recirculation flows and sludge age for each ope-ration mode, and to use this different degrees of freedom to minimize the time response to go from one mode to another one. When designed with the concern of recovering material and/or energy from a given effluent, a WWTP is renamed WRRF for Waste Resource Recovery Facilities. From now and upward, we will thus use WRRF instead of WWTP.
II. AFLEXIBLE PLATFORM OFWRRF A. Platform description
The flexible platform configuration consists of an anoxic tank (V4 = 56 L) followed by aerobic tank (V5 = 56L)
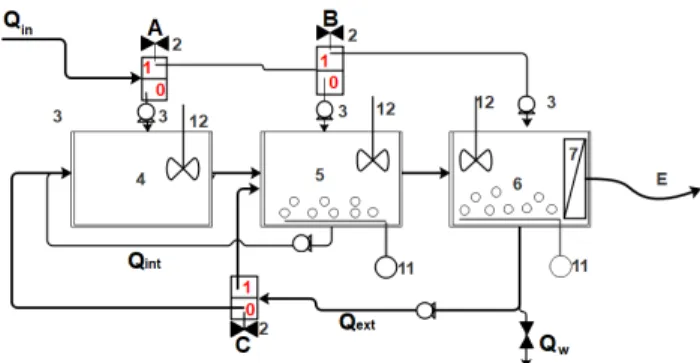
Fig. 1. Schematic diagram of the flexible platform. Qin. influent; 2. Two
position valve (position 1 or 0); 3. feed pump; 4. Anoxic tank; 5. Aerobic tank; 6. Aerobic tank; 7.Perfect membrane; E. Effluent; Qint. Internal
sludge recycling; Qext. external sludge recycling; 11. Air compressor; 12.
Mechanical mixer; Qw. Waste sludge.
TABLE I
CONSTANT INFLUENT CHARACTERISTICS
Symbol Variable Value Unit SI,in Inert organic matter 21.75 mgCOD.L−1
SS,in Readily biodegradable substrate 98 mgCOD.L−1
XI,in Particulate inert organic matter 29 mgCOD.L−1
XS,in Slowly biodegradable substrate 112 mgCOD.L−1
XBH,in Active heterotrophic biomass 0 mgCOD.L−1
XAOB,in Active Nitrosomonas biomass 0 mgCOD.L−1
XNOB,in Active Nitrobacter biomass 0 mgCOD.L−1
XP,in Particulate product 20.22 mgCOD.L−1
SO,in Dissolved oxygen 0 mgO2.L−1
SNO2,in Nitrite nitrogen 0 mgN.L−1
SNO3,in Nitrate nitrogen 0 mgNL−1
SN2,in Nitrogen gas 0 mgN.L−1
SNH,in Ammonia nitrogen 36 mgN.L−1
SND,in Biodegradable organic nitrogen 1.69 mgN.L−1
XND,in Particulate biodegradable nitrogen 0 mgN.L−1
and aerobic tank with membrane (MBR) (V6 = 40 L). The membrane is supposed to be ideal (perfect separation of soluble and particular matters) to promote sludge separation (fouling phenomena were not taken into account). The plant was designed to treat a flow Qin = 270 L/d. The platform (represented in Figure 1) can be operated as a one (only tank 6) - or two (tanks 5 and 6) - or three (Tank 4, 5 and 6) - stage process by adjusting influent feeding location (step feeding) and recirculation rates. Denitrification takes place in the anoxic tank whereas nitrification and carbon oxidation are accomplished in both aerobic and MBR tanks. Since nitrates are not present in the influent, they have to be brought into the anoxic reactor by internal recycling of the nitrified mixed liquor from the aerobic reactor when there is a need to reduce the effluent nitrate. This is done by tuning the external recirculation and playing with the position of the valve ”C”. The waste activated sludge (WAS) flow rate in MBR tank is controlled to reach a specific sludge retention time corresponding to different operation modes (full / Adaptive). The dissolved oxygen (DO) concentration in the aerobic and MBR tank are maintained above 2.0 mg/L, while the DO level of the anoxic tank is supposed to be 0 mg/L. The constant influent characteristics are available in the table I.
B. Model description
The biological reactions inside each reactor in the flexible platform are modeled using ASM1-2ND model [4]. It is a modified version of Activated Sludge Model 1 (ASM1) [3]. The main modification consists in the addition of a two-step process for nitrification and denitrification. While the ASM1 model consider only complete nitrification of ammonia (NH4+) to nitrate (NO−3) by autotrophic bacteria, followed by complete denitrification of nitrate to nitrogen gas, ASM1-2ND uses a 2-steps nitrification model: the nitrification is carried out in two sequential steps, the first one describing the ammonium (NH4+) oxidation to nitrite (NO−2) by Ammonia Oxidizing Bacteria (XAOB) while the second one models the nitrite oxidation (NO−2) into nitrate (NO−3) by Nitrate Oxidizing Bacteria (XNOB). The denitrification is performed following a parallel two-step scheme in which nitrate (NO−3) or nitrite (NO−2) is transformed into gas (N2) by heterotrophic bacteria (XBH).The processes describing the growth of aerobic bacteria are modeled using Monod kinetics and are presented in the equations (1) and (2).
The aerobic growth kinetics of Ammonia Oxidizing Bacteria ρAOB (mg L−1 d−1) is modeled by:
ρAOB= µAOB SNH KNH+ SNH S0 KOA+ SO XAOB (1) The aerobic growth kinetics of Nitrate Oxidizing Bacteria ρNOB (mg L−1 d−1) is modeled by:
ρNOB= µNOB SNO2 KNO2+ SNO2 S0 KOA+ SO KNH SNH+ KNH XNOB (2) Where KOA,KNO2 and KNH are half-saturation rates of oxy-gen, nitrite and ammonium, respectively. µAOB, µNOB are Maximum growth rates of Nitromonas and Nitrobacter, re-spectively.
This model is used for simulating the biological processes that take place in the platform proposed above, in order to predict the growth of bacteria and the resulting consumption of carbon and nitrogen. This is done in taking into account nitrite as an intermediate state variable during the nitrification and denitrification processes.
C. Implementation of WRRF platform
Set-up of the ’simulation platform’ was made under Matlab/Simulink-environment. By using three bioreactor ob-jects, five 2-way flow combiner models, all implemented as C-code S-function objects. The membrane is supposed to be ideal (the effluent does not contain any particulate component). Furthermore, a hydraulic delay model was add (to avoid algebraic loops). and the controllers for internal recirculation flow rate recirculation flow rate with various connections and Valves are integrated.
D. The Solids Retention Time (SRT) control
The SRT is an important design and control parameter for the activated sludge process. It represents the average length of time that bacteria stay in the process before being wasted. The selected SRT directly affects the bacterial composition in
an activated sludge system. In the literature, SRT is usually considered from a steady-state perspective. At steady-state, the static SRT is defined as the mass of microorganisms in the system divided by the mass of microorganisms wasted per time unit:
SRT= XrVr XwQw+ QeXe
(3) Where:
Vr: Total volume of aeration tanks, m3; Xr: Total suspended solids (T SS) concentration in the reactor, mg/L; Xw: Total suspended solids (T SS) concentration in the waste activated sludge, mg/L; Xe: Total suspended solids (T SS) concentrati-on in effluent,mg/L; Qw: Waste activated sludge (WAS) flow rate, m3/d; Qe: effluent flow rate, m3/d
Xe= Xr in completely mixed reactor: SRT= Vr
Qw
(4) The first modeling step consists in determining the initial operating conditions of the WRRF associated with each operation mode:
1) Reuse Mode: It is necessary to find conditions in which the biological treatment will make it possible to preserve the nitrogen under its form NH4+. It means that the sludge age (SRT) must not be too high, so that nitrification will be limiting or it will not take place. The tests are done with a sludge removal rate (SRR), Qw varying between 10 m3/d and 40 m3/d. It is assumed that no oxygen limitation occurs and no nitrite accumulates.
2) Complete treatment Mode: The SRR applied in this mode must make nitrification possible to treat nitrogen. Simulations are made with Qw varying between 0.1 m3/d and 6 m3/d.
III. PLATFORM SIMULATION
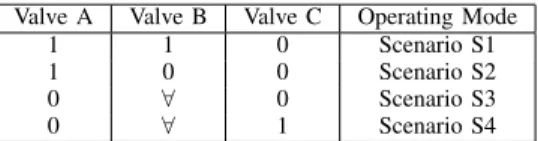
In order to analyze the platform and to determine the best transition strategy from one mode of operation to another in terms of quality and time response, it is necessary to identify the scenarios for each mode of operation. Each scenario represents a mode of operation. To study the transition from one operating mode to another, we study the switch of environmental conditions (positions of valves, values of control signals). Different switches are simulated and the corresponding time responses - corresponding to the time required for the system to switch from one steady state to another one - are observed. It should be noted that the valves in the different configurations are supposed to be all or nothing valves. Each value thus represents a direction of the corresponding fluxes. The first two scenarios are used to model the adaptive treatment (useful for reuse), while the second two scenarios represent the full - or complete - treatment (conventional treatment).
1) Scenario S1: The anoxic and aerobic tanks (4 and 5) are not in operation, whereas the tank 6 is in operation, with the valves positioned at valve A = 1, valve B = 1. The internal and external recirculations are not activated Qext=Qint=0 and sludge extraction from the tank 6 is Qw = 32.4 L/d.
TABLE II
VALVE POSITIONS FOR EACH SCENARIO
Valve A Valve B Valve C Operating Mode 1 1 0 Scenario S1 1 0 0 Scenario S2 0 ∀ 0 Scenario S3 0 ∀ 1 Scenario S4
Remark: The symbol ∀ in Table II is used to designate the fact that the corresponding valve position has no importance: for instance if Valve A equals 0, the position of Valve B does not change anything to the configuration of the platform.
2) Scenario S2: The anoxic tank (4) is not in operation, were the aerobic and MBR tanks (5 and 6) are in operation and aerated, the valves position are: valve A = 1, valve B = 0, valve C = 0. The external recirculation is activated and Qext = 270 L/d while the internal recirculation is not in activated Qint= 0 and sludge extraction from the MBR tank (6) Qw = 32.4 L/d.
3) Scenario S3: During this scenario all tanks (4, 5 and 6) are in operation, the valve A = 1, B = ∀ and C = 0, the flows of internal and external recirculation are active and are directed towards the anoxic basin and sludge extraction from the 6 tank Qw = 1.4 L/d.
4) Scenario S4: In this scenario, the configuration is the same for the scenario S3, except for the valve C, that results in position 1. It means that the returned sludge is oriented to the aerobic tank.
As we will see, the transitions dynamics between the diffe-rent modes of operation depend a lot on the initial conditions. Usually, water for reuse is needed during spring and summer times while complete treatment is required during fall and winter where water should be treated to comply with dischar-ge of water in the environment. To simulate such conditions, we varied the time at which we switch from one operation mode to another one.
During the various simulations carried out, different com-ponents of the effluent are followed, in particular the different forms of nitrogen, as well as the bacterial populations present in the bioreactor.
IV. RESULTS AND DISCUSSION
In the present work the results of simulation will be shown, focusing on the transition from the reuse mode to the full one or vice-versa, and describing the nitrogen dynamic during both modes. The alteration from the reuse to full mode had as goal the reduction of response time and to obtain NO−3 in effluent. On the dissimilarity,when the alteration from the full to reuse one, the objective was to reach a concentration of NH4+ less than 30 mg.N/L.
A. Influence of retention time on reuse mode
Figure 2 shows the transition from the scenario S1 (reuse mode) to the scenario S3 (complete treatment mode). Dif-ferent initial conditions at the time of switching explain the observed difference in time responses: remember that the
Fig. 2. Influence of retention time. Dynamic ammonium (blue), nitrate (green) and nitrite (red) concentrations for transitions at 100 days (conti-nuous line) and at 200 days (dashed line)
XNOBbacteria grow exponentially. At 200 days the transition occurs. At this instant the XNOB biomass concentration is lower than the one when the transition occurs at 100 day (the more the bacteria are subjected to higher wasted sludge flow Qw= 32.4 L/d for prolonged time, the more its concentration are diminished). It should be noted that in practice, such difference may not be observed: depending on the time during which XAOB and XNOB have not been grown under appropriate conditions, they can simply be considered to be absent of the system. In other words, while simulations may consider very small concentration (that may have no physical meanings), XAOB and/or XNOB may have definitely been washed out from the system. We can also note that the duration of partial nitrification is longer in the case where the transition was applied at 200 day because of the growth rate of XAOB bacteria is greater than the growth rate of XNOB bacteria, then the growth of XAOB is faster to XNOB. To simulate realistic situations, such considerations should be studied with care.
B. Influence of returned sludge direction
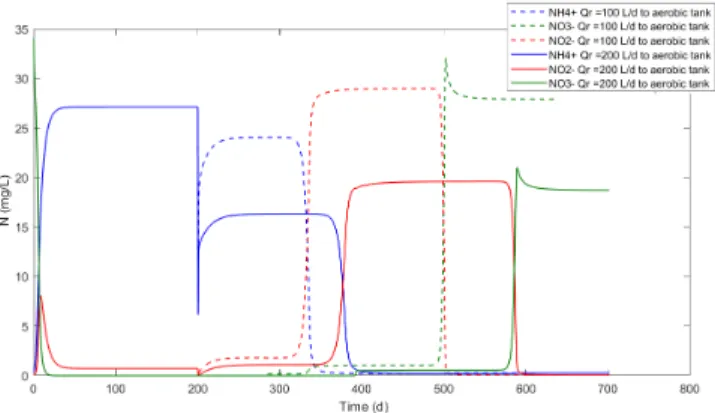
Figure 3 shows the comparison between two transition cases. The first one is the switch from scenario S1 to scenario S3 (dashed line) whilst the second one is the swith from scenario S1 to scenario S4 (continuous line). The first transition occurs 100 days slower than the second one. In the later one the returned sludge was directed to the aerobic tank at the instant of transition. This set-up promotes the nitrifying bacteria growth (XAOB, XNOB), since it reduces the lag phase. On the other hand, in the first transition, the returned sludge was directed to the anoxic tank. In this case, the initial growth of nitrifying bacteria at the transition instant is not encouraged, It leads to an increase in the lag phase. C. Effects of dilution on the returned sludge
The transition from S1 to S4 (from the reuse mode to the full treatment mode) was also simulated in considering two different values of the returned sludge, that were 100 L/d and 270L/d. In Figure 4 the profiles corresponding to this different values of returned sludge were plotted. When the flow of returned sludge equals 100 L/d (dashed line), the time response was shorter than 270 L/d (continuous line). In the same simulations, an increase in total nitrogen concentrations
Fig. 3. Influence of returned sludge direction. Dynamic ammonium (blue), nitrate (green) and nitrite (red) concentrations in the effluent.
Fig. 4. Effects of dilution. Dynamic ammonium (blue) and nitrate (green) and nitrite (red) concentrations in the effluent for returned sludge directed to anoxic tank (dashed line) or to aerobic tank (continuous line).
(NH4+, NO−3 and NO−2) was observed since low returned sludge flow means low dilution rate and more concentrated nutrients. So, in terms of time response the returned sludge equal to 100 L/d seems to be the most important but not in terms in terms of nutrient concentrations in the effluent. In addition, NO−2 is important during partial nitrification, which is problematic given the toxic characteristics of nitrite.
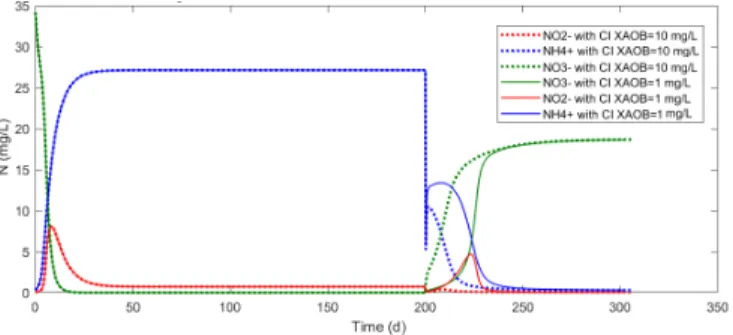
D. Influence of biomass addition on the reduction of respon-se time (bio-augmentation)
The next step is to focus on the use of bio-augmentation (addition of nitrifying bacteria) to minimize the time to switch from scenarios S1 to S4. From a simulation viewpoint, it is equivalent to change initial condition of nitrifying bacteria (XAOB and XNOB) in the reactors according to the following rules:
• XAOB = 10 mg/L; XNOB = 10 mg/L (dashed line in fig 5).
• XAOB = 1 mg/L; XNOB= 1 mg/L (continuous line in fig 5).
In figure 5, both profiles are represented when the added concentration of bacterial is 1 mg/L on both (XAOB and XNOB). A short partial nitrification was observed because of an insufficient concentration of XNOB to obtain a sufficient growth and a full nitrification (NO−2 to NO−3). On the con-trary, with the addition of 10 mg/L, a complete nitrification was observed. The addition of a more important bacterial
Fig. 5. Influence of biomass addition. Ammonium (blue) and nitrate (green) and nitrite (red) concentrations in the effluent for two cases of addition of nitrification bacterial : 10 mg/L (dashed line), 1 mg/L (continuous line)
concentration influenced positively the time response, redu-cing it from 50 days with the addition of 1 mg/L to 30 days with 10 mg/L. The Bio-augmentation is therefore a solution in order to decrease the time response of the system as well as the consequent formation of nitrites.
E. Two cycles simulation of transitions from Reuse to Full treatment
The figure 6 shows two transition cycles from the reuse mode to the complete mode. The first cycle was performed after 100 days of operation to the reuse mode to switch after that to full one again. The second cycle was started after 200 days in this cycle.
The transition from the full to the reuse mode (from scenario S3 to S1) requires a limiting nitrification to obtain some NH4+in the effluent. This transition is fast since it depends only on the time necessary for the nitrifying bacteria to be washed out using the waste sludge flow. This transition is completed in only 15 days (figure 6).
When comparing the observed time responses for all simulated transitions, the addition of biomass (XAOB and XNOB) at the time of transition seems to be the most appropriate strategy. Indeed, autotrophic bacteria and in particular XNOBautotrophs develops very slowly. In addition, when working without bio-augmentation, the risk for nitrite accumulation in the transient is very high.
V. CONCLUSION
A new flexible wastewater treatment configuration was proposed in this paper. The basic objective underlying its design is to improve the transition operation between the re-source recovery mode (Reuse) to the conventional treatment mode (full). In the present study various possible scenarios were discussed with the aim to analyze and design different transition situations. Suitable scenarios were selected for each operating mode in order to determine the best transition to minimize the time response and to ensure effluent quality
Fig. 6. Two cycles simulation of transitions between Reuse and Full treatment : ammonium (blue), nitrate (green) and nitrite (red) concentrations in the effluent
in accordance with agriculture requirements. An improve-ment on the response time by an addition of nitrifying bac-teria was observed. A future work will investigate extensions of the results to take in account a dynamics influent flow with manipulating in different control degree.
REFERENCES
[1] M. Kraume, U. Bracklow, M. Vocks, and A. Drews, Nutrients removal in MBRs for municipal wastewater treatment, Water Sci. Technol., vol. 51, no. 67, pp. 391402, 2005.
[2] R. Hreiz, M. A. Latifi, and N. Roche, Optimal design and operation of activated sludge processes: State-of-the-art.,Chemical Engineering Journal. 2015.
[3] M. Henze and International Water Association, Activated sludge models ASM1, ASM2, ASM2d and ASM3.,Task Group on Mathema-tical Modelling for Design and Operation of Biological Wastewater Treatment.IWA Pub, 2000.
[4] G. S. Ostace, V. M. Cristea, and P. . Agachi Cost reduction of the was-tewater treatment plant operation by MPC based on modified ASM1 with two-step nitrification/denitrification model., Comput. Chem. Eng., 2011.
[5] M. Mulas et al., Predictive control of an activated sludge process: An application to the Viikinmki wastewater treatment plant., J. Process Control, 2015.
[6] R. Van Kempen et al., SHARON process evaluated for improved wastewater treatment plant nitrogen effluent quality., IWA Publishing, 2005.
[7] W. Zarrad, J. Harmand, M. Devisscher, and J. P. Steyer,Comparison of advanced control strategies for improving the monitoring of activated sludge processes., Control Eng. Pract., 2004.
[8] P. S. Barker and P. L. Dold, COD and nitrogen mass balances in activated sludge systems., Water Res., vol. 29, no. 2, pp. 633643, 1995.
[9] G. J. G. Du Toit, M. C. Ramphao, V. Parco, M. C. Wentzel, and G. A. Ekama, Design and performance of BNR activated sludge systems with flat sheet membranes for solid-liquid separation., IWA Publishing, 2007.
VI. ACKOWLEDGEMENTS
Farouk Aichouche is financed by the Islamic Bank of Development. These results are part of the JPI project Control4reuse (cf. http://control4reuse.net) financed by the French Research National Agency under the contract ANR-18-IC4W-0002.