Demand Forecasting at Zara: A Look at Seasonality, Product Lifecycle and
Cannibalization
by Jose M Garcia
B.S. Industrial and Systems Engineering, Georgia Institute of Technology, 2008
Submitted to the Engineering Systems Division and the MIT Sloan School of Management in Partial Fulfillment of the Requirements for the Degrees of
Master of Science in Engineering Systems and
Master of Business Administration
In conjunction with the Leaders for Global Operations Program at the Massachusetts Institute of Technology
June 2014
MASSACHUSETTS INSTrnFTE OF TECHNOLOGY
JUN
13
2014
LIBRARIES
@ 2014 Jose M. Garcia. All right reserved.The author hereby grants to MIT permission to reproduce and to distribute publicly paper and electronic copies of this thesis document in whole or in part in any medium now known or hereafter.
Signature redacted
Signature of Author
MIT Engineeri ystemsivis , MIT Sloan School of Management
Signature redacted
May9'2014Certified by
r
W Josef Oehmen, Thesis Supervisor4ssociate Professor, Department of Management Engineering Technical University of Denmark
Signature redacted1
Read by
Certified by
Accepted by
Accepted by
Warren Seering, Thesis Reader Weber-Shaughness Professor of Mechanical E ineering and Engineering Systems MIT School of Engineering
Signature redacted.
Georgia Perakis, Thesis Supervisor William F. Pounds Professor of Operations Research and Operations Management
Signature
redacted
MIT Sloan School of ManagementRichard C. Larson Mitsui Professor of Engineering Systems Chair, Engineering Systems Division Education Committee
Signature redacted______
l-aura I-e'rson, Director-oTMIT Sloan MBA Program
*1 D~
Demand Forecasting at Zara: A Look at Seasonality, Product Lifecycle and
Cannibalization
by Jose M Garcia
Submitted to the MIT Engineering Systems Division and the MIT Sloan School of Management on May 9, 2014 in Partial Fulfillment of the Requirements for the Degrees of Master of Science in
Engineering Systems and Master of Business Administration.
Abstract
Zara introduces 10,000 new designs every year and distributes 5.2 million clothing articles per week to a network of over 1925 stores in more than 86 countries. Their high product mix and vast global network makes demand forecasting for Zara a challenging endeavor. This thesis sets out to incorporate the effects from seasonality, product lifecycle, and cannibalization into a long term aggregate demand forecast and a short term SKU replenishment forecast.
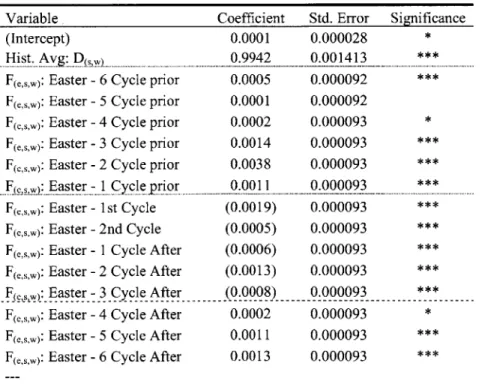
For seasonality, there are two categories of events that are explored in detail: 1) Macro patterns, which are the year to year sales patterns that remain fairly consistent, such as rising sales in spring; and, 2) Specific Events, which refers to events that have an impact on demand but shift dates from one year to the next, such as Easter or Ramadan. These two factors are used to forecast short and long term aggregated store demand by using regression that leverages historical demand with dummy variables for specific events.
Product lifecycle and cannibalization are incorporated in the SKU demand forecast. Products at Zara experience a majority of their sales in the first few weeks in the store. For this reason, when
forecasting demand for replenishment purposes, it is of paramount importance to understand: 1) How long the item has been in a store; and, 2) how many new items are being displayed for the first time at the store on the week in question. This thesis details a methodology that successfully uses regression to incorporate both of those components.
In addition to detailing the methods for-forecasting demand this thesis also covers: an overview of the current forecasting methodology and the special characteristics of Zara's demand; a results section which detail reductions in forecast error from 21% to 17%. This has the potential to reduce lost sales by 24%; lastly, it details implementation efforts at Zara.
Thesis Supervisor: Josef Oehmen
Associate Professor, Department of Management Engineering, Technical University of Denmark Thesis Reader: Warren Seering
Weber-Shaughness Professor of Mechanical Engineering and Engineering Systems, MIT Thesis Supervisor: Georgia Perakis
Acknowledgements
The opportunity to work on this thesis was made possible by the committed partnership that Zara and MIT LGO have developed since 2006. First and foremost I would like to thank Zara's distribution department for giving me the opportunity to work on a problem that is so central to their daily operations. From the first day, I received the full support from the distribution and information systems personnel assigned to the project and was given the liberty and luxury to focus solely on the project. The opportunity to spend 6 months working at one of the world's most revered operations
companies in the world while immersing myself in the rich Galician culture is an experience I will cherish for the rest of my life.
I am forever grateful to my supervisor and friend Martin N6voa Vidal who carefully explained the intricacies of Zara's distribution process with the aid of countless hand-drawn, and spectacular, pictures. I would also like to praise the attention and effort that Alberte Dapena gave to the project as he provided every bit of data I requested and reorganized it as many times as it was necessary in order
for me to be able to process it on my work station. Special thanks are also warranted to Jose Manuel Corredoira Corras for his ingenuity in finding data sources and for his programming prowess to help me automate my programs. Endless thanks to Ivan Escudero Rial for championing my project and providing every resource I needed throughout the project and pushing me to develop the best model possible. Many thanks to Miguel Astor for his insights on which calendar events had significant
impact on demand. And, for graciously explaining the many aspects of the local culture that were foreign to me and earnest efforts in ensuring I felt comfortable in my new environment. It is an understatement to say that everyone I met at Zara welcomed me as another one of their colleagues,
especially Begofia Valle Vilela, Sergio Marquez, Eva Ruano, and Gonzaga de Bastida.
This project would not have been possible without the support and infrastructure provided by the LGO Program. I thank Dr. Georgia Perakis for meeting with me on a weekly basis throughout the project to provide guidance and encouragement throughout the emotional rollercoaster that is an LGO
internship. I also thank Dr. Josef Oehmen for also dedicating countless hours to the project and for teaching me the value of stakeholder management and the immeasurable value in setting expectations early and often. I also thank all of the previous LGO interns at Zara for leaving such a strong legacy that has sustained the partnership and made it very easy for me to establish credibility.
I would like to thank my family and friends for their support and encouragement during this time. In particular, I thank my wonderful wife for supporting my decision to pursue this opportunity and for pushing me every day to reach for my dreams. And finally, I would like to dedicate this thesis to my
late grandfather Silvio Fornell who passed away while I was working on this project. From my earliest memories as a child to the last time I saw him, he made sure to remind me of how limitless and successful he thought my future would be.
Table of Contents
A b stract ... 3 Acknowledgem ents ... 5 Table of Contents ... 6 List of Figures ... 9 List of Tables ... 10 List of Equations ... 12Glossary & Subscript Convention ... 13
1 Zara Background ... 14
1. 1 Fast Fashion ... 14
1.2 Zara's Scale ... 15
1.3 Business Cycle and Sourcing ... 15
1.3.1 Two Selling Seasons ... 15
1.3.2 Four Tier Sourcing ... 16
1.4 Organizational Structure ... 17 1.5 Product Hierarchy ... 18 2 Problem Introduction ... 20 2.1 Problem M otivation ... 20 2.2 M IT9 Project ... 21 2.3 Current Processes ... ... 22
2.3.1 Long Term Purchase Planning ... 22
2.3.2 Short Term Replenishment ... 22
2.4 Proposed Solution ... 24
2.4.1 Stakeholders and Deliverables ... 24
2.4.2 Solution Fram ework ... 25
2.4.3 Summ ary of Contributions ... 26
3 Literature Review ... 28
3.1 Past LGO M aster's Theses... 28
3.2 Caro and Gallien...28
3.3 Forecasting Approach ... 29
4 Dem and Forecasting -Prelim inary Analysis... 31
4.1 Data Input...31
4.2 Calculating Dem and from Point of Sale (P.O.S) Data...32
4.2.1 General Framework to Calculate Dem and... 33
4.2.2 Adjustm ent Day-of-W eek Cyclicality ... 33
4.2.3 Adjustm ent for Size Curve ... 33
4.2.4 M erging Day-of-W eek and Size Curve Adjustm ents ... 34
4.3 Dem and Characteristics...35
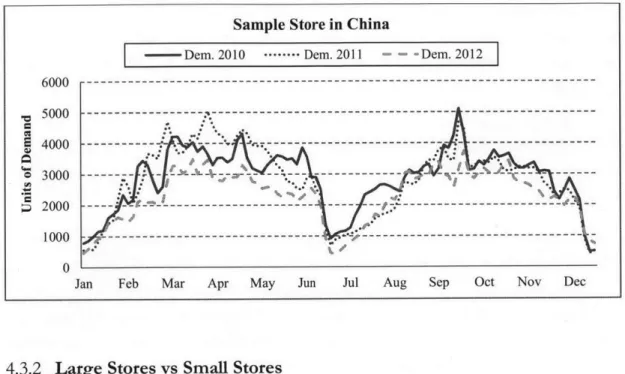
4.3.1 Seasonality ... 35
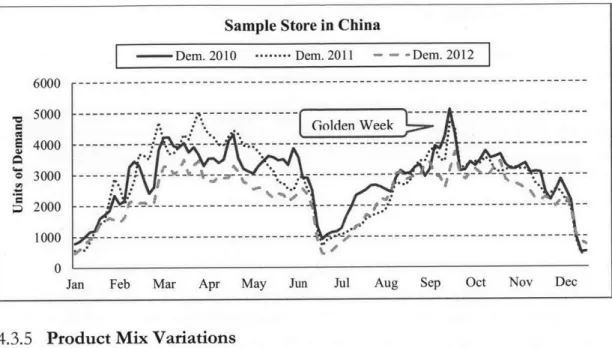
4.3.2 Large Stores vs Sm all Stores ... 36
4.3.3 Fixed Calendar Events: Christm as, NYE, M other's Day ... 37
4.3.4 Variable Calendar Events: Easter, Ram adan ... 37
4.3.5 Product M ix Variations... 38
4.3.6 Product Lifecycle vs Seasonal Trends ... 39
5 Dem and Forecasting -M ethods and Results ... 40
5.1 Perform ance M etrics ... 40
5.1.1 Perform ance M etrics: Statistical Validation... 40
5.1.2 Perform ance M etrics: Forecast Accuracy... 41
5.1.3 Perform ance M etrics: Operational Gains... 42
5.2 Store Level Dem and M odel ... 42
5.2.1 Definition...42
5.2.2 Results: Store Level Forecasts ... 46
5.2.3 Failed Variables: Store Level Forecasts ... 49
5.3.1 Definition...55
5.3.2 Results: Fam ily Level Forecasts ... 59
5.3.3 Failed Variables: Fam ily Level Forecasts... 61
5.4 M CC Level Dem and M odels ... 64
5.4.1 Definition...64
5.4.2 Results: M CC Level Forecasts ... 67
6 Im plem entation...69
6.1 Potential Tools ... 69
6.1.1 Store Dem and Forecasting... 69
6.1.2 M CC Dem and Forecasting Tool... 70
6.2 Stakeholder Buy-in...70
6.3 M odel M odifications...71
7 Contributions...73
7.1 Im provem ents to Zara's Operations... 73
7.2 Potential Applications to Retail Industry ... 75
8 Future Direction ... 76
List of Figures
FIGURE 1.1 -SOURCING CHANNEL VS. LEAD TIM E ... 17
FIGURE 2.1 -DISTRIBUTION DECISION SEQUENCE AND PROJECT FOCUS ... 21
FIGURE 2.2 -R EPLENISHM ENT TIM ELINE ... 22
FIGURE 2.3 -SOLUTION FRAM EW ORK ... 26
FIGURE 4.1- POINT OF SALE VS. DEMAND FOR STORE 376 IN BELGIUM...32
FIGURE 4.2 -EXAMPLES OF ANNUAL DEMAND PATTERN ... 35
FIGURE 4.3 -AVERAGE ANNUAL SALES BY STORE CATEGORY (TOP, A, B, C, D)...36
FIGURE 4.4 -DEMAND IMPACT OF FIXED AND VARIABLE EVENTS ... 37
FIGURE 4.5 -EXAMPLE OF PRODUCT M IX VARIATION...38
FIGURE 4.6 -MCC TREND VS STORE TREND FOR EASTER IN SPAIN STORE 160 ... 39
FIGURE 5.1 -ANNUAL DEMAND ESTIMATE: HISTORICAL PROPORTION ... 44
FIGURE 5.2 -ANNUAL DEMAND ESTIMATE: FORECASTED PROPORTION ... 44
FIGURE 5.3 - GRAPHICAL RESULTS FOR SHORT AND LONG TERM STORE DEMAND ... 48
FIGURE 5.4- REDUCTION IN wMAPE FOR FAMILY DEMAND MODEL ... 60
FIGURE 5.5 - REDUCTION IN MAPE FOR FAMILY DEMAND MODEL ... 60
FIGURE 5.6 -FAMILY LONG TERM FORECAST ACCURACY: GOOD EXAMPLE (PANTS)...61
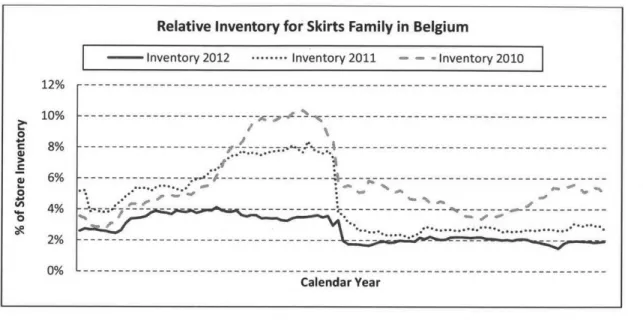
FIGURE 5.7 -FAMILY LONG TERM FORECAST ACCURACY: POOR EXAMPLE (SKIRTS)...61
FIGURE 6.1 - SIMULATED TRANSITION IN GLOBAL DEMAND AS CHINA'S VOLUME GROWS ... 70
List of Tables
TABLE 1.1 -SUPPLIER D ISTRIBUTION BY REGION... 16
TABLE 2.1 -STORE LEVEL FORECAST IMPROVEMENTS IN wMAPE...26
TABLE 4.1 -RECORDS REMOVED FOR CLOSED STORES ... 31
TABLE 4.2 -PROPORTION OF SALES BY DAY OF WEEK, WP ... 33
TABLE 4.3 -PROPORTION OF SALES BY SIZE...34
TABLE 5.1 -REGRESSION RESULTS: SPAIN STORE WEEKLY DEMAND...45
TABLE 5.2 -R EGRESSION M ETRICS...46
TABLE 5.3 -OUT SAMPLE R2 FOR STORE DEMAND...46
TABLE 5.4 -SUMMARY OF FORECAST ERRORS FOR STORE DEMAND...47
TABLE 5.5 -RESULTS FOR FAILED VARIABLES: MCS IN STORE...50
TABLE 5.6 -RESULTS FOR FAILED VARIABLES: M CS IN STORE...51
TABLE 5.7 -REGRESSION RESULTS FROM TEMPERATURE VARIABLE TESTS FOR STORE DEMAND ... 54
TABLE 5.8 -PRODUCT FAMILIES USED TO BUILD FORECAST MODELS ... 57
TABLE 5.9 -STORE SUBGROUPS FOR FAMILY M ODELS... 57
TABLE 5.10 -FAMILY LEVEL DEMAND COEFFICIENTS FDR A AND B STORES IN BARCELONA...58
TABLE 5.11 - FAMILY DEMAND MODEL VALIDATION STATISTICS ... 58
TABLE 5.12 - FAMILY M ODEL OUT OF SAMPLE R2 ... . ... ... ... ... ... ... ... .. .... ... ... ... .. .. . . . 59
TABLE 5.13 -FAMILY RESULTS FOR M C VARIABLES ... 63
TABLE 5.14 -RESULTS FOR WEATHER VARIABLES ON FAMILY 83 IN BARCELONA ... 64
TABLE 5.15 -DATA RECORDS BY STORE-FAMILY COMBINATION ... 65
TABLE 5.16 - MCC DEMAND COEFFICIENTS FOR STORE 160 IN SPAIN...66
TABLE 5.17 - MCC DEMAND COEFFICIENTS FOR STORE 30 IN SPAIN ... 66
TABLE 5.18 -MCC DEMAND COEFFICIENTS FOR STORE 376 IN BELGIUM...66
TABLE 5.19 - MCC DEMAND COEFFICIENTS FOR STORE 3832 IN CHINA ... 67
TABLE 5.20 -MCC DEMAND COEFFICIENTS FOR STORE 3161 IN CHINA ... 67
TABLE 5.21 -ESTIMATED NET CHANGE IN LOST SALES FOR STORE 160 IN 2012 ... 67
TABLE 5.22 -SUMMARY OF REDUCTIONS IN LOST SALES ACROSS STORES AND FAMILIES ... 68
TABLE 7.1- STORE LEVEL FORECAST IMPROVEMENTS IN wMAPE ... 73
List of Equations
EQUATION 2.1 -REPLENISHMENT QUANTITY GENERAL APPROACH ... 23
EQUATION 2.2 -INITIAL SHIPMENT QUANTITY GENERAL APPROACH...23
EQUATION 2.3 -TREND CALCULATION GENERAL APPROACH ... 24
EQUATION 2.4 -TREND-ADJUSTED DAILY DEMAND GENERAL APPROACH ... 24
EQUATION 4.1 -P.O.S TO DEMAND, DAY-OF-W EEK ADJUSTMENT ... 33
EQUATION 4.2 -SIZE CURVE DEMAND ADJUSTMENT ... 34
EQUATION 5.1 -M A PE C ALCULATION ... 41
EQUATION 5.2 -W EIGHTED MAPE, OR wMAPE, CALCULATION...41
EQUATION 5.3 - GENERAL STORE DEMAND FRAMEWORK ... 43
EQUATION 5.4 -ANNUAL DEMAND FINAL EQUATION ... 43
EQUATION 5.5 -FINAL EQUATION FOR WEEKLY PROPORTION OF STORE DEMAND...45
EQUATION 5.6 -RATIO OF MODELS IN CURRENT YEAR VS PREVIOUS YEAR ... 49
EQUATION 5.7 -RATIO OF NEW MODELS IN CURRENT YEAR VS PREVIOUS YEAR ... 50
EQUATION 5.8 -DIFFERENCE IN PERCENTAGE OF NEW MODELS IN CURRENT YEAR VS PREVIOUS YEAR ... 50
EQUATION 5.9 -DIFFERENT IN PERCENTAGE OF ON-SALE MODELS IN CURRENT YEAR VS PREVIOUS YEAR ... 50
EQUATION 5.10 -RATIO OF NEW INVENTORY IN CURRENT YEAR VS PREVIOUS YEAR ... 50
EQUATION 5.11 -DIFFERENCE IN PERCENTAGE OF NEW INVENTORY IN CURRENT YEAR VS PREVIOUS YEAR ...50
EQUATION 5.12 -WEATHER VARIABLE: CURRENT WEEKLY AVG. VS. HISTORICAL WEEKLY AVG. ... 52
EQUATION 5.13 - WEATHER VARIABLE: CURRENT WEEKLY AVG. VS. HISTORICAL MONTHLY AVG. ... .... 52
EQUATION 5.14 -WEATHER VARIABLE: CURRENT WEEKLY AVG. VS. HISTORICAL MONTHLY AVG. IN MARCH A N D A PR IL ... 52
EQUATION 5.15 -FAMILY DEMAND MODEL FRAMEWORK ... 55
EQUATION 5.16 -FAMILY DEMAND PROPORTION REGRESSION MODEL ... 58
EQUATION 5.17 - YEAR OVER YEAR CHANGE IN FAMILY WEIGHT WITHIN STORE...62
EQUATION 5.18 - YEAR OVER YEAR CHANGE IN WEIGHT OF NEW ITEMS IN FAMILY WITHIN STORE ... 62
EQUATION 5.19 - YEAR OVER YEAR CHANGE IN WEIGHT OF NEW ITEMS IN FAMILY WITHIN STORE ... 62
Glossary & Subscript Convention
Key Terms (Subscript)
Cycle (c): Time unit referring to either M-W or Th-Su. Zara's distribution decisions are made at the beginning of each cycle
Week (w): Time unit encompassing two consecutive cycles.
MCCT: Refers to the SKU level identifier. M references the model, first C references the fabric or supplier, second C references color, and T references size
MCC (m): MCCTs aggregated without consideration to size. Most granular unit used for modeling
Subfamily (s): High level of product aggregation that is normally broken out by design team such as Basic Pants or TRF T-Shirts
Family (f): Highest level of product aggregation irrespective of design team such as Pants or Coats Store (t): Store, or tienda in Spanish, is used in this study to group all products that fall under women clothing.
1
Zara Background
Zara is the world's largest fashion retailer (Hansen, 2012) and is the flagship brand of parent company Industria de Disefuo Textil (Inditex) representing roughly 66% of the group's total sales (Inditex Annual Report, 2012). In addition to leading the group in sales it also serves as the group's hub for operational innovations. Most projects to improve distribution efficiency or in-store operations are first developed at Zara's headquarters in Arteixo, Spain, then tested and validated through Zara's store network and finally implemented across the other brands. This is a large reason why most published work associated with Inditex refers to improvements implemented at Zara.
The rest of this chapter will attempt to explain the key characteristics of Zara's business operations as they pertain to this study: long and short term demand forecasting. For more details on its rich history as it has evolved from its humble beginnings to a global brand the author recommends reading Hansen's 2012 article in The New York Times (Hansen, 2012).
1.1 Fast Fashion
Fast fashion retailers are characterized by their ability to respond quickly to market trends. Some of the better known players in this space include Zara and H&M but it is important to recognize that fast and traditional fashion models are ends on a spectrum. Many retailers that are hesitant to make the large investments required to be at the forefront of fast fashion still take steps be able to react to their customers, and hence fall somewhere in the middle of the spectrum (Fast Fashion and the Responsive Supply Chain, 2013). The strategies to achieve fast responses to customer demands vary significantly by company, but they generally combine at least two components (Cachon & Swinney, 2011):
o Short production and distribution lead times, enabling a close matching of supply with uncertain demand
o Highly fashionable, or trendy, product designs
Following this strategy, as Zara and its competitors do, may appear at first glance to significantly increase operational costs but the benefits from better matching supply and demand usually outweigh the costs of maintaining an agile supply chain (see, e.g., Fisher and Raman 1996, Eppen and Iyer 1997, Caro and Gallien 2010. One obvious benefit is that it helps reduce the instances where large volumes of inventory are sold at significant discounts in order to clear inventory of unpopular models. For example, Ghemawat and Nueno (2003) were able to show that fast fashion retailers such as Zara could have as low as 15-20% of sales come from discounted items while traditional retailers have rates in the 30%-40% range.
An additional benefit identified by Cachon and Swinney (2009) comes with the presence of strategic customers. Strategic customers are those who not only decide whether to buy an item but also when to buy it given mark-down expectation. Cachon and Swinney found that a quick response strategy provides an average of 67% additional benefit when there are strategic customers. The share of strategic customers continues to grow as more prices and availability information are easily accessible online. At Zara, for example, popular items rarely go on sale because they sell out before the mark down period begins, which incentivizes strategic buyers to purchase at full price.
1.2 Zara's Scale
As the world's largest fashion retailer Zara's operations are impressive by both its size and agility. With 1,925 stores in 86 countries, Zara amassed
E1O.5B
in revenue in 2012, which represented an 18% increase over 2011 (Inditex Annual Report, 2012). Zara operates this network in a verycentralized manner: it owns almost all its stores, it develops most of its software and systems in-house and most strategic decisions are made at headquarters. Operating in this manner gives them tight control over their supply chain (Ferdows, Lewis, & Machuca, 2004) but it also significantly increases the breadth of responsibilities managed at headquarters. For example, Zara introduces roughly 10,000 new articles throughout their store network every year (Kelley, 2013). This high product variety
coupled with unparalleled twice weekly replenishments results in the distribution department having to ship 5.2 million units per week and to make over
1MM
replenishment decisions per week. Given their scale and need for agility, any analytical tool developed must be fast and easy to understand so that it can be run and evaluated quickly.1.3 Business Cycle and Sourcing
1.3.1
Two Selling Seasons
Similar to most clothing retailers, Zara plans two major seasons per year: Summer and Winter. The summer season runs from February through June and winter season runs from September to
December. At the end of each season they offer mark downs in order to exhaust remaining inventory; these are the only periods when they offer discounted merchandize. Zara also has cross-over
collections which serve as previews for the new season and usually start right before the mark down periods and run through the beginning of the new season. For example, summer cross-over collection would likely be introduced in mid-December even though the summer selling season has not begun. The purpose for these cross-over collections is to have season-appropriate merchandize before fully switching over. For example, cross over merchandize introduced in mid-December is not likely to include heavy volume of shorts.
1.3.2
Four Tier Sourcing
Zara is different than many of its competitors in that it still manufactures some of its products in order to be able to respond to customer trends in season. However, it still outsources most of its
manufacturing and strategically balances long lead time/low cost sourcing with short lead time/high cost sourcing. Zara garnered attention when it began its rapid expansion in the early 2000s for having a large share of its supply base located in Europe, as opposed to Asia where it was cheaper. At the time Zara believed that it made more sense to produce closer, and not cheaper, because it allowed them to have a more efficient supply chain (Tokatli, 2008). It has since shifted to having more suppliers outside of Europe as the agility and quality of non-European suppliers has improved. Table 1.1 shows the distribution of suppliers by region which shows a wide supplier base in both Europe and Asia (Inditex Annual Report, 2012).
Table 1.1 -Supplier Distribution by Region
Region Suppliers in 2012 Asia 672 European Union 446 Non-EU Europe 136 Africa 112 America 68 Total 1434
Zara's sourcing operations fall into four major categories which are described below, however, for more detail the author suggests a review of Bonnefoi's work on this topic (Bonnefoi, 2012): Long Circuit Sourcing: These are long lead time suppliers to whom Zara might provide a design to manufacture. This sourcing channel is used for high volume, low fashion articles such as cardigans or solid color sweaters. This is the lowest cost channel for Zara, but offers the lowest amount of control and flexibility as these suppliers are mostly in Asia (China, India and Vietnam) and the lead time can be as high as 12 weeks from order to delivery.
Proximity Sourcing: Suppliers with strong and long standing relationships with Zara which are usually located in nearby markets such as Portugal, Morocco, Turkey, or even Spain. This channel is more costly than Long Circuit but it is arguably Zara's most important channel because it offers fast lead times of just 4 to 6 weeks while still offering relatively low prices. Zara is able to minimize the cost and lead time for this channel by directly procuring the fabrics and producing the designs for the items it orders. This generates savings to the manufacturer which can be directly passed on to Zara. Maintaining close relationships with these manufacturers is important to ensure quality and fast turnarounds whenever Zara detects a growing fashion trend.
In-House Manufacturing: The share of this channel has continued to decrease in an effort to maintain high margins. However, it is still a very important sourcing channel because it allows Zara to design and introduce new products mid- season. In the event that Zara misses a major trend within a collection, it can use this channel to fill the void. For this channel, Zara produces the design and cuts the fabric before outsourcing to a network of nearly 400 small firms located near its headquarters. This channel is also used for their most complex designs which require a high level of skill. Fabric Procurement: Zara also engages in large volume purchases of fabrics in order to internalize
savings due to economies of scale. Throughout the year, Zara identifies key fabrics that they believe could be at risk of either going up in price or will be in low supply in the short to medium term. This inventory of fabric allows Zara to reduce the lead times and prices quoted by its suppliers.
Figure 1.1 -Sourcing Channel vs. Lead Time
0 1 Montb 2 Months 3 Months 4 Months
Lead Time
1.4 Organizational Structure
While the company as a whole is very centralized because most decisions are made at headquarters, the office is divided into a series of pseudo-independent departments. It has separate departments for Women, which is by far the largest, Men and for Kids. Each of these departments has its own functional support and design teams. Women's sales account for more than 66% of Zara's sales and as such it is where most improvement projects begin. For this reason, this study focuses almost entirely on the Women department. The women's department has over 300 employees responsible for the design and procurement of its sub-brands (Woman, Basic and TRF), distribution, and financial performance of the group (Garro, 2011).
A couple of important functional teams within each group that help Zara sense the pulse of its customers while also controlling the look and feel of its stores across the world are: 1) Country Managers, or "Comerciales de Paises"; and, 2) Merchandizers.
Country Managers: Each member of this team analyzes and interprets sales figures for roughly 40 stores in a geographic area. Country managers are the main link between stores and headquarters. The goal of every country manager is to help each store sell as much as possible and, in fact have part of their compensation tied to the performance of the stores they oversee. Stores report high selling items and slow selling items to the store managers who can then communicate the feedback to both the designers and the distribution department (Corsi, Dessain, & Ton, 2010). This feedback loop is very important for Zara to be able to adjust its merchandize to adapt to the customer demand at each store. Interior Designers: This is a small team which is in charge of designing the interior layouts for all stores. While each store has some autonomy as to which products it has on display, this team sends pictures taken at a Test Store detailing the preferred layout arrangement for the current collection (Corsi, Dessain, & Ton, 2010).
1.5 Product Hierarchy
The SKU-level identifier for tacking clothing articles at Zara is called "MCCT", where M refers to the Model, the first C refers to Calidad (Quality) which is used to differentiate identical articles made by multiple suppliers or have different fabric composition, the second C is for Color, and T stands for Talla (size). For this project, however, the lowest level of granularity forecasted was MCC.
Nonetheless, it is still important to understand the distinction between MCC and MCCT level as the raw data is tracked at the MCCT level before it is aggregated for modeling purposes.
In addition, each MCC is also associated with a product family, product subfamily, and a set of attributes.
Product Family: Family is the widest level of aggregation and usually refers to categories such as pants or long coats, among others. This level of aggregation is mostly an IT classification and it is seldom used by Zara employees when discussing different products. We nonetheless found it to be useful for modeling purposes.
Product Subfamily: Subfamilies attempt to be one level deeper of granularity by usually combining the designer house for the MCC and a descriptive term such as B.VESTIDO (for Basic Dress) or W.FALDA (for Woman Skirt). This is the most common aggregation used by Zara, but can be difficult to predict sales volume from season to season because a particular designer could choose to exclude an entire subfamily from a collection or make it the feature item.
Attributes: This description is meant to associate each MCC with a set of attributes that can help describe the item. This value could be very valuable for grouping similar MCCs across families and subfamilies; however, it is not a standardized or mandatory designation. Every designer can choose freely which attributes to assign to an MCC and more disappointingly, many designers choose not to use this classification tool; making it a poor data point for modeling purposes.
2 Problem Introduction
2.1 Problem Motivation
The focus of this project is to develop an automated methodology to account for seasonality when forecasting demand. The ability to properly forecast demand is particularly important for Zara because one of its core strategies is to keep low inventory at stores and replenish them twice weekly based on demand expectations. Zara's presence in over 86 countries complicates seasonality forecasting because each store is impacted by global trends, such as winter and summer, and also by local trends, such as Black Friday in the U.S. or Ramadan in Saudi Arabia. Zara is interested in understanding seasonality for two major purposes:
1. Forecast aggregated Store-level demand with 4-6 month time horizon 2. Forecast item-level demand for twice weekly replenishments
The first portion of this study focuses on forecasting store level demand, which refers to the total number of units, or MCCTs, a store is expected to sell for a given time period. Understanding peaks
and troughs in demand with 4 to 6 months of anticipation for each store allows Zara to understand aggregated global demand. This knowledge would allow them to align supplier deliveries with customer demand. Currently, Zara relies mostly on prior year performance and historical demand patterns based mostly on Spain's fashion demand cycle. This study is one of the first attempts to understand demand on a global level in order to use in procurement planning. Unfortunately, Zara does not have a metric to quantify how well it matches its long term procurement orders with demand, however their spectacular growth over the past decade serves as evidence that accuracy is not its biggest problem. Instead, their major pain point is the fact that the current process is highly subjective and depends heavily on the expertise of its managers, this project attempts to deliver an objective approach that incorporates much of the knowledge that Zara managers have regarding factors that impact demand trends.
The second portion of this study focuses on forecasting short term demand quantities for every MCC at every store. Answering this question helps them determine the optimal in-store stock levels for every MCC, while taking into consideration cannibalization from other products and the length of time since product was introduced. Zara alleviates a lot of the perils that come from inaccurate forecasting by replenishing twice per week and relying on observed demand as the main input. To improve upon their methods, this study looked at input variables in addition to observed demand to capture effects from seasonality and cannibalization, among others.
2.2 MIT9 Project
There are three major areas of Zara's operations that influenced this project. Figure 2.1 shows the three areas and highlights the focus of this project. The first area is accurately translating point of sale data to demand data. This translation is necessary because whenever an item stocks out, it leads to the point of sales data being censored. In theory, more units would have been sold if the item had not stocked out. Garro (2011) and Bonnefoi (2012) looked at this problem and developed good
methodologies for converting point of sales data to demand data. The method designed by Garro had been implemented at Zara by the time this study began and was therefore used as the estimate for historical demand.
Figure 2.1 -Distribution Decision Sequence and Project Focus
1. Gather Past
2. Forecast
3
Data
Demand
Decisions
Convert Store Level Schedule
Saest
Demandd
Demand PurchasesFamily Level
Demand
Item Level Replenish
Demand Stores
The second area can be thought of as the actual modeling which tells Zara how many units they can expect to sell in a given time period. This is the main focus of this study and will be discussed in depth in Chapters 4 and 5.
The third phase is the step where operational decisions are made based on the demand forecasts. This is mostly a question of service level, which is to ask, to what extent does Zara want to avoid
stockouts? When considering overage and underage costs, Zara has different approaches for procurement and for distribution. In procurement, Zara seeks to reduce overage costs by purchasing low quantities of each item they introduce, which leads to frequent stock outs of popular items. Their replenishment policy, however, is very aggressive in avoiding stockouts. This means that they attempt
to avoid any stock out at stores while there is inventory available in their warehouses. This last decision-making phase of their operations falls outside the scope of this study.
2.3 Current Processes
2.3.1
Long Term Purchase Planning
For long term planning Zara focuses on historical performance with particular attention on prior year performance. Zara has historically prepared their purchases so that the bulk of their merchandize is displayed at stores in line with Easter for Summer Collection and near the end of September for
Winter Collection. This pattern stems from the consumer behavior in Spain and in most of Europe that experiences similar climate and where Easter is a major holiday. In other areas of the world, this pattern has led to a self-fulfilling prophecy which is difficult to isolate. Zara's decision to introduce its
best merchandize at certain times of the year leads to those times being the best performing times of the year. Would those periods display such good performance if product introduction were planned differently?
2.3.2
Short Term Replenishment
Figure 2.2 illustrates the general timeline for twice weekly replenishments which occur on Mondays and Thursdays. Each M-W and Th-S period is considered a "cycle" and it is a unit of time frequently used throughout this study. Each Monday, replenishment quantities are calculated for each MCC in each store to be shipped for arrival at stores by Thursday, at which point the process is repeated for replenishments to arrive the following Monday.
Figure 2.2 -Replenishment Timeline
Week -2 Week -I Week 0
Cyvcle -4 CyCle - Cycle -2 CveleC -I CycleC 0 GvCle I
y
2Analytical CycleMon Thu Mon Thu Mon Thu Mon
To determine the replenishment quantity for each store, Zara first calculates an average daily demand rate, which usually estimated as the daily demand from previous two weeks (= 4 cycles). Next, it sets a target for days of inventory which it normally sets to 21 in order to reduce the probability of stock outs. The product of these two quantities determines what they consider to be their "Objective Stock" or optimal in-store inventory level. They then ship the difference between the optimal inventory level and the store's current inventory level. At this point, it should be clear that the optimal inventory level is dynamic and fluctuates as demand for a given item goes up or down.
Equation 2.1 -Replenishment Quantity General Approach
Replenishmcc
=
(Avg. Daily Demandm z wks x Days of Inv) - InStore InVmccThere are, however, several instances when using the observed average daily demand is either not feasible or not accurate. One such instance is when an item is first introduced because there is no history available. Another instance, and a focus of this study, is when there are exogenous factors affecting demand for an item, such as a holiday. Below are the two main adjustments that Zara makes:
1.
Calculate Daily Demand for New Items:When introducing new items Zara uses comparable items to estimate initial demand. Zara's buyers, designers, and country managers identify comparables based on fashion similarities. This process can be highly subjective. Nonetheless, it is a quick and effective way to manage this process given the large number of new items that Zara introduces each year. Once comparables are identified, Zara identifies the top three selling weeks for each comparable item and uses the average daily demand over those three weeks as the average daily demand for the new item. One significant shortcoming of this method is that it does not account for seasonal factors for neither the comparables nor the item being introduced. For example, if a comparable's best weeks occurred over Christmas (high demand) and a new item is being introduced in early February (low demand) then there is a clear mismatch in sales
expectations for the two items, which is independent of the quality of the items'. Here again, the target days of inventory is also set to 21 days.
Equation 2.2 -Initial Shipment Quantity General Approach
Initial Shipmentmcc ~ Avg. Daily Demandcoswks x Days of
Inv
2. Adjustments to Daily Demand for Seasonal Trends:
Zara currently relies on country managers to alert the distribution department of upcoming holidays and events that could impact demand. Upon this notification the distribution
department evaluates the change in demand from prior years and assumes similar behavior for Garro (2011) focuses on the distribution decision process and covers the current methodology in greater detail.
current year. The change in demand is evaluated on a per MCC basis, which is to say that it calculates, total demand per "MCCs in Store", before, during and after the event in question. With this understanding of change in demand they calculate a trend factor which is used to adjust the average daily demand.
Equation 2.3 -Trend Calculation General Approach
Demandp2/Mp2 ed '2 Demandpi,/Mpi
Equation 2.4 -Trend-Adjusted Daily Demand General Approach
Adj Daily Demandmcc,t2 ~ Observed Daily Demandmcc,ti x Trendt1,t2
where p1 refers to a baseline period preceding a seasonal event, p2 refers to the period when demand is affected by the event, and M refers to the number of MCCs present in the store in a given time period. The biggest shortcomings of this trend methodology are that: 1) it requires a case by case evaluation; and, 2) it relies heavily on country managers alerting the
distribution department of upcoming events.
2.4 Proposed Solution
2.4.1 Stakeholders and Deliverables
This project addresses the needs of three distinct stakeholders which are defined as:
1.
Distribution Department: As the owners of the forecasting models and sponsors of this project the distribution department is the lead stakeholder. They own all of the automated processes that calculate the replenishment quantities and have final say on whether to accept a country manager's recommendation to make an adjustment. In addition to developing a better forecast the output from this project should make it easier for them to incorporate new demand-impacting events as they discover them. Therefore the solution should help them be more accurate and save them time.2.
Designers/Buyers: Part of the goal for this project is to understand the truly significant events across the world. Understanding when these shocks occur on a global level will help buyers plan their purchases so that there is enough inventory to satisfy all major selling spikes across the globe.3.
Country Managers: It is currently very cumbersome for country managers to keep track of all relevant events and factors that impact sales in their respective countries. The new model should make it easier for them to test whether an event is relevant as well as incorporate the relevant ones into the automated baseline estimates. Additionally, country managers areconstantly monitoring the replenishment needs for all of their stores and therefore serve as great sources of input to validate and improve the models as time goes on.
Given the stakeholders and their respective interests, the deliverable for this project is a series of models that can automatically and systematically forecast demand while accounting for seasonality and other factors exogenous to the quality of an item. The models would serve as the basis for developing three new tools:
1. Aggregate Demand Forecast Tool: This tool would project demand for as far as 6 months that can be aggregated from as low as the total demand of one single store, to the total demand in a region, or for the entire network of stores. This tool would mostly help designers and buyers plan their purchases.
2. Seasonal Event Identifier: This tool refers to a systematic way to test whether a seasonal event, such as Ramadan or Father's Day, does in fact have a significant impact on demand. 3. Replenishment Quantity Estimator: This tool would serve to provide the distribution
department with an estimate that automatically incorporates the demand shocks that result from events identified by tool #2.
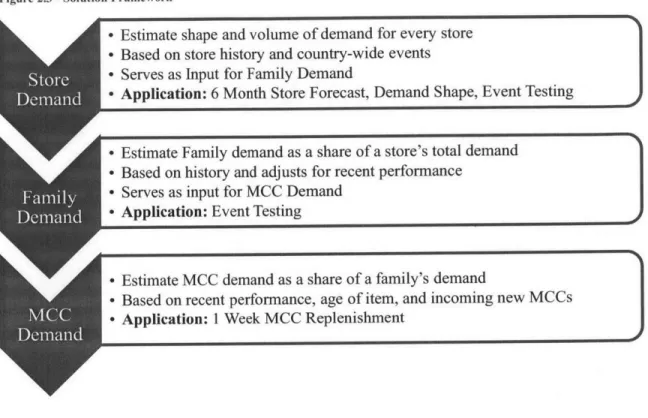
2.4.2
Solution Framework
In evaluating the various modeling approaches for this study it was determined that regression models with dummy variables would be most appropriate. For one, it is simple to implement, easy to
understand and can be modified with relative ease. Secondly, Chu and Zhang (2003) showed that "seasonal dummy variables can be very useful in developing effective regression models for
predicting retail sales." While they concluded that neural networks would be the best approach it was not implemented here for its increased level of complexity and difficulty. Additionally, understanding the driving factors for a given output is much more nebulous because the model arrives at it through a series of learning iterations, and thus it can be hard to interpret a result in cases where time is limited. The models were built in three stages. The first stage was to estimate the store level aggregate demand, which corresponds to the total number of units a store would have sold if it did not experience any stockouts. The next level was to estimate the percentage of each store's demand that could be attributed to each product family. The output of this second stage is a percentage that can be converted to units by multiplying by the estimated store aggregate demand. The last level was to estimate the percentage of each product family that should be attributed to each MCC. Figure 3 below introduces the high level components of each stage, with more details about derivation and
Figure 2.3 - Solution Framework
- Estimate shape and volume of demand for every store " Based on store history and country-wide events - Serves as Input for Family Demand
- Application: 6 Month Store Forecast, Demand Shape, Event TestingJ
" Estimate Family demand as a share of a store's total demand - Based on history and adjusts for recent performance
- Serves as input for MCC Demand " Application: Event Testing
" Estimate MCC demand as a share of a family's demand
- Based on recent performance, age of item, and incoming new MCCs - Application: I Week MCC Replenishment
2.4.3
Summary of Contributions
This project makes several contributions to Zara which will be further detailed in subsequent sections. However, at a high level this project helps Zara on several distinct fronts. The first is that it defines a framework of distinct components that Zara can work on to improve its forecasting capabilities going forward. The framework is best defined by Figure 2.1, whereby Zara can decide to focus on any of the three stages of forecasting, one is improving its methodology for estimating demand data, the second is better accuracy if forecasting that input data, and lastly how to distribute based on those forecasts. Secondly, it delivers forecasting models that significantly improve upon their current methods. In forecasting total units of demand at the store level, this project reduces the forecasting error between 5% and 12% when considering a 1 week time horizon and between 2% and 11% when considering a 6 month time horizon, as shown in Table 2.1. The errors here are calculated using a weighted MAPE approach which is detailed in Section 5.1.2.
Table 2.1 -Store Level Forecast Improvements in wMAPE
Estimation Errors (Stores)
Baseline MIT9 Baseline MIT9
Country 1 Week
1
Week Difference 24 Weeks 24 Weeks DifferenceSpain 17.6% 11.6% -6.0% 21.9% 15.2% -6.7%
Belgium 17.3% 11.4% -5.9% 14.0% 12.5% -1.5%
China 17.9% 12.9% -5.0% 22.1% 19.0% -3.1%
Thirdly, and also related to forecasting, is the potential to help Zara reduce its lost sales by 24% which would lead to an increase in total annual sales of 1.8%. These gains are achieved through improved forecasting of MCC level forecasts which help match supply with demand on a weekly basis.
2.4.4
Thesis Organization
The remaining sections of this thesis details the effort undertaken to solve the problem described thus far. Chapter 3 covers the literature reviewed for this project; first it covers the work done by past LGOs and other academics to improve Zara's operations and it ends with an overview of sound practices for forecasting demand.
Chapter 4 describes the data available for this study as well as some high level characteristics to help the reader understand some of the nuances that make this problem difficult. Chapter 5 has an extensive and detailed presentation of the models developed for this thesis as well as the accuracy of each model.
Chapter 6 discusses Zara's buy-in and current state of their implementation efforts for the models developed in this thesis. The chapter ends with the latest modifications that Zara has made to the models in order to incorporate them into their systems. Chapter 7 summarizes the contributions that this work makes to Zara and to the retail industry. Lastly, Chapter 8 makes recommendations for the future direction that Zara could take as it looks to improve upon the work presented here.
3 Literature Review
There is a considerable amount of literature regarding Zara specifically and also regarding demand forecasting in highly seasonal environments. This chapter reviews relevant works upon which this study attempts to build. First, an overview of past LGO thesis is presented. Then, several works by Caro and Gallien (2007, 2010, 2012), who have done extensive research relating to Zara's operations, are covered. Lastly, other works relating to demand forecasting are covered.
3.1 Past LGO Master's Theses
The theses of Correa (2007), Garro (2011), and Bonnefoi (2012) address the topic of demand forecasting. Correa's work is the most relevant to this study as it provided a methodology for
forecasting demand at the MCCT level for
1
week into the future, and hence the basis for determining replenishment quantities. Garro and Bonnefoi estimated demand from an MCC-centric point of view prior to the products being introduced. Garro's focus was in determining the initial shipments of new items and Bonnefoi's focus was on determining the initial quantities to purchase for a given item based on a lifetime demand forecast. These works, however, fail to address three items which are developed in this study: 1) Impact on demand from seasonal events that shift in the calendar from year to year such as Easter and Ramadan; 2) Methodology for calculating a long term forecast for planning purposes; and 3) Impact of demand cannibalization from other items in store.3.2 Caro and Gallien
Felipe Caro and Jdremie Gallien have co-authored several papers detailing improvement projects for Zara's operations. Gallien has also advised multiple MIT LGO theses and is therefore an excellent starting point for reviewing literature as it pertains to Zara. Caro and Gallien (2007) presents a strategy for optimizing product assortment based on observed demand. The paper focuses mostly on dynamically adjusting the tradeoff between using floor space for products with observed high demand versus using the space for new items in order to learn their selling potential. However, it does suggest that in terms of forecasting it would be worthwhile to use "new (demand) information.. .which may be combined with historical information to select a future assortment." This is essentially the data gathering approach employed in this thesis, where recent demand data is combined with historical behavior at the Store, Product Family, and MCC level to forecast demand. One deviation from Caro and Gallien 2007 is on the assumption of stationarity of demand which this thesis does not assume because, as shown in section 4.3.6, demand rate per item decreases as the time in the store increases.
Caro and Gallien (2010) builds upon the forecasting work presented in Correa (2007) and makes the assertion that more in-store inventory of a particular item leads to additional sales for that item. It is of course expected to reach a saturation point, but it is difficult to observe in the data given that Zara is mindful of over-flooding stores with inventory. This assertion is tested throughout the models developed in this thesis and is included in the final model for family level demand. Lastly, Caro and Gallien (2012) details a forecasting approach which feeds into a clearance price optimization program. Even though this thesis focuses exclusively on full price items, there were two components of the forecasting model presented by Caro and Gallien that proved to be useful for this thesis: 1) Age of the article measured as time since introduced at stores is a critical component of the MCC level demand model, and 2) Previous Period Demand is also a variable used in both the family and MCC level models as the data shows some level of autocorrelation.
3.3 Forecasting Approach
Large motivation for this study is to develop an objective estimate of the impact of seasonal impacts as it is currently heavily influenced by human experts. Onkal et. al (2009) address this topic directly and present that strong biases are in fact introduced whenever humans provide estimates, this in large part is why the models in this study do not incorporate human input to generate the forecast. Instead, it presents a methodology for testing whether human intuitions are in fact validated by past data. Chu and Zhang (2003) present various methods for forecasting seasonal demand and demonstrate that using regression with dummy variables can yield good results. This study successfully uses that approach for forecasting long term demand.
This thesis also leverages the demonstrated evidence that demand for fashion items shows strong correlation across periods (Fisher & Raman, 1996) and (Fisher, Rajaram, & Raman, 2001). To make use of this information, the models presented here consistently use auto-regressive terms for
estimating demand. One strong deviation from both of these works however is the fact that in our case we assume that order quantity is fixed and cannot be updated mid-season. While in some cases Zara is able to reorder mid-season, the work presented here is designed for the distribution department which simply operates with an available inventory and does not have the ability to reorder.
Two other demand forecasting topics explored in this thesis are: the impact of demand cannibalization from new items arriving at stores; and, the impact of weather on demand across time and across products. On product cannibalization, Shah and Avittathur (2007) found that increases in demand cannibalization led to decrease in profitability. They tested this assertion by estimating profit at various levels of cannibalization, in this thesis we determine that factor by using regression to determine how much demand for an item falls with the introduction of new items. The impact of
weather was less conclusive in this study and was not incorporated into the final solution. However, the impact of weather was extensively explored based on the expectation that demand across products and across time would be change when abnormal weather conditions are present. Starr-McCluer (2000) found that several effects impact retail sales, first weather can have a "convenience effect" whereby customers go shopping on very hot days to avoid being outdoors and conversely, cold temperatures and precipitation might hinder travel and therefore keep people away from stores. A
second effect is that weather complements certain activities such as golfing, hiking, or going to the beach. Adding to these effects is the impact that weather might have on future spending, for example, if coats are purchased early in the season due to low temperatures it is fair to expect that demand for these goods will be lower later in the season.
4 Demand Forecasting
-
Preliminary Analysis
4.1 Data Input
The base dataset used for analysis contained all transactions of clothing articles going in and out of stores in Spain, Belgium, China and Saudi Arabia. This subset of countries was selected because it represents a diverse and meaningful subset of their network.
Before going into more detail, a few definitions are in order. A transaction occurs when an article of clothing is sent to a store, or when it exits the store via a purchase, a transfer to another store, or a recall back to central warehouses. The data is unique by date, store ID, and MCCT where each row has information about the transactions that occurred on each date. For purposes of this study, the data was cleaned and modified in the following four ways:
1.
Removed Closed Stores: Any store that was closed for1
or more cycles between January 2009 and December 2012 was removed. Most common causes for stores being closed was to either accommodate for renovations or because the store was launched after 2009. This filtering eliminated the following number of stores:Table 4.1 -Records Removed for Closed Stores
Total Stores Percentage
Country Stores Removed Removed
Spain 200 10 5%
Belgium 40 3 8%
Saudi Arabia 50 8 16%
China 100 30 30%
2.
Removed "Dead" MCCs:At Zara, store managers frequently remove items from the selling floor when it stops selling well. However, this action is not tracked in any of its databases. Dead MCCs were removed in an attempt to only track MCCs that are competing with each other, i.e. live MCCs. An MCC was considered dead when it experienced 0 sales over a four week period.
3.
Removed Marked Down MCCs:Items very seldom go on sale at Zara and generally sales start out as store wide for a few weeks at the end of each season. After a few weeks the store is transitioned from mostly marked down merchandize to mostly full price across several weeks. Furthermore, the marked down items are not replenished in the same regular fashion as the in-season items. Stores usually receive large shipments at the beginning of the mark down period to
supplement their own left over inventory. Each store attempts to sell their on-sale inventory as fast as possible. For this reason, the behavior exhibited by on-sale items was excluded when studying full price items. Excluding these sales changes the annual demand curves by essentially reducing sales to 0 during January and July, which are the heavy on sale periods.
4.
Aggregate by Cycle: Lastly, the dataset was aggregated by cycle, which is to say that each row contained the total transactions (inflows and outflows) for a cycle (M-W or Th-S) insteadof having a row for each day. This aggregation had two important advantages. First, it greatly reduced the number of records managed which helped with analysis run time. Secondly, it reduced variance of data points by observing pooled demand versus daily demand. This aggregation does not limit the accuracy of the data because Zara already manages its
replenishments by cycles, which means that it needs to know how much demand there will be in a given cycle, independent of the intra-cycle distribution.
4.2 Calculating Demand from Point of Sale (P.O.S) Data
A common problem in forecasting demand is the issue of sales data versus demand data. Sales data represents the portion of the demand that was captured and lacks the unobserved demand that occurs
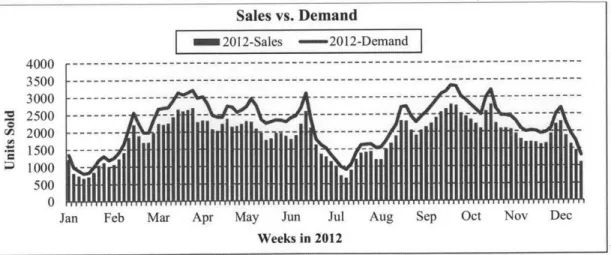
during stockouts. Therefore, the exercise to convert sales data to demand data consists of estimating what sales would have been if there had been infinite inventory, or no stockouts. Garro (2011) and
Bonnefoi (2012) developed methodologies to resolve this problem. The two methods were relatively similar; however, since Garro's method was already integrated into the base transactional dataset so it was chosen for this study. Figure 4.1 shows the difference between P.O.S. and Demand data for one store in Belgium. The rest of this section provides an overview of this method, however the author recommends reviewing Section 2.1 of Garro's thesis. Please note that the notation in this section differs from notation in other sections in an effort to remain consistent with Garro (2011).
Figure 4.1- Point of Sale vs. Demand for Store 376 in Belgium
Sales vs. Demand 2012-Sales - 2012-Demand 4000 ---~--~ 3500 --- ~---3000 --- -- --- --- --- -- - ---~---~---:9 2500 --- - - -- - -- ---- --- -z 2000 --- -- --- ~ -
1500
--- -1000 500Jan Feb Mar Apr May Jun Jul Aug Sep Oct Nov Dec
4.2.1
General Framework to Calculate Demand
The idea is to modify the sales data on days where stockouts occurred with an estimate of what sales would have been if the stockout had not occurred (i.e. demand). A good source of information for this
estimate is the sales information for days when the item did not stock out. The method implemented took into account the day of the week when the stockout occurred and also the sales distribution
across sizes for a particular item.
4.2.2
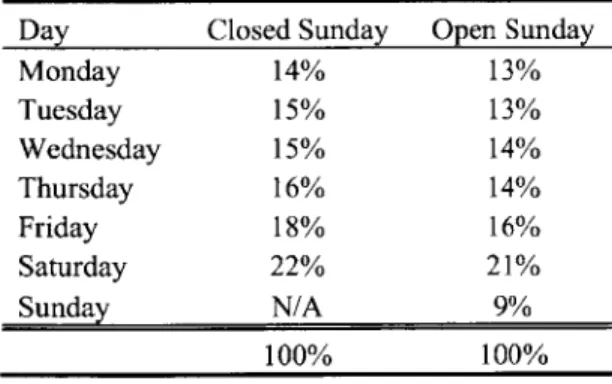
Adjustment Day-of-Week Cyclicality
The idea that demand varies by day of the week is commonly accepted by Zara managers. For example, we would expect to see higher sales on the weekends than on weekdays. Adjusting for the day of week would lead to the following estimation of demand:
Equation 4.1 -P.O.S to Demand, Day-of-Week Adjustment
PEP /(pP
where D, is the demand for a size t in a given week, P is the set of days in the week with available inventory for sale, S,,p is the sales observed for size t on day p, and W, is the proportion of weekly sales that occur on day p. Wp was found to vary significantly between stores that open on Sundays and stores that do not and as a result a different reference table is used for each type of store as shown in Table 4.2:
Table 4.2 -Proportion of Sales by Day of Week, Wp
Day Closed Sunday Open Sunday
Monday 14% 13% Tuesday 15% 13% Wednesday 15% 14% Thursday 16% 14% Friday 18% 16% Saturday 22% 21% Sunday N/A 9% 100% 100%
4.2.3
Adjustment for Size Curve
Another commonly accepted idea in fashion retail is the variation in demand by size. Size medium is the most popular size in most countries while extra-small and extra-large are less common. Therefore, sales data of size Medium inform demand of stocked-out Extra-Large by a different factor than sales
of Extra-Large would inform sales of stocked out Medium. Equation 4.2 shows the calculation for
making the demand adjustment based on size curve. Equation 4.2 -Size Curve Demand Adjustment
Dt ,: St'P + IWt ( St'P W
pEP pOP tET )/ tnT /
where p 0 P represents days with stock outs, and W, represents proportion of sales for each size, and
T represents the set of all sizes offered for a given item. The first part of the equation accounts for the
observed sales for a given size t, while the second part adds up the sales of all other sizes while size t is stocked out and divides by their respective sales proportion to extrapolate a total sale for the item. Lastly, it multiplies the extrapolated value by the weight of the stocked out size to use as an estimate of demand for size t on the days it was stocked out.
W, varies by product depending on the number of available sizes for the product. For example, some items are sold in sizes XXS, XS, S, M, L, XL, XXL while others are only sold in one size (usually M). Table 4.3 below shows values of W, based on the number of sizes offered for a given item. For example an item offered in three sizes (S, M, L) would experience 43% of its sales in the middle size. Table 4.3 -Proportion of Sales by Size
% Demand by Size Number of Sizes 1 2 3 4 5 6 7 8 1 100% 2 63% 37% 3 30% 43% 26% 4 28% 37% 22% 12% 5 10% 23% 31% 25% 12% 6 13% 25% 27% 20% 11% 4% 7 10% 21% 26% 20% 13% 7% 2% 8 6% 21% 26% 20% 13% 7% 6% 1%
4.2.4 Merging Day-of-Week and Size Curve Adjustments
Garro (2011) found that adjusting for size was the most accurate method, however it had serious limitations. Namely, it was impossible to use for items that were only offered in one size and also it did not account for situations when the store might choose to remove the item from the floor because a major size has stocked out (which is common practice at Zara stores). Therefore, the final
methodology averages the results between the two methods to estimate demand.
Ultimately, it was determined that the demand estimation process was not a critical piece of this study and therefore the work of Garro (2011) was carried forward. The forecasting models developed in this