https://doi.org/10.4224/20375133
READ THESE TERMS AND CONDITIONS CAREFULLY BEFORE USING THIS WEBSITE. https://nrc-publications.canada.ca/eng/copyright
Vous avez des questions? Nous pouvons vous aider. Pour communiquer directement avec un auteur, consultez la
première page de la revue dans laquelle son article a été publié afin de trouver ses coordonnées. Si vous n’arrivez pas à les repérer, communiquez avec nous à [email protected].
Questions? Contact the NRC Publications Archive team at
[email protected]. If you wish to email the authors directly, please see the first page of the publication for their contact information.
NRC Publications Archive
Archives des publications du CNRC
This publication could be one of several versions: author’s original, accepted manuscript or the publisher’s version. / La version de cette publication peut être l’une des suivantes : la version prépublication de l’auteur, la version acceptée du manuscrit ou la version de l’éditeur.
For the publisher’s version, please access the DOI link below./ Pour consulter la version de l’éditeur, utilisez le lien DOI ci-dessous.
Access and use of this website and the material on it are subject to the Terms and Conditions set forth at
The Construction Industry and the Issues Facing it: An Overview
National Research Council Canada. Institute for Research in Construction
https://publications-cnrc.canada.ca/fra/droits
L’accès à ce site Web et l’utilisation de son contenu sont assujettis aux conditions présentées dans le site LISEZ CES CONDITIONS ATTENTIVEMENT AVANT D’UTILISER CE SITE WEB.
NRC Publications Record / Notice d'Archives des publications de CNRC:
https://nrc-publications.canada.ca/eng/view/object/?id=bf2f4c36-3b2e-44a6-934f-a0879cd76ecb
https://publications-cnrc.canada.ca/fra/voir/objet/?id=bf2f4c36-3b2e-44a6-934f-a0879cd76ecb
http://www.nrc-cnrc.gc.ca/irc
T he Const ruc t ion I ndust ry a nd t he I ssue s Fa c ing it : An Ove rvie w
N R C C - 3 5 9 8 0
S e p t e m b e r 1 9 8 6
A version of this document is published in / Une version de ce document se trouve dans:
Ottawa : National Research Council Canada, pp. 63, September, 1986
The material in this document is covered by the provisions of the Copyright Act, by Canadian laws, policies, regulations and international agreements. Such provisions serve to identify the information source and, in specific instances, to prohibit reproduction of materials without written permission. For more information visit http://laws.justice.gc.ca/en/showtdm/cs/C-42
Les renseignements dans ce document sont protégés par la Loi sur le droit d'auteur, par les lois, les politiques et les règlements du Canada et des accords internationaux. Ces dispositions permettent d'identifier la source de l'information et, dans certains cas, d'interdire la copie de documents sans permission écrite. Pour obtenir de plus amples renseignements : http://lois.justice.gc.ca/fr/showtdm/cs/C-42
The Construction Industry and the Issues Facing It
An Overview
Prepared by
Institute for Research in Construction
Ce document est aussi disponible en franc;:ais
Ottawa, September 1986
FOREWORD
In July 1986 a meeting took place at the National Research Council of Canada in Ottawa, of senior provincial officials con-cerned with issues facing the Canadian Construction Industry. A briefing docu-ment was prepared by the Institute for Research in Construction (IRC) for this meeting, in consultation with experts on various aspects of construction. The document gave an up-to-date and comprehensive view of the economic, regulatory and technological concerns of the industry.
Since July we have received many favour-able comments as to the relevance of this document and numerous requests for additional copies. Accordingly a new edition has been prepared, rewritten to take account of the changes in the economic forecasts and in light of some
comments solicited from knowledgeable readers. It is being made available for limited distribution to individuals con-cerned with the performance and growth of the Canadian Construction Industry. The Institute for Research in Construc-tion of the NaConstruc-tional Research Council of Canada is the principal technology cen-tre for the construction industry in Canada. It not only offers a wide array of research and testing facilities as well as expertise in many areas, but it is also the main source of construction-related information. We hope that through this document you will gain a better under-standing of the issues facing our industry.
George Seaden Director Institute for Research in Construction
TABLE OF CONTENTS
TRENDS AND ISSUES IN THE CONSTRUCTION INDUSTRY by F.R.S. Clark. 1
Introduction 2
A Mature Industry , ,. . . .. . . 2
Regulation and Liability .. '" . . . .. .. . 4
Technological Innovation .. . . 5
Critical Technical Issues , . .. . . .. . . .. . .. . . . 7
Conclusions. . . 8
ECONOMIC CONSIDERATIONS by A.S. Rakhra , , 11 Executive Summary , . . . .. . . .. .. . 12
Introduction 12 Importance and Nature of the Construction Industry , 13 Impact of Construction on the Rest of the Economy. . . 13
Present Situation of the Construction Industry ... " . . . ... . . 14
Future Outlook for Construction.. . . .. . . .. . .. . . . .. . . 20
Export Promotion and Import Substitution 27 Construction Productivity 30 Summary and Conclusions 31 References. . . 32
BUILDING REGULATION AND THE NATIONAL CODES by R.A. Hewett. .. . 35
Introduction 36 The National Codes. . . 36
National Model Codes: Efficiency Through Uniformity 39 The National Codes: Provincial Adoptions. . . .. . 39
Building Codes and Fire Codes: Limits on Scope 39 Regulations: Their Consolidation and Simplification. . . .. . . 40
Performance Codes. . . 42
Code Complexity. . . 43
Rehabilitation of Existing Buildings 43 NBC Format. . . 44
Standards. . . 45
Evaluation of Materials, Products or Systems " . . . 45
Summary... 46
TECHNOLOGICAL IMPLICATIONS OF MAJOR ISSUES FACING THE CANA-DIAN CONSTRUCTION INDUSTRY DURING THE NEXT DECADE prepared by Revay and Associates Limited. . . 47
Executive Summary . . . 48
Introduction 48
Findings of Principal Reports on Research and Development and
Technology Transfer in Recent Years 49
TRENDS AND ISSUES IN THE
CONSTRUCTION INDUSTRY
by
FerrersR.S.
Clark,Ph.D.
INTRODUCTION , , . . . .. . 2
A MATURE INDUSTRy ".,... 2
Impact and Prognosis 2 Fragmentation , , , , . . . 2
Export Competition , , . . . 3
Productivity , . . . 3
REGULATION AND LIABILITY ,. " , . , , .. . .. . . 4
Regulatory Reform , . . . 4
Litigation Climate , , , .. , . . . 4
TECHNOLOGICAL INNOVATION , , . , , .. . . .. . . .. . . 5
The Construction Ind ustry View. . . 5
Innovation and Exports , " , , . . . 5
Innovation and Governments , .. ,... 5
The Innovation Process. . . 5
Tech nology Transfer , . . . 6
Innovation and Employment .. , . . . 6
Regulation, Technology and Liability. . . 6
The Impact of Research , , . . . 7
Matching Industry Structure to Pace of Innovation 7 CRITICAL TECHNICAL ISSUES. . . 7
Deterioration of the Infrastructu re . . . 7
Rehabilitation , , " , , .. ,... 8
Building Ergonomics ., , , ,... 8
The Electronic Revolution , , , , . 8 CONCLUSIONS ., ,... 8
INTRODUCTION
For the purpose of this document, the construction industry is defined as that part of industry that conducts the entire construction process, from conceptual design and financing, through manufac-ture and assembly, to maintenance of the built environment. The construction industry accounts for 65% of the annual capital investment made in Canada and thus warrants detailed analysis on an ongoing basis.
Facts and figures on the economics, controls and technology development relevant to the construction industry are
A MATURE INDUSTRY
Impact and Prognosis
Construction is one of Canada's largest industries, employing more than 650000 Canadians, and has produced a capital stock of more than $1100 billion. It is a huge engine that converts financial investment into physical assets, such as houses, commercial buildings, industrial plants, roads, bridges and other ele-ments of the general infrastructure. In 1985, the construction and
construction-related industry performed work valued at $66.9 billion, 14% of the Gross Domes-tic Product (GOP). More details on the economic status of the industry are given in the next section of this report, by Rakhra.
Since it is so closely linked to the rest of the economy through the purchase of goods and services, investment in the construction and related industries has a net effect larger than the original invest-ment. By one estimate every dollar spent in construction adds $0.83 to the econ-omy, for a total of $1.83. Therefore, a change in construction activity will lead to greater change in the rest of the economy, through multiplier effects.
2
presented in subsequent papers in this report. This paper focusses on trends and issues of importance to the industry, identified from various sources in Canada and beyond, that cannot be described in statistics. Some of these trends are analyzed in more detail in the sections by Rakhra and Hewett.
In this section the issues essential to analysis of the industry are explored, the issues of regulation and liability are addressed, and finally the principal tech-nological issues facing the construction industry are raised.
The consensus of current economic intel-ligence predicts that up to 1990 the construction industry will outpace the rest of the economy, expanding at about 4.4% each year. However, a decline rela-tive to the growth rate of the Canadian economy is predicted in the following years, although expansion in absolute terms may continue.
Fragmen tation
Construction is a fragmented activity in Canada; the average firm is small and specialized, and according to some sources this fragmentation tends to increase. Government policy has the effect of encouraging the division of large projects to allow smaller firms the opportunity to bid on them. Thus the generally small Canadian firms can com-pete for contracts on segments of mega-projects that would otherwise be won by more vertically integrated foreign companies.
prof-itability of rental developments, discouraging the large contractor or developer. The open tender system favours small, specialized firms. The bid-der willing to take the biggest financial risk, all other things being equal, wins the contract. This system lends advantage to the small operator, with a smaller overhead and less dependence on a steady stream of business than a large firm.
Small, lean, specialized firms are likely to operate with greater efficiency than larger firms with more general
capabilities. The disadvantage is the lack of cohesion in the construction industry; it is seriously fragmented in its overall organization and operations, reducing the quality of communication among its components.
Export Competition
The competitive position of Canadian companies seeking construction con-tracts abroad depends partially on the value of our dollar. Over the next few years the Canadian dollar is expected to gain value relative to the US dollar and to lose ground against other currencies. Nevertheless, exports to the US are not expected to change substantially, and some increase is anticipated in exports to other countries.
The specialization of the industry pro-duces low domestic construction costs, but it also places Canadian industry at a disadvantage in bids for projects abroad. There is more integration of services in non-Canadian construction companies; a Canadian competitive bid involves the formation of new alliances each time, a potentially difficult process.
Advantage over offshore competition would be obtained if Canadian con-struction interests were encouraged to form larger integrated business units for bids on Canadian projects. A relaxation
in the local or provincial preference structure for contract bids would help to achieve this purpose. So would a reduc-tion in the process of breaking large tasks into a number of small contracts, but in this case, foreign bidders for Canadian projects might be more numer-ous.
It would also be productive to promote a "Made in Canada" image for export of construction technology, using a national evaluation system, supported by a labelling program. Such a system would have several advantages domestically as well, in the regulation and liability areas (discussed below).
Canadians have done well in the world market in the design professions: con-sulting engineering and architecture. There are now disturbing trends develop-ing in these activities. Canadian
architects find only 2.5% of their revenue offshore, 35% of this in the USA, and the market is stagnating. Consulting engi-neers win 20% of their revenues in foreign markets, representing 8% of the total world market, but major companies in this area have recently begun to diversify into manufacturing, at least in Canada. Some firms justify this diver-sification by the addition of new technologies to their engineering port-folios, but the level of their investment is probably not sufficient to produce a large impact on their success in the interna-tional market.
Productivity
According to the results of a recent survey run by the Construction Industry Development Council, contractors and owners consider the following factors to be most significant in suppressing con-struction productivity in Canada: restrictive union rules; ineffective com-munications between owners, designers, contractors, suppliers and labour; inade-quate use of planning and scheduling
techniques; and poor quality drawings and specifications. Government regula-tions were not seen as major factors in restricting the growth of productivity. If the Council is correct in its assessment, the trend for non-union construction in recent years may improve labour produc-tivity. A stronger force for increased productivity may be the lower costs if non-union construction workers are used.
Apprenticeship programs and training for the trades in construction never keep up with the demand. Indeed millions of dollars have been spent training con-struction workers who subsequently do
REGULATION AND LIABILITY
Regulatory Reform
Regulations, standards, codes, conven-tions and other controls form an intricate matrix that strongly influences the con-struction industry. The province of Ontario reported in 1985 that 281 provin-cial acts and 472 regulations affected the industry. To this must be added federal statutes and regulations and municipal requirements. Details are given in a sub-sequent section of this report, by Hewett. In recent years the federal and provincial governments have moved to reduce the duplication of regulations, to revise outmoded controls, and to provide for cost/benefit assessments. Experience elsewhere, such as in the American transportation industry during deregulation, shows that disruption occurs when regulatory controls are dis-turbed, and a similar disruption with attendant costs will occur in struction. Some elements of the con-struction industry are thus cautious in their support of the current move to regu latory reform.
4
not use the skills gained. Unions have traditionally handled much of the train-ing required for construction. The trend to non-union labour jeopardizes this training source. Relaxation of the rules governing provincial certification of con-struction trades to allow ski lied labou r more mobility could alleviate this prob-lem to some degree.
The communication problems identified in the survey may result primarily from the specialization of the industry dis-cussed above. The moves to industry aggregation suggested to improve export competitiveness may serve to increase communication and thereby the produc-tivity of the industry generally.
The current state of construction regula-tion may prove a deterrent to the introduction and use of new tech-nologies, but regulatory reform will not necessarily release the flow of new prod-ucts and techniques. On the contrary, the conservatism of the design profes-sion may increase when controls are relaxed for fear of increased grounds for litigation.
Litigation Climate
There is a long history of litigation in the construction industry. Construction pro-jects often have unique aspects,
produced without experience with pro-totypes. Thus the failure rate is higher than in the industrial product sector. Since we live in a society of sophisticated consumers who expect a higher perfor-mance from products than in the past, it is not surprising that legal actions have increased in the construction industry.
Litigation or protection against potential Iitigation constitutes a significant part of construction cost. Avoidance of litigation is a strong motivation for expensive, defensive design and construction pro-cesses and may stifle innovation. Failures and resulting litigation can be reduced by increased quality control throughout the construction process and by enhanced training. Appropriate use of
TECHNOLOGICAL INNOVATION
The Construction Industry View
The efficiency, effectiveness and cost of construction are of vital concern to Canada. One key to optimizing the per-formance of the industry is technology. The importance of construction tech-nology has been demonstrated most recently in the study by Revay and Asso-ciates which forms the last section of this report. The author, Mr. S.D.C. Chutter, conducted a poll among leaders in the construction industry and allied fields. Two-thirds of the issues important to those surveyed had vital or significant technology components. Technology is thus very important to the operations of industry, yet the investment in many con-struction research and development pro-grams is at a relatively low level and declining.
Innovation and Exports
Innovation is important to Canada's con-struction exports. It is the high
technology product that sells offshore, since the lower technology traditional products often have local equivalents in the target market.
Innovation and Governments
The public sector has a big role to play in
regulations can also help, by setting quality expectations. Relaxation of reg-ulations may have the opposite effect, possibly increasing the risk of litigation. The critical issue is whether over-regula-tion is more expensive than the effects of defensive design. No empirical evidence exists on this matter, but clearly a balance is needed.
technology adoption in Canada. Con-struction activity by federal and provincial governments, because of its size, and the willingness and ability of governments to participate in innovative approaches, is ideal for the incorporation of new technology. This early market exposure is invaluable.
The Innovation Process
New processes or products in con-struction, however innovative, rarely catch the public eye. There are no equiv-alents of the transistor, refrigeration or flight. This is not to say that the con-struction practitioner lacks sophistication and technological development. Like most industries the construction industry innovates by an incremental process, adopting small improvements slowly and cautiously, often hampered by the neces-sity of winning code and designer acceptance.
The typical innovation takes from 15 to 25 years to reach the market after con-ception, much longer than the average lifetime of a construction project(1-5 years), or
even
of the average company. Successful adoption of innovations requires a large degree of communica-tion between the innovator and potential users in the industry. Because of the timeinvolved, the users are probably not the innovators themselves. The fragmenta-tion caused by specializafragmenta-tion in the construction industry and the resulting poor channels of communication
between its members thus act strongly to prevent innovation flow. Further, the real beneficiary of the new technology is often the owner, who is not generally involved in the construction process. Thus adoption of innovation also depends on competent marketing.
Technology Transfer
Closing the gap between innovations and potential users is a high priority for the Institute for Research in Construction (I RC) at the National Research Council of Canada (NRCC). The Construction Tech-nology Service at IRC can provide the links needed to transfer innovations from research generated at NRCC and else-where to construction practitioners. Among its resources are the national collection of construction information, the technical advisory service to the National Building Code and associated documents, and various seminars and publications. Another element intended to improve technology transfer, the Canadian Construction Information Ser-vice (CClS), is a joint venture of I RC, the Canada Institute for Scientific and Tech-nicallnformation (CISTI) and the private sector. Designed as a complete tech-nology information source, it will generate relevant data bases and provide access to additional data bases and the facilitators to help practitioners use the information.
Innovation and Employment
Introduction of automation, computer-aided manufacture, robotics and pre-fabrication of construction elements may change the mix of labour skills needed in the construction sector. Each of these innovations reduces the need for the
traditional skills of the construction worker and increases the need for white collar workers. Retraining workers to meet these new challenges will become an important issue in the near future. On the other hand, innovators have recently simplified some aspects of the construction process, thus allowing more unskilled labour to contribute. Modular housing is one example of such innovation.
Regulation, Technology and Liability Construction codes may be either pre-scriptive, where materials or products and elements are specified, or mance-based, where a level of perfor-mance of the system is stipulated. The pressure of new technology has been to justify performance-based construction codes, since such codes may be more readily adaptive to innovation. However, the use of a performance-based code may leave the user more open to liability, since the assurance of good performance from a test carries less weight than the decades of experience implicit in pre-scriptive codes.
Use of new technologies clearly increases uncertainty for the architect, engineer and project manager. They can-not rely as heavily on experience and the accumulated knowledge of their profes-sions. Instead they are required to assess the claims of the enthusiastic innovator and adapt their professional practices to suit new conditions.
If the construction industry is to pro-gress, a mechanism must be introduced to reduce the uncertainty inherent in the use of new technologies. Important ele-ments of this mechanism are the test-beds provided by the research laborato-ries set up to analyse new technologies with more objectivity than could reason-ably be expected of a company
The provinces and other interested par-ties have long advocated a more formal role for such a laboratory, to evaluate for code and regu latory pu rposes the perfor-mance of new construction systems and products, thus filling an important gap between building inspectors on site and the certification process used for certain classes of products. Some of the advan-tages of such a national evaIuation system to Canadian export potential have been discussed above.
The Impact of Research
Construction research has a long and distinguished history in Canada, par-ticularly at the National Research Council. In recent years provincial organizations and universities have con-tributed, as have laboratories of industry trade associations and, to a very limited degree, construction companies them-selves. These groups are effective in solving problems encountered by indus-try, and for advising industry of pitfalls to avoid and short-cuts to the trial and error process of development.
Studies have shown, however, that re-search results generated in laboratories have a poor record of adoption in the market place. The principal failing is a lack of appreciation of the market and production forces beyond the laboratory bench. The level of investment required for commercialization of a product far exceeds that required to produce the
CRITICAL TECHNICAL ISSUES
Deterioration of the fnfrastructureIn dollar terms, probably the most impor-tant task for Canada's public and private investors is repair of our deteriorating roads, bridges, dams and other struc-tu res. Repai r cost of salt-damaged parking garages alone has been
esti-research result and thus the stake of researchers in their innovations does not match the stake of producers.
The answer to this dilemma appears to be an intimate relationship between the research laboratory and the construction industry. The Institute for Research in Construction (IRC) is committed to achieving this relationship. However, it must be recognized that IRC has the additional responsibility of supporting the public good, a responsibility not always in complete accord with the needs of the marketplace.
Matching Industry Structure to Pace of Innovation
Even a minor construction project requires the use of a large number of trades. The construction industry in other countries, notably Japan, has bene-fited from vertical integration, by
concentrating all the skills necessary in one company or company grouping. For an industry that is not subject to rapid change, this is a good management tech-nique, but it is not necessarily appro-priate when innovation moves rapidly. Thus, in the short to medium term, there is probably merit in adopting some ver-tical integration strategy, especially against foreign competition. If, however, plans to promote innovation flow
through the construction system come to fruition, a more flexible method of inte-grating resources will be needed.
mated at over $2 billion. Remedial measu res differ in thei r effectiveness and cost; the choices between these mea-sures can cost hundreds of millions of dollars.
Rehabilitation
Repair and renovation activities in hous-ing already account for more than60%of the residential expenditure in Canada. The technical demands of this process are different from those of new con-struction, yet have commanded little attention in the research community. More stringent safety demands in mod-ern building and fire codes present severe difficulties when older buildings must be made to comply. Particular prob-lems are presented when heritage buildings are concerned; the preserva-tion of the past is sometimes in conflict with the safety and performance expec-tations of today.
Building Ergonomics
The perception people have of how a building performs is as important as the objective view of the building expert. Considerations of this kind offer the highest potential for changing the effi-ciency of use of buildings, since over 95% of a building's lifetime cost accrues during use and operation, not during assembly.
Consider, for example, the elements of the indoor environment: temperature, humidity, light, sound, air quality and space. Not only do these elements have as much to do with how people feel as with the physical measurements of the state of the occupancy, but they also combine to influence the total percep-tion of the space. These perceppercep-tions may govern how people function in buildings. As expectations of building performance
CONCLUSIONS
As befits a large, complex industry, the issues of the present and near futu re of the construction industry are numerous and far-reaching. There are no quick fixes here.
8
rise, the "sick building" syndrome will require more attention, using the exper-tise of those who study such human factors.
Over the last few years barrier-free design has begun to have an impact on Canadian building construction in response to human rights legislation. In 1983-84,39% of Canadians over65 were disabled and the population in this age group will double within the next30 years. The effect of this shift in the needs of building occupants on decision mak-ing is expected to be substantial.
The Electronic Revolution
The promise of computers is an increase in productivity and efficiency in the construction industry. With very few exceptions this promise remains poten-tial only, lacking the research necessary for its realization.
The electronic innovations that have had the most impact on the construction industry to date have been office automa-tion, productivity-enhancing tools and computer-aided design. On the horizon are robotics and computer-aided man-ufacture, smart buildings and expert systems. Much has been written about these issues, but the speed of their adoption has been slow.
One reason for this slow adoption has been the undeveloped state of informa-tion and standards on many of these new technologies. Governments have a role in providing or facilitating the framework required to develop standardized inter-faces and architecture.
In economic terms, the continued suc-cess of the construction industry depends on increasing productivity. Among the keys to increased productivity are: increased communication between
highly specialized construction firms, improved utilization of labour, enhanced technology transfer and regulatory reform.
Success may also be measured in other ways than productivity during construc-tion. Perhaps the most important is the affordability of construction, and this is measured by the continuing demand. Life cycle cost of construction, of which the capital or initial costs are but a small part, is another measu re of success. A clear understanding of the process of innovation would benefit decision makers. The role of research laboratories in this process is clearly more important than has been previously recognized, but their interface with the industry they serve needs strengthening. This task is vital, since innovation in the construction industry is the most clearly identifiable key to increased international market share.
Litigation and its threat are components of construction cost on which new tech-nology has an effect. The development of new technology will be hampered by the
increasing trend to litigation.
The Canadian code system must deal with liability, innovation and the cost of controls, a severe challenge.
New technical issues increase the uncer-tainty of the health of the construction industry. Each issue has great potential to stimulate growth, yet could easily, if mishandled, cause unnecessary high cost. The early recognition of an impor-tant technical opportunity by the research laboratories, and an intimate relationship between them and the con-struction industry, are key elements in the successful exploitation of innovation.
Acknowledgements
The guidance and assistance of col-leagues at IRC and beyond is gratefully acknowledged. In particular, the advice of Don Chutter of Revay and Associates Limited, Slater Grimley of the Industrial Development Office of NRCC and George Seaden, Director of IRC, was invaluable.
ECONOMIC CONSIDERATIONS
by
A.S. Rakhra, Ph.D. (Economics)
Codes and Standards Group
EXECUTIVE SUMMARY... . .. . . . .... .... .. . ... . .. . . .. . .. .. .. . ... .. . ... 12
INTRODUCTION , . . . . .. . . .. 12
IMPORTANCE AND NATURE OF THE CONSTRUCTION INDUSTRY. .. . ... . 13
IMPACT OF CONSTRUCTION ON THE REST OF THE ECONOMY. . . .. . . 13
PRESENT SITUATION OF THE CONSTRUCTION INDUSTRY. . .. . .. .. . 14
Structu re 14 Levels and Past Trends of Construction Activity 14 Growth Rates and Share of Construction Output. . . 16
Regional Growth and Distribution of Construction Activity. . . 19
FUTURE OUTLOOK FOR CONSTRUCTION. . . ... .. ... . . .. . . .. . 20
Demographic Trends . . . 20
Economic Factors 20 Outlook for the Residential Sector1986-1995... 21
Outlook for Non-residential Construction Including Engineering Construction 22 Provincial/Regional Analysis 24 Atlantic Canada 24 Quebec... 25 Ontario. . . .. . .. . . . ... . . .. . ... . . .. . . .. . . . 25 Manitoba. . . 26 Saskatchewan , . . . 26 Alberta, , , . , . . . 26 British Columbia , .. , , , 26 Territories ,... 27
EXPORT PROMOTION AND IMPORT SUBSTITUTION ... " .. ,.,., .. "... 27
Current Exports of Construction Products, Materials and Services. 27 Exports and Import Substitution of Construction Materials. .. . . 28
Exports of Engineering, Building and Architectural Services. . .. . . . 29
Free Trade with the U.S. and the Export of Construction Services. . 29
CONSTRUCTION PRODUCTIVITY. . . 30
Growth of Construction Productivity , . . . 30
Sources of Productivity , . . . 30
Construction Productivity and Current R&D Levels. . . 31
Factors Impairing Construction Productivity. , .. , , , . , . . . 31
SUMMARY AND CONCLUSIONS , , . . . 31
EXECUTIVE SUMMARY
The construction industry is a major industrial group in Canada, in terms of both output and employment level. The impact of its activity is felt in all sectors of the economy through its purchases of building materials, equipment and services.
The present paper provides an economic view of the Canadian construction indus-try. The levels, shares, and trends of construction activity over the last ten years are analyzed by type of construc-tion and by province/region. The most stri king trend that emerges is the increas-ing share of residential renovation. Demographic and economic factors likely to shape the outlook of construc-tion over the next ten years are dis-cussed. Among economic factors, partic-ular attention has been given to world oil prices. Based on various assumptions about demographic and economic vari-ables, construction forecasts are provided for the residential and non-residential sectors for1986-1995. Expected construction growth rates are discussed by province/region in the light
INTRODUCTION
Despite its huge size and great impor-tance to the economy, the construction industry in Canada is highly fragmented and complex; marked by a dwindling domestic market, and slowly growing productivity, it lags behind other indus-tries in generating and adopting new technology. There is an increasing con-cern over its long term performance. In view of this situation} the Institute for Research in Construction decided to take
12
of the recent slide in world oil prices. Growth rates in provinces whose econo-mies depend heavily on oil revenues are expected to be negative until1990; after that they are expected to be positive because of the projected recovery in oil prices. The construction outlook as a whole looks positive up to1989; it is expected to grow faster than the national economy. Beyond1990, growth rates of total construction activity are projected to be lower than those for the Canadian economy.
In view of the gradually falling value of construction output as a percentage of Gross Domestic Product, some important economic issues facing the industry-construction productivity export promo-tion and import substitupromo-tion - are discussed.
Despite its gradually declining share for the last several years, the construction industry has matured and is expected to play an important role in the economy, not because of its dynamism, but because of its sheer size.
an economic view of the past, present and future of the industry. Some major economic issues facing the industry were also addressed. Major construction fore-casting firms were asked to advise on the future outlook of the industry. Several federal government departments with an interest in construction were consulted} and every effort has been made to obtain recent statistical information on con-struction activity.
IMPORTANCE AND NATURE OF
THE CONSTRUCTION INDUSTRY
The construction industry in Canada occupies an important place in the econ-omy. In 1985,640000 workers' were directly employed in construction (6% of the total employed labour force), and this figure exceeded 1.5 million when those employed in the manufacture, sale and transportation of construction materials and equipment were included. The value of work put-in-place by the industry amounted to $66.9 billion,2 about 14% of the total Gross Domestic Product (GOP). In terms of value added to GOP (i.e., net value added to the total output by the construction industry), the contribution of construction to the total national out-put amounts to about 8%.
IMPACT OF CONSTRUCTION ON
THE REST OF THE ECONOMY
Changes in construction activity affect other sectors of the economy through economic 'linkages', such as the pur-chase of construction materials and services from manufacturing and service industries (called 'backward linkages'). Changes in construction activity will thus cause changes in output and employ-ment levels in those industries producing construction materials and services. The impact of these changes will be amplified when the changes filter down to those who supply raw or semi-processed mate-rials to the construction material
manufacturers. For every $100 of con-struction cost, the concon-struction industry spends nearly $36 on materials, $32 on labour, $17 on purchase of business, personal, capital, and other services, and $5 on taxes; $10 goes towards profits.6
The industry is an important consumer of metal fabricated products, lumber and plywood, other wood products, iron and steel, cement and concrete, and whole-sale services.? Construction linkages can also mean the supply of its output (bui Id-ings and structures) to those industries
In financial terms, the industry converts financial investment to physical assets such as industrial plants, buildings, roads and general infrastructu reo The creation of fixed assets is an important aspect of the industry because it enables other economic activities to take place. The value of gross investment in fixed assets and machinery and equipment (capital formation) in 1985 amounted to $87 bil-lion, 65% of which was contributed in residential, non-residential, and engi-neering structures.3
The estimated value of all building stock amounted to $1100 billion in 1980, while an annual expenditure of $10 billion was required for maintenance.4,s
that use it as input; these are called 'forward linkages'.
Finally, linkages can be increased inves-tor and consumer spending induced by construction wage incomes and corpo-rate incomes. The total effect of these types of linkages is normally classified as 'multiplier' or 'ripple' effects. The 1980 Canadian Input-Output Tables, describ-ing the interdependence of various sectors of the economy, indicate that a dollar spent in the purchase of con-struction output will generate a
multiplier effect worth $1.83 in the whole economy; this compares with $1.72 for agriculture, $1.95 for most of the manu-facturing industries, $1.70 for trans-portation, and $1.56 for business ser-vices.6The impacts of multiplier effects,
however, are not felt equally in the various regions of the country. A study by the Economic Council of Canada8in the
seventies found that, for example, 47% of construction material requirements in the Atlantic Region were met by Ontario, 23% by Quebec and other provinces, and
only30% from local sources. This means that the multiplier effects of construction activity in the Atlantic Region do not stay in the region, but spillover to the other regions of Canada through 'leakages' (imports) from these regions.
In brie( the construction industry is an essential part of the economy and it can
PRESENT SITUATION OF THE
CONSTRUCTION INDUSTRY
StructureThe construction industry in Canada is fragmented, marked by divisions and subdivisions of labour. According to Sta-tistics Canada figures for 1985, there are currently 111000 construction firms in Canada, 90% of which have 20 employees or fewer (based on information from Canada Employment and Immigration Commission). Ninety-five percent of con-struction firms have gross operating revenue less than $1 million annually and in combination they produce only 35% of the total contracting construction work performed. Of the total number of firms, 14 000 specialize in residential and
non-residential buildings, 3 000 in heavy engi-neering and road building, and 94000 undertake mechanical, electrical and other special trades work.
Levels and Past Trends of Construction Activity
The value of construction work put-in-place in 1985, as reported by Statistics Canada, amounted to $66.9 billion,
*
an *In July 1986, Statistics Canada revised the NationalIncome and Expenditure Accounts System. As a result of this revision, construction expenditure, for example in 1985, has gone up by about $5.4 billion. This entire increase occurred in residential construction, resulting in a sharp increase in residential share of total construction. For more on this revision contact Gross National Product Division, Statistics Canada, Ottawa,
14
make a substantial contribution to the attainment of national, social and eco-nomic development goals. It can do this both directly and indirectly through its demand for inputs. However, it is not the 'engine' or 'growth pole' of the eco-nomic development of the country. Sheer size alone makes it a key sector in the economy.
8.4% increase over the 1984 level of $61.7 billion, and a 31% increase over the 1980 level of $50.9 billion.2Most of the
increase originated in housing, manufac-turing and finance. The engineering sector did not grow much.
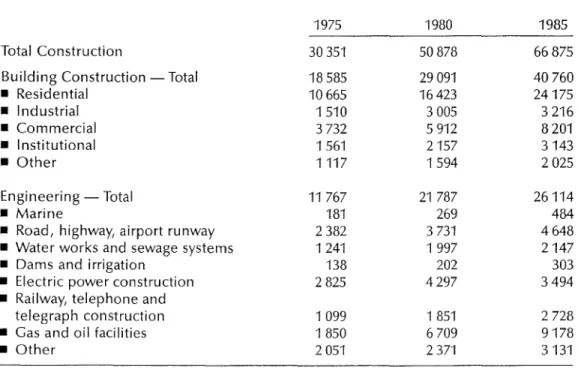
Sixty percent of construction activity occurred in the building sector and the remaining 40% in the engineering sector. The share of the engineering sector has declined for the last four years, mainly because of the decline or slow growth of electric power construction. In building construction, residential construction was the single largest contributor, fol-lowed by commercial, industrial,
institutional and other building construc-tion. Railway, telephone and telegraph construction and gas and oil facilities construction showed a significant increase over the 1975-1985 period (Fig-ure 1 and Table1). Gas and oil facilities construction, however, has recently declined because of plummeting world oil prices.
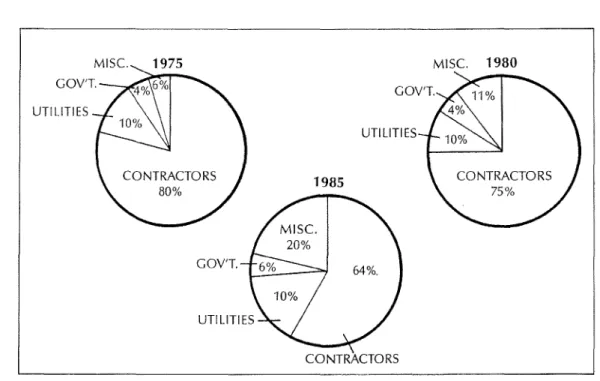
Construction activity can be of two types: new and repair. In 1985 (according to the revised statistics) new construction accounted for 85% of the total, and repair construction, 15%. The share of repair construction has been on the rise (Fig-ure 2). The increase in renovation con-struction (which includes repairs,
1980
1985 1975
Figure 2
Repair activity as proportion of total construction
Source: Statistics Canada, Construction in Canada, Cat. No. 64-201, various issues 1980 ENGINEERING OTHER BUILDINGS 4% INSTITUTIONAl. RESIDENTIAL RESIDENTIAL OTHER BUIl.DINGS 3% INSTITUTIONAL5%,-,...,.,...-_ INDUSTRIAL COMMERCIAL COMMERCIAL ENGINEERING RESIDENTIAL OTHER BUILDINGS 3% INSTITUTIONAL 4% '-'....,,_ _ INDUSTRIAL 1985 COMMERCIAL 1975 ENGINEERING ENGINEERING 67 , -(Projected 1991-1995 Average) I
i
63 55 : , -,--:
I I I I I I I I I I I I I I I I I I I I I I I Year 47 -35 -1977 1980 1985 1990 1995 70 60 20 10o
Figure 3Value of residential renovation as percentage of total residential construction
Source: Statistics Canada data and the Residential Construction Forecast by Clayton Research Institute, prepared for IRC 1990 RESIDENTIAL OTHER BUILDINGS 3% INSTITUTIONAL 4%- •.-r''''--' INDUSTRIAL COMMERCIAl. ENGINEERING OTHER BUILDINGS 3% INSTITUTIONAL
l'T'T'-_
INDUSTRIAL RESIDENTIAL Figure 1Construction share by sector (in percentages) Source: Based on data produced by Statistics
Canada and Construction Forecast (June 1986) by Informetrica Ltd. COMMERCIAL
TABLE 1 Value of construction work performed - principal type of construction 1975,1980,1985 (in millions of dollars)
1975 1980 1985
Total Construction 30351 50878 66875
BUilding Construction - Total 18585 29091 40760
• Residential 10665 16423 24175 • Industrial 1510 3005 3216 • Commercial 3732 5912 8201 • Institutional 1561 2157 3143 • Other 1117 1594 2025 Engineering - Total 11767 21787 26114 • Marine 181 269 484
• Road, highway, airport runway 2382 3731 4648
• Water works and sewage systems 1241 1997 2147
• Dams and irrigation 138 202 303
• Electric power construction 2825 4297 3494
• Railway, telephone and
telegraph construction 1099 1 851 2728
•
Cas and oil facilities 1850 6709 9178•
Other 2051 2371 3131Sources: Statistics Canada, Revised Construction Expenditures, CANSIM, Sept. 8, 1986, and Statis-tics Canada, Construction in Canada, Cat. No. 64·201, various issues.
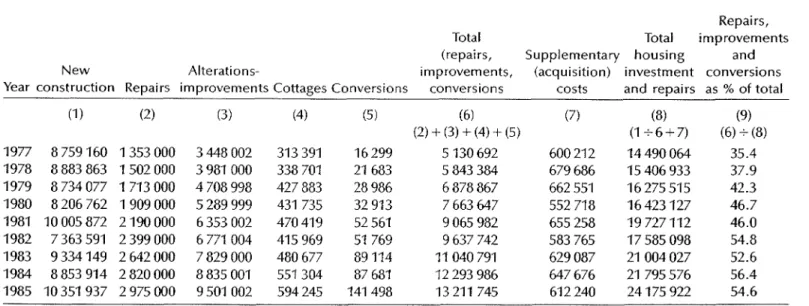
alterations and improvements), has been remarkable in the residential sector. Its proportion has increased dramatically from 35% in 1977 to 55% in 1985 (Figure 3 and Table 2).
Construction activity consists of two components; 'contract construction' and 'other construction'. The second compo-nent includes construction work
performed on 'own account' by public owners (e.g., utilities, governments, industries other than construction, trade, finance, commercial and housing. There has been a decline in the share of contract construction activity in recent years, from 80% in 1975 to 64% in 1985, while the share of lother construction' rose from 20% in 1975 to 36% in 1985 (Figure4). This increase came mainly from construction work performed by
16
the labour forces of the primary, manu-facturing, trade, finance, commercial, residential and institutional sectors.
Growth Rates and Share of
Construction Output
The growth of construction output in the last decade has been slower than the growth of the Cross Domestic Product (CDP). Between 1976 and 19851
construc-tion output in constant (1981) dollars grew annually at an average (compound) growth rate of 2.91%, while the CDP (also in 1981 dollars) recorded an annual growth rate of 3:12% (calculated from Table 3). Also, the construction share of the CDP has been gradually declining for several years (Table 3). The decline in the percentage of construction when
calcu---l
'"
TABLE 2 Value of renovation activity (repairs, improvements, conversions) as a proportion of residential construction 1977-1985 (Canada current dollars, thousands)
Repairs,
Total Total improvements
(repairs, Supplementary housing and
New Alterations- improvements, (acquisition) investment conversions
Year construction Repairs improvements Cottages Conversions conversions costs and repairs as % of total
(1) (2) (3) (4) (5) (6) (7) (8) (9) (2) + (3) + (4) + (5) (1-0-6+7) (6) -0- (8) 1977 8759160 1353000 3448002 313 391 16299 5130692 600212 14490064 35.4 1978 8 883 863 1 502 000 3981000 338701 21683 5843384 679686 15406933 37.9 1979 8 734 077 1 713 000 4708998 427883 28986 6878867 662551 16275515 42.3 1980 8 206 762 1 909 000 5289999 431735 32913 7663647 552718 16423127 46.7 1981 10005872 2190000 6353 002 470419 52561 9065982 655258 19727112 46.0 1982 7363591 2399 000 6771004 415969 51769 9637742 583765 17585 098 54.8 1983 9334149 2642 000 7829 000 480 677 89114 11040791 629087 21004027 52.6 1984 8853 914 2820000 8835 001 551304 87681 12 293 986 647676 21795576 56.4 1985 10 351937 2975 000 9501002 594245 141498 13 211745 612240 24175922 54.6
UTILITIES 1985 UTILITIES MISe. 1980 CONTRACTORS Figure 4
Construction output sharebycontractors, utilities, governments and miscellaneous* * "Miscellaneous" consists of construction work done by firms not primarily engaged in the construction
industry, i.e. the construction labour forces of primary (except construction), manufacturing, trade, finance, commercial, residential and institutional sectors.
TABLE 3 Value of construction work and its share in GOP (current and constant (1981) dollars, millions, 1976-1985)
Construction G ross Domestic Construction Work
Work* Product as Percentage of GOP
Constant Constant Calculated Calculated
Current (1981 ) Current (1981) from cu rrent from constant
dollars dollars dollars dollars dollar figu res dollar figures
(1 ) (2) (3) (4) (1)-T(3)= (Sa) (2)-7-(4)= (5b) 1976 34335 45095 194630 295790 17.64 15.25 1977 37167 46285 217879 311 701 17.05 14.85 1978 39817 47009 241604 325612 16.48 14.43 1979 45032 49704 276096 338353 16.31 14.69 1980 50878 5424" 309891 343560 16.41 15.79 1981 60246 60246 355994 355994 16.92 16.92 1982 60069 56615 374750 344123 16.03 16.45 1983 60101 55752 405425 354703 14.82 15.71 1984 61722 55756 443327 374432 13.92 14.89 1985 66875 58304 476361 389184 14.04 14.98
*Revised figures from recent revision in National income and Expenditure Accounts System.
Source: Based on figures received from Gross National Product Division, Statistics Canada, Sept. 8,1986.
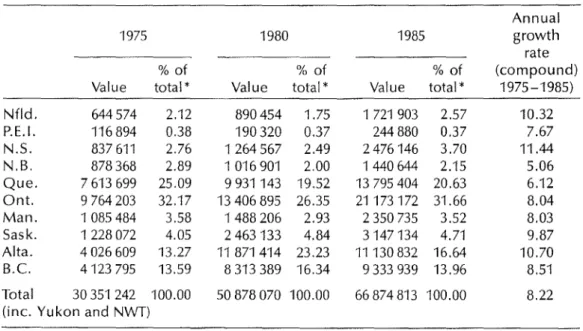
TABLE 4 Value of construction output, by province 1975, 1980, 1985 (millions of dollars) Annual 1975 1980 1985 growth rate % of % of % of (compound)
Value total* Value total* Value total* 1975-1985)
Nfld. 644 574 2.12 890454 1.75 1721903 2.57 10.32 P.E.1. 116894 0.38 190320 0.37 244 880 0.37 7.67 N.S. 837611 2.76 1264 567 2,49 2476146 3.70 11.44 N.B. 878368 2.89 1016901 2.00 1440644 2.15 5.06 Que. 7613 699 25.09 9931143 19.52 13 795 404 20.63 6.12 Onto 9764 203 32.17 13406895 26.35 21173172 31.66 8.04 Man. 1085484 3.58 1488206 2.93 2350735 3.52 8.03 Sask. 1228072 4.05 2463133 4.84 3147134 4.71 9.87 Alta. 4026609 13.27 11 871 414 23.23 11130832 16.64 10.70 B.C. 4123795 13.59 8313389 16.34 9333939 13.96 8.51 Total 30351242 100.00 50878070 100.00 66874813 100.00 8.22 (inc. Yukon and NWT)
*Total may not add up to one hundred due to rounding.
Source: Statistics Canada, Gross National Product Division, CANSIM, September 8, 1986.
lated from current dollar figures has been significant, compared with the decline in the percentage when calculated in con-stant dollars (columns 5a and 5b of Table 3).
Regional Growth and Distribution of Construction Activity
Growth rates in construction activity for 1975-85 were higher in some parts of the country than in others (Table 4). British Columbia, Alberta, Saskatchewan, Nova Scotia and Newfoundland recorded growth rates higher than the national average; Manitoba, Ontario, Quebec, New Brunswick, and Prince Edward Island lagged behind the national growth rate. Most construction growth in the western provinces and Nova Scotia and Newfoundland was oil and gas related. In the case of Alberta, the rapid construc-tion growth occurred during 1975-1980,
and declined marginally during 1980-1985. In Newfoundland and Nova
Scotia, construction activity almost dou-bled during 1980-1985, mainly because of off-shore oil-related activities. In
Saskatchewan, construction growth occurred consistently throughout 1975-1980 and 1980-1985.
Construction activity in Nova Scotia grew rapidly between 1975 and 1985. Its share in the total construction activity rose from 2.76% in 1975 to 3.70% in 1985. Alberta's share has now begun to decline with the drop in oil prices, falling from 23.33% in 1980 to 16.64% in 1985. The share of British Columbia also declined from 16.34% in 1980 to 13.96% in 1985. The shares of Quebec and Ontario declined between 1975 and 1980, to rise again in 1980-1985 (Table 4). Taken together, Quebec and Ontario account for 52% of the total construction output in 1985, a drop from about 57% in 1975.
FUTURE OUTLOOK FOR
CONSTRUCTION
The outlook for construction activity for a very short term (6-12 months) can be safely predicted from past trends and information on investment intentions collected by Statistics Canada. Forecasts for the medium to long term (5-10 years), however, require the prediction of demo-graphic trends that directly affect
residential construction and certain other infrastructure projects, as well as eco-nomic factors that influence industrial and commercial sectors more directly than residential sectors. These predic-tions are described in this section and subsequently in the forecast.
Demographic Trends
The growth rate of the Canadian popula-tion has been declining, the populapopula-tion is aging and household formation has slowed, especially among young people. These trends are expected to continue for the next 10-15 years, barring any major change in immigration policy. It is projected that, on the average, about 256000 persons will be added to the Canadian population every year between 1986 and 1991.9The average annual
growth rate is expected to decline to 236000 in the 1991-1996 period. Popula-tion growth over the next ten years will be dominated by increases in the 35-54-year and 65-35-54-year and over age groups; declines in the population will occur among the 15-24-year and 25-34-year age groups.
Household formation is one of the most important determinants of residential construction activity. The rate of house-hold formation declined between 1981 and 1986 because of recessionary condi-tions; however, it is expected to increase slightly between 1986 and 1991 because of improvements in economic conditions (encouraging the young and the elderly to live independently), combined with
20
rising divorce and separation rates. Our-ing1991-1995, declines in the population of the younger household forming age groups are expected to result in a signifi-cant reduction in total household growth to an average of 141000 per year.9
House-hold growth in 1986-1996 is expected to be dominated by Central Canada, especially Ontario, and the western regions' share of household growth is projected to increase beyond 1996. The implications of these demographic trends are greater for residential than for non-residential construction. The growth in the 45-54-year age group implies that middle-aged persons will dominate the housing market in the 1980s and '90s. More attention will have to be paid to their preferences and requirements. Similarly, a rise in the number of elderly suggests that greater consideration must be given to their special needs in terms of 'functionality' and 'accessibility'. A declining growth rate in household for-mation implies a decrease in housing requirements. A CMHC study forecasts that annual housing requirements will decline to 105 000 between 1996 and 2001,10 down from 165 000 in 1985.
Economic Factors
Economic factors such as general eco-nomic activity level, disposable income levels, the response of housing expen-ditures to changes in the level of income (called income elasticity of demand for housing), interest rates, inflation levels, and external factors such as world oil prices and US interest rates, influence construction activity. The non-residential sector of construction is more sensitive to these factors than the residential sec-tor, although such factors as interest rates and general economic activity affect both. These factors influence both the demand and the supply of construction
activity. Changes in fiscal and monetary policies of governments also influence the level of construction activity. General economic activity level can be represented by growth rates of national income, level of capacity utilization of the national economy and of the industry in which construction investment is to be determined, unemployment rate, etc. A declining level of national income and a rising level of general unemployment rates are likely to dampen the demand for construction investment. High inter-est rates will discourage potential home owners from buying new homes. High US rates are likely to push Canadian rates up and hence adversely affect Canadian construction investment. A domestic monetary policy of supporting the Cana-dian dollar by using interest rates will also hurt construction activity. World oil prices affect construction activity in two ways. First, declining world oil prices will lead to the cancella-tion or postponement of proposed oil and gas projects and the supporting con-struction facilities and buildings. The second effect of declining oil prices will be positive: lower prices for consumer and producer goods with high energy content. This will result in higher demand for the expansion of plants and warehouse buildings. A lower level of prices will slow down the inflation level, which in turn will allow monetary authorities to lower interest rates. Assuming the real level of income remains the same, lower inflation levels leave more income with the consumer to spend. If he decides to spend this addi-tional income on housing, the demand for housing will increase. A lower infla-tion level may lead to lower prices for building materials and other services. This may lower the initial cost of build-ings and hence boost the demand. The medium to long term forecast for construction investment requires
consid-eration of the relationship of these factors with construction investment. From this relationship, construction investment is forecast. It is assumed that the relationship of construction invest-ment (dependent variable) with various determining factors (independent vari-ables) remains unchanged over the period of forecast.
Outlook for the Residential Sector
1986-1995
The near term (1-2year) outlook for residential construction, according to several construction forecasting
companies such as lnformetrica, Clayton Research Associates, Canadata, and CMHC, is positive. This outlook is based on housing starts ranging from165 000to 175 000for1986.They differ, however, on their medium to long term forecast depending on assumptions.
In June1986,the Institute for Research in Construction, National Research Council of Canada, commissioned Clayton Research Associates Limited to prepare projections for residential construction in Canada, both nationally and by region for the next decade.9 These projections are based on the following assumptions:
• average annual growth in GNP of 2.5-3.5% in1986-1995;
• average inflation rate of4-5%; • generally stable interest rates
slightly below current levels. According to the forecast by Clayton Research Associates,9 average annual housing starts will increase in the 1986-1990period to167 000units,
com-pared with153 000 in1981-1985(Table 5). Regionally, the expected increase in aver-age annual starts is due mainly to a projected rise in Ontario. Starts in the Prairie provinces (particularly Alberta) and British Columbia are projected to decline from the average annual level of 1981-1985.A decline to an average143 000
TABLE5 Average annual housing starts by region of Canada1976-1995
*
Actual Projected
1976-1980 1981-1985 1986-1990 1991-1995
Region Thousands of Units
Atlantic 15 12 12 10 Quebec 48 37 42 34 Ontario 67 51 69 57 Prairies 58 30 26 26
S.c.
33 24 18 17 Canada 229 153 167 143 %Distribution by Region Atlantic 7 7 7 7 Quebec 22 24 25 24 Ontario 30 33 41 40 Prairies 26 20 15 18 B.C. 15 15 11 12 Canada 100 100 100 100• Calendar year periods. Totals may not add up to 100% due to rounding.
Source: CMHC and Clayton Research Associates
units per year is projected for1991-1996. All regions, except the Prairie provinces, are forecast to share in the decline in starts.
In terms of dollar value, total residential construction expenditures (new plus renovation) are projected to rise from an annual average of$20.12billion in 1981-1985to $26.23 billion in1986-1990 and $27.65billion in1995, all in constant (1985) dollars (Table6). Renovation work, which is' already a large part of residential construction, will account for an in-creasingly large share throughout the next decade. By1990-1995, renovation work should account for67%of total residential construction, compared to 63% in1986-1990(Figure3). Interestingly enough, the average annual value of renovation work during1986-1990 is expected to exceed that of new residen-tial construction work by29%. In1985 dollars, the annual value of residential renovation (repairs - work undertaken to maintain the original quality of a
22
dwelling, and improvements - work which upgrades a dwelling or extends its lifetime) is expected to rise from an estimated average of$10.71 billion for 1981-1985to$17.68billion for the 1991-1995period. All regions are pro-jected to share the increase in residential renovation expenditures over the next ten years.
The increasing share of renovation may force construction firms specializing in new construction to diversify their activities to include repairs. This diver-sification will be easier for small firms than for big firms. Rising renovation con-struction may also provide an incentive to skilled tradesmen to become con-tractors for renovation work. As a result, the number of construction firms will increase.
Outlook for Non-residential Construction Including Engineering Construction Construction forecasting firms such as
Lセ
...
TABLE 6 Residential construction expenditures by type and region of Canada,annual averages for 1981-1985, 1986-1990, 1991-1995 (millions of 1985 dollars)
1981-1985 1986-1990 1991-1995
Region New Renovation Total New Renovation Total New Renovation Total
Atlantic 624 700 1324 720 1200 1920 566 1400 1966 Quebec 2069 3000 5069 2521 4100 6621 2073 4800 6873 Ontario 3462 4002 7464 5198 5600 10798 4343 6800 11143 Prairies 1 711 1730 3441 1709 2217 3926 1755 2675 4430 B,C. 1548 1278 2826 1350 1700 3050 1242 2000 3242 Canada 9414 10710 20124 11498 14817 26315 9979 17675 27654 Totals may not be exact duetorounding,
Sources: Statistics Canada and Clayton Research Associates, prepared for IRC, July1985 (revised in September 1986),
Informetrica and Canadata believe that while the short term outlook for non-residential construction has been damp-ened by the recent slide in world oil prices, the long term outlook over the next 10-15 years looks quite encourag-ing, The sudden decline in oil prices will result in cancellation or postponement of oil-related projects and this will affect construction activity in the oil-producing provinces, On the other hand, declining oil prices will boost the economies of oil consuming provinces and, on balance, the overall impact of the oil price decline on the Canadian economy will be positive, They believe, however, that after 1987, oil prices may firm up and oil and gas construction may resume its previous rapid growth,
Informetrica has just released a special edition of the Construction Forecast Ser-vice,11 It updates their previous construc-tion forecast, reflecting the sharp drop in world oil prices. The assumptions on which this revised forecast is based are as follows:
• world oil prices per barrel ($US) of $15.6 for 1986, $15.88 for 1987, $'18.38 for 1988, $21 for 1989, reaching $33.18 by 1995; • a $12 billion (in 1985 dollars)
municipal government
infrastruc-ture spending program during 1987-1992;
• the provisions of the February 1986 budget;
• Canadian interest rates 1% higher than the US rate;
• restraint in social spending. The forecast figures are in 1971 dollars and relate to new construction
invest-ment only.
Despite the near term weakness in energy investment, Informetrica fore-casts that construction
activity
wi II remain one of the key contributors of gross national income, not because of itsspectacular performance, but because of
its sheer size. Non-residential sector con-struction (incl udi ng engi nee ring) is expected to resume rapid growth after 1987, escalating from a growth rate of 5.7% in 1987, to 10.2% in 1988, when energy prices are assumed to begin moderate recovery (Table 7). Over the period 1986-1995, non-residential con-struction is projected to grow at the average annual rate of 4.5%, compared with 1,3 % for residential construction and 2.8% for gross national income. Industrial construction is projected to show the strongest performance (8.3%), mainly because of low energy prices, manufacturing plant construction, and
TABLE 7 Construction investment by structure type (millions of 1971 dollars) Structu re Type 1986 1987 1988 1989 1990 1995 Levels Total Investment 18477 19245 20679 21303 21540 23679 Buildings - Total 10752 11127 11617 11769 11787 12110 Residential 5715 5754 5811 5777 5646 5169 Commercial 2546 2711 2952 2966 2982 3459 Institutional 1084 1063 1076 1079 1087 1155 Other 598 646 693 730 754 850 Engineering - Total 7725 8118 9062 9534 9753 11569 Marine 145 159 176 184 193 198
Road, highway, runway 1308 1474 1750 1823 1886 1944
Water and sewage systems 806 895 1057 1059 1085 1159
Dams and irrigation 89 95 105 108 111 117
Power 1283 1382 1544 1667 1591 1965
Railway, telephone 588 652 730 728 673 977
Oil and gas 2601 2478 2618 2788 2981 3844
Other 906 983 1082 -1175 1234 1364
Total nonresidential
investment 12763 13491 14867 15526 15894 18511
Source: Informetrica Ltd., Provincial Construction Out/oak to 2005, June 1986.
stable economic environments. Though expected to decline in the near term, oil-and gas-related construction will also show a strong performance in the -1990s, because of the projected revival of oil and gas projects.
Provincial/Regional Analysis
Over the last 3-4 years, the focus of medium term outlook has shifted to Central Canada from Western Canada, as manufactured-led growth became the key to the outlook. The consequence of the oil accord with the western provinces was to switch the emphasis back to Western Canada for a time, until the recent slide in world oil prices returned the emphasis to those areas that benefit most from low oil prices and enhanced world markets.
In the long run, however, most fore-casters, including Informetrica Ltd.,
24
believe that the firming up of oil prices in the late 1980s or early 1990s will stimulate the resumption of construction growth in the oil-rich provinces. The growth rates of construction in various provinces are provided in Table 8.
Atlantic Canada
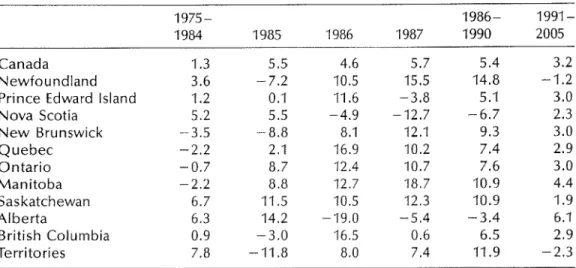
Apart from the dependence on its tradi-tional resources, such as fishing and forest products, the Newfoundland economy has become dependent on oil development. With the decline in oil and commodity prices, the non-residential construction industry (including engi-neering) in Newfoundland will suffer a decline in the near term. The delay of the production start-up of Hibernia until 1994 will further soften the near term outlook. After the conclusion of Hibernia and other power projects in the mid-1990s, the growth of the non-residential sector will begin to decline (Table 8).
TABLE8 Non-residential structures investment, average annual compound rates of growth 1975- 1986- 1991-1984 1985 1986 1987 1990 2005 Canada 1.3 5.5 4.6 5.7 5.4 3.2 Newfoundland 3.6 -7.2 10.5 15.5 14.8 -1.2
Prince Edward Island 1.2 0.1 11.6 -3.8 5.1 3.0
Nova Scotia 5.2 5.5 -4.9 -12.7 -6.7 2.3 New Brunswick -3.5 -8.8 8.1 12.1 9.3 3.0 Quebec -2.2 2.1 16.9 10.2 7.4 2.9 Ontario -0.7 8.7 12.4 10.7 7.6 3.0 Manitoba -2.2 8.8 12.7 18.7 10.9 4.4 Saskatchewan 6.7 11.5 10.5 12.3 10.9 1.9 Alberta 6.3 14.2 -19.0 -5.4 -3.4 6.1 British Columbia 0.9 -3.0 16.5 0.6 6.5 2.9 Territories 7.8 -11.8 8.0 7.4 11.9 -2.3
Source: Informetrica Ltd., Provincial Construction Outlook to 2005, June 1986
For Prince Edward Island, with no major plans for expansion of the government sector, the growth of construction activity will depend mainly on traditional sectors such as agriculture and fishing; moderate growth rates are expected for these sec-tors due to positive impacts of low energy prices. These rates may be mod-erated by low commodity prices. The non-residential sector can expect a growth rate of about11%in the near term. Its growth will be negative in1987, followed by a slow rise.
In Nova Scotia, some energy develop-ment is likely to continue, but weaker energy prices are expected to hasten the abandonment or postponement of the Venture gas field development. As a result, growth rates in the non-residential sector will suffer a serious decline in the long run (Table 8).
The outlook for the non-residential sec-tor in New Brunswick remains favourable for the long run. However, the emphasis is expected to shift from modernization of the pulp and paper industry to con-struction by government and institutions.
Quebec
As a result of lower energy prices, con-struction in the manufacturing sector will continue to dominate construction activity in Quebec. Modernization and expansion by the pulp and paper and aircraft industries, and expansion of transportation equipment, are expected to add to the growth of non-residential construction in Quebec. After1990, the projected growth of non-residential con-struction is based on assumed exports of electric power to the United States.
Ontario
Over the medium term, the industrial advantages of relatively low energy costs, a strong US market and declining interest rates will continue to stimulate growth in Ontario, and non-residential construc-tion is expected to show a strong performance. The medium term perfor-mance reflects significant investment by domestic automobile and parts manufac-turers, accompanied by the presence of Asian firms. In addition, the expected