Supplement of The Cryosphere, 14, 3785–3810, 2020 https://doi.org/10.5194/tc-14-3785-2020-supplement © Author(s) 2020. This work is distributed under the Creative Commons Attribution 4.0 License.
Supplement of
The firn meltwater Retention Model Intercomparison Project (RetMIP):
evaluation of nine firn models at four weather station sites on the
Green-land ice sheet
Baptiste Vandecrux et al.
Correspondence to:Baptiste Vandecrux (bav@geus.dk)
2
Supplementary Text S1: Specific notes related to the models
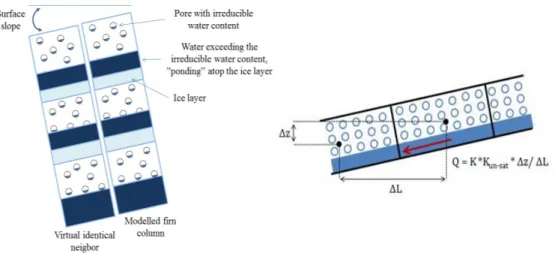
Darcy-like runoff routine in the GEUS modelWhile the firn model from Vandecrux et al. (2018, 2020) did not allow runoff from the firn, we here implemented a novel runoff scheme that considers that available water (beyond irreducible water content) may exit the model column based on the local surface slope and simulated firn characteristics. The parameterization originates from the following conceptual model. Given a modelled firn column, we can append to it an identical virtual neighbor and consider that the two columns are inclined with an angle equal to the site’s surface slope (Table 3, Figure S1). In that situation, the excess water in our firn column is allowed to flow along the slope into the corresponding layer of the virtual downstream column based on Darcy’s law (Figure S1). Darcy’s law makes the water flux to the downstream neighbor dependent on the surface slope, the amount of water available and on each layer’s hydraulic conductivity.
Figure S1. Illustration of the runoff calculation in the GEUS model. The modeled firn column is appended a virtual twin and the two are inclined according to the surface slope. The water flux out of the main column into the virtual neighbor can be calculated based on each layer’s hydraulic conductivity, water content and surface slope.
Adaptation of the surface forcing in the MeyerHewitt model
In Meyer and Hewitt (2017), we use a simplified snow permeability κ as a function of the porosity ϕ, which is given by
where dp is the snow grain size and 180 is an empirical constant. Here we use the full Carman-Kozeny permeability, which
is given by
and take dp = 10−4 m.
For the RetMIP experiments, the temperature and melt rate are given at the surface. This is a different type of boundary condition than is implemented in Meyer and Hewitt (2017), which instead requires a surface energy flux and computes the surface temperature and/or melt rate. To account for this, we derive an (approximate) equivalent surface energy flux from
3
the given temperature and melt rate. The model-computed temperature and melt rate are then not exactly the same as those given but are most of the time very close. Starting from equation (15) in Meyer and Hewitt (2017), the surface energy balance is
We estimate that the first (advective) term and the second (conductive) term are relatively small in this equation, with the dominant balance being between the terms on the right: the prescribed flux Q, the parameterized surface-air heat exchange
h(T − Tm), and the latent heat of melting ρwL M. The smallness of the first two terms is reflected by the relatively large
Stefan number S and the Péclet number Pe, defined in Meyer and Hewitt (2017). We note however that the conductive term may be important in situations of rapidly changing temperature, and this accounts for the differences between our model-derived surface temperature and the prescribed values shown in Figure S2 below. Neglecting the terms on the left we have
and we use this to infer the equivalent energy flux Q(t) to be used as the input to our model code, from the given time series of T and M . In Figure S2, we compare the given surface temperature input to the surface temperature output by the code. The agreement is mostly good, which validates the method for computing the surface forcing.
Figure S2: Comparison between input surface temperature from RetMIP and output surface temperature from the Meyer and Hewitt (2017) model forced with adapted energy flux. The two temperatures agree quite well, although the model output surface temperatures have a smaller amplitude than the RetMIP input.
4
Supplementary Figures:
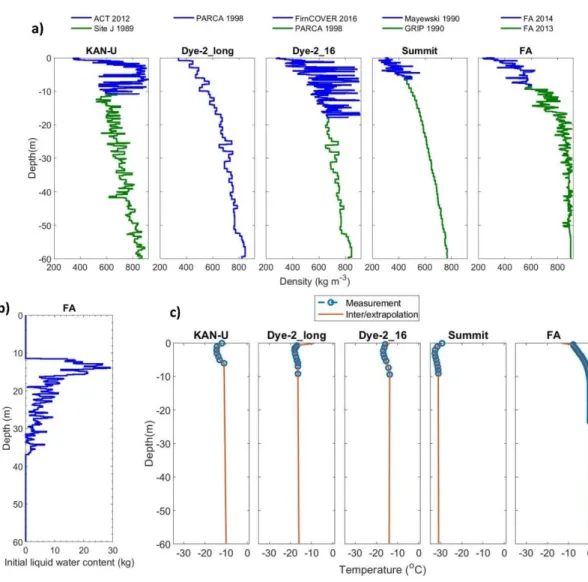
Figure S3. Surface forcing given to all firn models at Dye-2 for the 1998-2015 period (a) and for the 2016 summer (b), at KAN_U for 2012-2016 (c), at Summit for 2000-2015 (d) and at FA for May-Nov. 2014 (e).
5
Figure S3. (continued)