• Aucun résultat trouvé

Accuracy Study and Improvement of Network Simulation in the SimGrid Framework

N/A
N/A
Protected

Academic year: 2021

Partager "Accuracy Study and Improvement of Network Simulation in the SimGrid Framework"

Copied!
11
0
0

Texte intégral

(1)

HAL Id: inria-00361031

https://hal.inria.fr/inria-00361031

Submitted on 15 Feb 2020

HAL is a multi-disciplinary open access

archive for the deposit and dissemination of

sci-entific research documents, whether they are

pub-lished or not. The documents may come from

teaching and research institutions in France or

abroad, or from public or private research centers.

L’archive ouverte pluridisciplinaire HAL, est

destinée au dépôt et à la diffusion de documents

scientifiques de niveau recherche, publiés ou non,

émanant des établissements d’enseignement et de

recherche français ou étrangers, des laboratoires

publics ou privés.

Accuracy Study and Improvement of Network

Simulation in the SimGrid Framework

Pedro Velho, Arnaud Legrand

To cite this version:

Pedro Velho, Arnaud Legrand. Accuracy Study and Improvement of Network Simulation in the

Sim-Grid Framework. SIMUTools’09, 2nd International Conference on Simulation Tools and Techniques,

Mar 2009, Rome, Italy. �inria-00361031�

(2)

Accuracy Study and Improvement of Network Simulation in

the SimGrid Framework

Pedro Velho

University of Grenoble – INRIA MESCAL Project LIG Laboratory - ENSIMAG - 51 Avenue Jean Kuntzmann 38330 MontBonnot SaintMartin

-France

pedro.velho@imag.fr

Arnaud Legrand

CNRS – University of Grenoble – INRIA MESCAL Project

LIG Laboratory - ENSIMAG - 51 Avenue Jean Kuntzmann 38330 MontBonnot SaintMartin

-France

arnaud.legrand@imag.fr

ABSTRACT

Distributed computing is a very broad and active research area comprising fields such as cluster computing, computa-tional grids, desktop grids and peer-to-peer (P2P) systems. Studies in this area generally resort to simulations, which enable reproducible results and make it possible to explore wide ranges of platform and application scenarios. In this context, network simulation is certainly the most critical part. Many packet-level network simulators are available and enable high-accuracy simulation but they lead to pro-hibitively long simulation times. Therefore, many simula-tion frameworks have been developed that simulate networks at higher levels, thus enabling fast simulation but losing ac-curacy. One such framework, SimGrid, uses a flow-level ap-proach that approximates the behavior of TCP networks, including TCP’s bandwidth sharing properties. A prelim-inary study of the accuracy loss by comparing it to popu-lar packet-level simulators has been proposed in [11] and in which regimes in which SimGrid’s accuracy is comparable to that of these packet-level simulators are identified. In this article we come back on this study, reproduce these ex-periments and provide a deeper analysis that enables us to greatly improve SimGrid’s range of validity.

Categories and Subject Descriptors

I.6.4 [Model Validation and Analysis]: Network Simula-tion; I.6.7 [Simulation Support System]: SimGrid,GTNetS

General Terms

Network Simulation

1.

INTRODUCTION

In the last few decades, considerable breakthroughs in eScience, peer-to-peer and collaborative computing have been achieved. These emerging technologies are however based on

Permission to make digital or hard copies of all or part of this work for personal or classroom use is granted without fee provided that copies are not made or distributed for profit or commercial advantage and that copies bear this notice and the full citation on the first page. To copy otherwise, to republish, to post on servers or to redistribute to lists, requires prior specific permission and/or a fee.

SIMUTools’09, Rome, Italy

Copyright 2009 ICST 978-963-9799-45-5.

the connection of thousands of resources through a wide area network. Hence such systems have a dramatically increas-ing conception complexity and research in this area gener-ally boils down to the development of better systems and algorithms.

Evaluating the merit of alternative designs or solutions is hard for many reasons. First, real experiments on such large-scale distributed platforms are considerably time consuming. Second, network devices and software have many possible standards an implementations, leading to different behaviors and interactions that are very difficult to control. Thus, such systems are so complex and unstable that experiments are not repeatable. Last, it is generally very hard to obtain such platforms at hand to execute experiments. That is why most research in this area resort to simulation-based studies.

Simulation is, in its essence, the act of imitating the be-havior of some process. More specifically, in the computer science research field, simulation amounts to implement a model, that is to say, a hypothetical description of the sys-tem (e.g., an equation syssys-tem, a state-automata, a Petri net, . . . ). In many aspects the simulation approach offers attrac-tive properties. First, simulations are repeatable, which is generally not the case of experiments on real distributed systems because of their unstability and of their complexity. Second, simulations are configurable, meaning that they pro-vide a way of testing hypothetical parameters or platforms hence enabling to try many alternative designs and to ex-trapolate on future scenarios. Last but not least, simulations provide fast results, thus avoiding common misconception alternatives.

Although simulation speed is desired, it is often achieved at the cost of accuracy loss. For instance, analytical models generally provide fast approximations but they rarely have more accurate results than event-driven simulations. Inves-tigating this accuracy/speed tradeoff is frequently neglected, particularly in large-scale distributed platforms simulation. Yet, accuracy is mandatory to avoid severe bias in simula-tion analysis. Generally, models are valid only for a limited range of parameters and surprisingly, despite the importance of this validity range, this information is not easily found for most popular distributed computing simulators.

Focusing in distributed platforms simulation, the network part is indubitably the most critical and controversial part. Every user needs to drive fast simulations involving thou-sands of transfer of arbitrary size and expects accurate re-sults. In the network domain, the most accurate tools to

(3)

study protocols are known as packet-level simulators. Such simulators implement an event driven model passing through all protocol layers and are thus generally recognized as accu-rate. They are however extremely slow, which makes them useless for everyday simulation of large-scale distributed sys-tems. Therefore, higher-level simulations are thus generally used. GridSim [26] uses a variable size packet-level simula-tion (which is quite slow and whose realism remains to be proved) while OptorSim [3] and SimGrid [4] use a flow-level simulation. However OptorSim sharing mechanism is known to be unrealistic in very simple settings. Still, such tools are commonly used and very few users question their relevance, which is why many people criticize simulation as a whole without distinguishing between the different approaches.

Note that in experimental science the act of reproducing past results is mandatory to obtain universal and enduring knowledge. Such a feature is commonly found in all classic sciences such as physics, medicine or chemistry. However, in computer science the fact of reproducing experiments is rarely seen as a fundamental step and most published work focus on novelty and performance. Reproducing the results of others is even sometimes interpreted as waste of time. Still, we claim that such an unattractive work is important and enables either to confirm or to refute previous results.

Therefore, in this article, we focus on the accuracy analy-sis of network simulation within the SimGrid framework by reproducing past experiments. Fujiwaraet al. [11] have pro-posed a preliminary study of the accuracy of the SimGrid model comparing obtained results with packet-level simu-lations and have highlighted non-neglectable flaws. In this article, we come back on their study and improve on their results by making a finer analysis that enables us to propose a more accurate model at very low cost. More precisely, our contributions are the following:

• We reproduce and confirm the results of [11] but using a more precise and well-suited error model. We also use a more unified and justified protocol running more experiments than what was previously done.

• We propose a finer analysis than the one proposed in [11] and we study more precisely the validity range of the SimGrid model.

• This finer analysis reveals that some parameters of the SimGrid model were incorrectly instantiated and that a few simple modifications enable to greatly improve its accuracy, which we evaluate through the same pro-tocol.

This article is organized as follows:

• In Section 2, we briefly present packet-level simulation and flow-based simulation. We also briefly present the main characteristics of the SimGrid model. Then, we present the three case studies performed in [11] and the evaluation methodology they used. Last, we present their conclusion on the validity of the SimGrid model. • In Section 3, we present our analysis of the first case study: predicting the completion time of a single com-munication going through a single link. We propose and justify a new error model and explain how to im-prove this error and thus increase the validity range to smaller messages and more diverse bandwidth and latencies parameters.

• In Section 4, we present our analysis of the second case study: predicting the bandwidth sharing of two com-munications competing on a dumbbell topology. We propose a more precise evaluation protocol and show that the error model seamlessly extends to this new situation. A careful study of the relation between the accuracy and the platform parameters enables to iden-tify a flaw in the model instantiation. We propose a slightly different model and explain how to instanti-ate it correctly. Last, we study its accuracy and its validity range.

• In Section 5, we present our analysis of the third case study: predicting the bandwidth sharing of many flows competing on a random topology. Once again, we re-produce the experiments of [11] but with a more pre-cise evaluation protocol and error model. We show that the new model always improves on the previous model and we present the magnitude of accuracy gain. • Last, in Section 6 we draw some conclusion and present

some leads to further improve the SimGrid model.

2.

RELATED WORK

Section 2.1 and 2.2 present general content on packet-level and flow-packet-level simulation already presented in [11] by Fujiwara et al. but included here for completeness1. The

main difference is that Section 2.2 slightly more details mod-els with mathematical notations to explain more precisely model modifications proposed in Section 3 and 4. Section 2.3 briefly summarize the experiments and the conclusions pre-sented in [11].

2.1

Packet-Level Simulation

Packet-level simulators use discrete-event simulation by which a flow over a network path can be represented as a sequence of events, such as packet arrivals and departures at end-points and routers. End-points and routers both im-plement full-fledge network protocols. Simulation time typ-ically increases in proportion to the number of events [12]. Popular such simulators include ns-2 [28], GTNetS [22], and SSFNet [8]. As mentioned in the introduction, the main problem with these simulators is that simulation time can be orders of magnitude larger than simulated time for simu-lations that involve realistic topologies with many flows. For instance, using GTNetS, which is known for good scalabil-ity, simulating 200 flows each transferring 100MB between two random end-points in a random 200-node topology for 125 sec of simulated time takes approximately 1500 sec on a 3.2GHz Xeon processor [11]. While this is acceptable for researchers studying network protocols, it is prohibitive for many researchers studying distributed systems and algo-rithms on large-scale platforms for application that are long-running and/or that involve large amounts of communica-tion. This problem is often compounded by the need to rely on results from over thousands of simulation experiments to compute valid statistics regarding the relative effectiveness of competing algorithms, which uses over one million sim-ulation experiments, with each experiments requiring over 1,000 sec of simulated time).

1Fujiwara and Casanova kindly allowed us to reproduce their

(4)

Several researchers have attempted to increase the speed of packet-level simulations. For instance, in [13] the au-thors developed the MaSSF framework, which combines the DaSSF packet-level simulator [7] with message passing [24] to accelerate and increase the scalability of network simu-lation by running in parallel on large clusters of worksta-tions. MaSSF is the main component of the MicroGrid [25] tool for simulating Grid platforms and applications. Others have proposed emulation techniques by which traffic flows on physical devices, introducing delay, bandwidth and packet loss characteristics of the network to be simulated. A well-known example of such work is ModelNet [29].

While the last mentioned works do increase the speed and scalability of packet-level simulation without compromising simulation accuracy, many users performing grid simulations need simulations orders of magnitude faster. Facing such re-quirements, simulators that relax the definition of a packet were developed. For instance, the Bricks simulator [27] uses ideal queuing networks to simulate real networks. While the user can specify a packet size in this simulator, Bricks pack-ets do not correspond to real network packpack-ets and Bricks does not implement real network protocols. Large packets lead to fast simulation but obviously low accuracy (in the ex-treme, multi-path network communications use a store-and-forward approach with no pipelining across network links). Although lower packet size leads to behavior presumably qualitatively closer to that of real networks, nothing in this simulator ensure that the behavior is quantitatively close to that of, for instance, TCP. Another simulator, GridSim [26] implements a protocol that includes some elements of UDP and allows for variable packet size. Like Bricks, GridSim re-quires small packet size to hope to gain accuracy close to that of true packet-level simulators on realistic network topolo-gies, but then suffers from high simulation costs. Many other “grid” simulators exist, such as OptorSim [3], GangSim [9], Neko [1], or HyperSim [20] (readers interested in depth de-tails are invited to consult [21]). All implement some net-work model, but to the best of our knowledge (i.e., based on publications and/or on inspection of source codes), these simulators either use packet-level simulation or do not at-tempt to implement a model that realistically tracks the behavior of TCP networks.

2.2

Flow-based Simulation

To increase the speed of network simulation one approach is to use theoretical models to compute the throughput of each flow in a network topology at a given time. Models have been proposed [19, 16, 18] that model the throughput of a TCP flow as a function of packet loss and round trip delay, as well as some parameters of the network and of the TCP protocol. Unfortunately, some of these parameters are difficult to measure and/or instantiate for the purpose of grid simulations. Furthermore, it is not clear how the model can be applied to arbitrary network topologies with many simulated flows competing for network resources. Instead, one desires reasonable models that capture the bandwidth sharing behavior induced by TCP among flows on arbitrary topologies and that are defined by a few simple parame-ters, namely link physical bandwidths and TCP congestion window size. This definition of macroscopic models of band-width sharing is challenging [15]. These models generally fit in the following framework. Every link Lk has a maximum

bandwidth Bk and every flow Fi has a throughput ρi and

we need to ensure that the capacity Bkof each link is never

exceeded. Therefore, the system is generally defined with the following constraints.

∀Lk:

X

i|Fiuses Lk ρi6 Bk

A key question is then: which type of “fairness” does TCP implement when flows share bandwidth on bottleneck links? The most widely known model is the simple Max-Min fair-ness model [2], which computes a bandwidth allocation in which increasing the allocation of a flow would require de-creasing the allocation of another. However, it is well-known that TCP does not implement Max-Min fairness, as shown for instance by Chiu [6].

Indeed, the analytical models for TCP throughput in [10, 19] approximate the throughput, ρ(p), to ρ(p) = c/(RT T.√p) where p is the fraction of packets lost, RT T is the round-trip time, and c is some constant, provided that p is not “too high”. Assuming that all flows experience the same loss rate, p, this formula suggests that bandwidth is in fact shared in inverse proportion to the RTT. This thus sug-gests a Max-Min scheme that is modified to account for low RTTs. Additionaly, the TCP congestion mechanism relies on a window whose size is generally bounded (we denote by W this maximum window size), which impacts greatly the effective bandwidth of the flows (the effective throughput is thus bounded by W/RT T as there are always at most W pending packets).

Last, it has been proved that TCP sharing mechanism at the equilibrium is indeed equivalent to maximizing

X

i

p3/2 Di

tan−1(p3/2Diρi), (1)

where Di is the equilibrium round-trip-time [14]. Such an

equilibrium is generally different from the max-min sharing and should thus be more accurate. Solving such equations is however harder than the max-min sharing algorithm.

Based on the previous considerations, the designer of the SimGrid simulation tool [4, 23], have opted for a RTT-aware Max-Min flow-level model. In this model, the bandwidths allocated to flows competing over a bottleneck link is in-versely proportional to the flows’ RTTs (A link is considered a bottleneck if the sum of the bandwidths allocated to the flows over this link is equal to the total bandwidth of the link.) and the bandwidth of each flow is bounded by a value inversely proportional the inverse of its RTT.

Maximize miniRT Ti.ρi, under constraints 8 > > < > > : (2a) ∀Lk, X i|Fiuses Lk ρi6 Bk (2b) ∀Fi, ρi6 W RT Ti (2)

We refer the reader to [5] for full details on the model and for initial validation results via which this particular model was selected among several alternatives. The model is instantiated solely based on network link physical charac-teristics (latencies and bandwidths) and on the size of the TCP congestion window size. As a result, SimGrid is, to the best of our knowledge, the first simulation framework designed for the study of distributed systems and algorithms

(5)

for large-scale platforms that uses a flow-level network sim-ulation approach that attempts to capture the true behav-ior of TCP networks and that decreases simulation costs by orders of magnitude when compared to packet-level simula-tion.

2.3

Flow-level Simulation Accuracy

Although SimGrid has garnered a sizeable user base, its flow-level network simulation scheme has several limitations. It does not capture the slow-start feature of TCP. Instead, it assumes that flows are backlogged and in steady state. Also, it assumes that the RTT of each flow is constant and is equal to twice the sum of the link latencies on the flow’s network path. And of course, the model cannot account for any detail pertaining to the behavior of individual packets. Therefore, one may wonder how accurate the network sim-ulation in SimGrid is. For instance, the simsim-ulation of short TCP flows should incur large inaccuracies since slow-start is not accounted for.

Fujiwaraet al. [11] had quantified such inaccuracy and identified regimes in which simulation results deviate signi-cantly from those of packet-level simulation performed with GTNets. One of the aim of the present article is to repro-duce and provide a finer analysis of their results. To this end, we briefly recall the experiments that were conducted in [11]:

One Link The first set of experiments is for a single TCP flow going through a single link with physical latency L ∈ {0, 1, 10, 20, 40, 60, 80, 100} (in ms) and physical bandwidth B ∈ {0.1, 0.2, 0.4, 0.6, 0.8, 1, 10, 100, 10 000} (in MB/s). The TCP senders send S ∈ {0.001, 0.01, 0.1, 1, 10, 100, 1000} MB of data to the receivers and the communication time is measured with GTNets and with the SimGrid model.

The conclusions of these experiments are that SimGrid achieves accuracy comparable to the packet-level sim-ulators (i.e., the relative throughput differs at most by 1%) for message size S > 10MB. For smaller data sizes the throughput by the SimGrid simulation is much higher (e.g., a factor 5) than those by the packet-level simulation. Indeed, the network model in SimGrid as-sumes that TCP flows are in steady-state so that the TCP slow-start mechanism is negligible. This assump-tion is realistic for large data sizes, but breaks down for small data sizes.

Dumbbell Topology The second set of experiments is for two TCP flows A and B on a dumbbell topology de-fined by two parameters B ∈ {0.1, 100} (in MB/s) and L ∈ {0, 1, 5, 10, 20, 50, 100} (in ms) as depicted in Fig-ure 1. The experiments were conducted with a mes-sage size S equal to 100MB to avoid the inaccuracy issues raised in the first set of experiments. The effec-tive throughput (i.e., the message size divided by total communication time) for each flow was then measured with both SimGrid and GTNetS.

The conclusions of these experiments are that SimGrid achieves accuracy comparable to the packet-level sim-ulators (i.e., the relative throughput differs at most by 1%) when the capacity of the middle link is large (i.e., for B = 100MB/s). This corresponds to the fact that both flows are bounded by the inverse of their round-trip time (i.e., by constraint (2b)). However when the

A

B

Link L3 B = 100M B/s L = 10ms Link L5 B = 100M B/s L = L Link L3 B = B L = 10ms Link L4 B = 100M B/s L = 10ms Link L1 B = 100M B/s L = 10ms

Figure 1: Dumbbell Topology

throughput get limited by the physical bandwidth (i.e., for B = .1MB/s) there is an important discrepency be-tween SimGrid and GTNetS, even though trends are respected (the flow with the larger RTT achieves a lower throughput than the flow with the lower RTT). Random Topology The third set of experiments is for random flows on random topologies. Four sets of 10 random topologies were generated with the Waxman model [30] and the BRITE generator [17]. The sets comprised either small (50 nodes) or large (200 nodes) and either homogeneous (B ∈ [100, 128] MB/s) or het-erogeneous (B ∈ [10, 128] MB/s) platforms. 200 flows were generated between random pairs of end-points in the topology, which all start simultaneously and communicate 100MB of data. Once again, the effec-tive throughput (i.e., the message size divided by total communication time) for each flow was then measured with both SimGrid and GTNetS.

The conclusion of these experiments is that the accu-racy of SimGrid is correlated to the contention in the network. For experiments with low contention (i.e., generally those involving many nodes and a rather high bandwidth), 80% of flows have a relative error smaller than 1% while the throughput of the other flows are over-estimated or under-estimated. For experiments with high contention (i.e., generally those with only a few nodes and rather low bandwidth) only 20% of flows have a relative error smaller than 1%.

The main conclusions of this study are that the Sim-Grid model is orders of magnitude faster than packet-level and that its accuracy would likely becomes unacceptable for many users when data sizes are “small” (due to the TCP slow-start mechanism) or when networks are “highly con-tended” (i.e., low physical bandwidths and/or many flows). The “small” message issue is important as soon as message size is smaller than 10MB but seemed a necessary evil com-ing from the stationary flow assumption. The contention issue could be explained by the fact that the Max-Min shar-ing mechanism (even if simple to implement) does not real-istically model the complex TCP sharing mechanism, which pointed toward alternative solutions like optimizing (1) with techniques like Lagrangien optimization.

By carefully reproducing these experiments and analyzing more precisely their result, we show that these two issues can be greatly addressed at low cost.

(6)

Table 1: Logarithmic error analysis of linear model with GTNetS.

Size > Logarithmic Error

Max Mean Sd 1 KB 1.8539 0.6235 0.6296 10 KB 1.6771 0.4087 0.5103 100 KB 0.6650 0.1270 0.1450 1 MB 0.1474 0.0464 0.0237 10 MB 0.0662 0.0372 0.0265 100 MB 0.0609 0.0365 0.0270

Table 2: Improved linear model versus GTNetS.

Size > α β Logarithmic Error Max Mean Sd 1 KB 0.6000 6.2400 0.4359 0.1710 0.1373 10 KB 0.7666 8.5008 0.1803 0.0478 0.0559 100 KB 0.9200 10.4000 0.0634 0.0108 0.0149 1 MB 0.9202 14.8193 0.0481 0.0117 0.0105 10 MB 0.9056 22.4166 0.0077 0.0022 0.0027 100 MB 0.8976 22.4166 0.0010 0.0005 0.0004

3.

ONE LINK

Besides the evaluation of SimGrid accuracy, the other ma-jor contribution of Fujiwaraet al. [11] is the integration of GTNetS within SimGrid. The same SimGrid code can use either the standard Max-Min model or run in a packet-level simulation mode that use GTNetS, which greatly eases our study.

We have reproduced the “One Link” experiments with a slightly larger set of parameters. More precisely, we have geometrically sampled the interval [0.001, 600] (in MB) with 165 points for the message size S. We have geometrically sampled the interval [0.01, 500] (in ms) with 16 points for the latency L. Last, we have geometrically sampled the interval [0.01, 500] (in MB/s) with 43 points for the bandwidth B. Exploring the simulation results shows that, unsurprisingly, for any latency and bandwidth the GTNetS communication time TL,B(GT )is well approximated by a linear function of mes-sage size.

In such a simple setting the SimGrid communication time TL,B(SG)simply writes as follows:

TL,B(SG)(S) = L +

S min`B, W

2L

´ , (3)

where W = 20000 is the maximum window size (the same value as the default GTNetS value). A careful study of the results reveals that the previous formula is indeed a good model of TL,B(GT ) (and particularly the term 2LW) but that it could be slightly improved by simply adding two correction factors α and β:

TL,B(new)(S) = α.L + S min`β.B,W

2L

´ , (4)

Before explaining how to compute these values α and β, we need to properly define an error measure. In [11], the error is computed as a relative difference of throughputs, i.e., by: Err =T h (SG)− T h(GT ) T h(GT ) , where T h (GT ) = S T(GT )(S) (5)

The error of a given experiment (i.e., a latency, a bandwidth and a message size) is thus null if and only if both commu-nication times are equal. We think that this error definition has a few biases. First, the relative difference of through-puts is different of the relative difference of communication times and there is a priori no reason to favor throughputs to communication times. Second, this error measure is not symetric: the error lies in the interval (−1, +∞). When

T(SG) = 2T(GT ) we get an error of 1 (i.e., 100%) whereas when T(SG)= T(GT )/2, we get an error of -1/2 (i.e.,-50%).

Therefore, as we are more interested by multiplicative errors instead of additive errors, we propose to compute the error with a logarithmic difference:

LogErr = | log(T h(SG)) − log(T h(GT ))| = | log(T(GT )) − log(T(SG))|

(6) This error measure solves both previous issues: it is invariant when applied to throughputs or to communication times and is completely symmetrical. Additionally, one can then apply additive aggregation operators like the maximum, the mean or the variance. However to interpret them as a percentage, we need to go back from the “log”-space. For small values, this can simply be done by multiplying this value by 100 but for large values, this would greatly underestimate the error. For instance, a logarithmic error of 0.01 corresponds to a exp(0.01) − 1 = 1%, a logarithmic error of 0.1 corresponds to a exp(0.1) − 1 = 10.5% and a logarithmic error of 1.0 corresponds to a exp(1) − 1 = 170% (and not 100%).

By computing statistical information (like the maximum, the average and the standard deviation) on this error for the SimGrid model (see Table 1), we indeed see that the sim-grid model is relevant (with a maximum error in all settings smaller than 6%) only for message sizes larger than 10MB, hence a rather poor validity range.

By computing α and β to minimize the maximum error, we obtain a slightly different model whose performances are much better (see Table 2). By setting α = 0.92 and β = 10.4, we greatly improve the validity range (with even a slightly improved maximum and average error) as the new model becomes accurate for message sizes larger than 100KB (instead of 10MB for the older model). For smaller values we face the slow-start issue: the communication time is not linear for such small values and the assumption of stabilized flows does not hold.

4.

DUMBBELL TOPOLOGY

In this section, we reproduce the “Dumbbell Topology” ex-periments with a slightly larger set of parameters. We have linearly sampled the interval [10, 200] (in ms) with 20 points for the latency L. The motivation of using a linear sampling is that this latency always add with latencies that have an order of magnitude of 30ms (see Figure 1). We have geo-metrically sampled the interval [0.01, 1000] (in MB/s) with 16 points for the bandwidth B. The aim of the dumbbell experiments is to assess the quality of the bandwidth shar-ing mechanism in a basic settshar-ing. Therefore, the message

(7)

0 0.1 0.2 0 20 40 60 80 100 120 140 With Compensation Error Flow ID

(a) Logarithmic error using the average throughput.

0 0.1 0.2 0 20 40 60 80 100 120 140 Without Compensation Error Flow ID

(b) Logarithmic error using the instantaneous throughput. Figure 2: Illustrating the compensation effect: con-sidering the “average” throughput instead of the “in-stantaneous” throughput hides the errors.

size was set to S = 100MB to isolate such sources of dis-crepancy between SimGrid and GTNetS from the previous slow-start issue. We continue to apply the logarithmic dif-ference error measure but now, we obtain instead a vector error (with one value for each flow) for each experiment on which we can compute similar aggregation functions (maxi-mum error, average error, . . . ).

As explained earlier, we aim at evaluating the quality of the bandwidth sharing mechanism. In [11], the relative error was computed on the throughput of each flow, i.e., the ratio between the message size and the total communication time of each flow. Both flows start at the same time but they generally do not end et the same time. Therefore, once the first flow has finished, the second flow is alone and there is no more bandwidth sharing. Thus, such an evaluation somehow underestimates the error we want to observe (compensation may happen). To avoid such error underestimations, we compute the instantaneous throughput of each flow instead of their average throughput by stopping the simulation as soon as the first flow ends. The instantaneous throughput is then the amount of data that have been transferred so far divided by the communication time (which is thus equal for all flows). As highlighted on Figure 2, such a protocol generally produces higher errors as it avoids compensation effects.

As noted in [11], when the bandwidth B of the middle link is large (i.e., larger than 1MB/s), SimGrid is accurate (less than 1% of error for both flows) because both flows are limited by the round-trip time bound of Equation (2b). Thus, we have additionally linearly sampled the intervals [0.01, 0.1] and [0.1, 1] with 10 points each for the bandwidth B. These additional points enable to have a finer sampling around values that cause a large error (i.e., when there is contention on the middle link).

On such experiments (see Figure 3), we can first remark that the sum of the throughput of both flows is constant and roughly equal to the bandwidth B of the middle link. We

Flow B Flow A 0 10 20 30 40 50 60 70 80 90 100 10 50 100 150 200 10 50 100 150 200

Instantenous Bandwidth Share

Latency (ms) Max−Min GTNets

Figure 3: Instantaneous throughput for both flows when the middle link is the bottleneck (B =100KB).

can also observe that the choice of α = .92 in the previous section is also justified by this experiment: the TCP flows only achieve 92% of the physical bandwidth B.

In such a simple context, the SimGrid model is equivalent to fairly share the bandwidth B between flow A and B with priorities wA = RT TA and wB = RT TB. Therefore the

SimGrid model solves the following system: (

wA.ρA= wB.ρB

ρA+ ρB= B

Flow A should thus receive ρA = wwB

A+wBB and flow A should receive ρB= wwA

A+wBB. Note that when maximizing √ 3/2 wA tan −1(p3/2w AρA) + √ 3/2 wB tan −1(p3/2w BρB) under

the same constraint, we end up with the exact same shar-ing. Therefore the Max-Min sharing algorithm should not be incriminated for computing inaccurate results. It is the approximation of the weights w by the round-trip time that results in a bad sharing. Somehow, the simulation results suggest that this weight should not only account for the physical latency of the used links but also for their physical bandwidth. By dividing ρA by ρB we get the ratio of

prior-ities wA and wB, which we can try to model as a function

of L and B. Figure 4 depict this ratio for GTNetS measure-ments. This function is linear in L and is increasing with an asymptotic value in B.

In the original SimGrid model, the weight of a flow is computed as the sum of the physical latencies of the link used by this flow. In the present example (see Figure 1), the SimGrid model predict the ratio ρA/ρB with the following

formula:

ρA/ρB=

30 + L 40

This formula is indeed linear in L but does not account at all for the dependency on B. The measurements in Figure 4 suggest to incorporate the bandwidth as follows:

wi= X k|Fiuses Lk „ Latk+ σ Bk « , (7)

(8)

Table 3: Error analysis for dumbbell topology

Bw Range SimGrid Model Logarithmic Error Improved Model Logarithmic Error

MAX MEAN SD MAX MEAN SD

10KB/s6 B <100KB/s 1.1072 0.4522 0.2420 0.1513 0.0565 0.0405 100KB/s6 B <1MB/s 0.6779 0.0806 0.1160 0.3668 0.0781 0.0860 1MB/s6 B <10MB/s 0.0176 0.0052 0.0030 0.1484 0.0200 0.0287 10MB/s6 B <100MB/s 0.0049 0.0025 0.0010 0.0196 0.0048 0.0058 100MB/s6 B 0.0048 0.0020 0.0011 0.0050 0.0006 0.0010 10KB/s6 B 1.1072 0.1414 0.2327 0.3668 0.0409 0.0587 0.02 0.04 0.06 0.08 0.1 0.12 0.14 0.16 0.18 0.2 0 1e+07 2e+07 3e+07 4e+07 5e+07 1 2 3 4 5 6 Ratio Ratio = f(B,L) Latency Bandwidth Approximation

Figure 4: Ratio of the throughput for GTNetS as a function of L and B and its approximation by equa-tion (8). example: ρA/ρB = 30 + L + σ` 2 108 + 1 B ´ 40 + σ`1028+ 1 B ´ (8)

By computing σ that minimizes the maximum error on all flows, we get σ = 8775, the approximation mesh in Figure 4. This new model improves on the previous model (see Ta-ble 3) since it has a maximum error of 43% (instead of 200% for the original model) and an average error of 4% (instead of 15% for the original model). Remember that these values emphasize the model flaws since they have been computed by sampling more precisely bandwidth parameters that lead to large errors (i.e., the interval [0.1, 1]MB/s). The approx-imation of w by the sum of physical latencies had been in-deed discussed in the earliest stages of the development of the SimGrid model [5] and, as illustrated by Table 3, this approximation holds indeed only when there is little con-tention.

Therefore we propose the new following model for Sim-Grid. Each flow Fi really starts after 10.4Pk|F

iuses LkLk and the bandwidth sharing of active flow is computed by solving the following program:

Maximize miniwi.ρi, under constraints 8 > > < > > : (9a) ∀Lk, X i|Fiuses Lk ρi6 0.92Bk (9b) ∀Fi, ρi6 W RT Ti (9) where wi= X k|Fiuses Lk „ Lk+ 8775 Bk « .

The error obtained with this new model is summarized on Table 3.

5.

RANDOM GRAPHS

In this section, we reproduce the “Random Topology” ex-periments to check whether the new model improves on the original SimGrid model in more general settings than the previous two simple experiments. To this end, we have gen-erated four sets of 10 random topologies with the Waxman model [30] and the BRITE generator [17] (Figure 5 illus-trates a typical 50-node random topology). The sets com-prised either small (50 nodes) or large (200 nodes) and either homogeneous (B follows a uniform distribution in [100, 128] MB/s) or heterogeneous (B follows a uniform distribution in [10, 128] MB/s) platforms. The latency is computed by BRITE based on the Euclidean distance and lies in the in-terval (0, 5]ms in those experiments. The message size was fixed to S = 10MB. Last, 150 flows were generated between random pairs of end-points in the topology and 10 different deployments were tried for each platform. We use the same error model and the same protocol as in the previous sec-tion (i.e., all flows are stopped as soon as the first flow ends and their instantaneous throughput is computed using the amount of data transfered so far).

The lower part of Figure 6 depicts the error distribution obtained for a typical experiment (we have sorted the flows according to the error of the old SimGrid model). Note that we haven’t applied the absolute value of the logarith-mic difference here to represent underestimation and over-estimation. The upper part depicts the bandwidth of the corresponding flow for each model. The lower part depicts the corresponding error when compared to GTNetS for each flow in both models. This graph confirms the conclusion from [11]: in the old SimGrid model high contention (i.e., low bandwidth values) and the error are correlated. It is interesting to see that this seems to have disappear with the new model: this problem was certainly due much more to a bad estimation of weights (that we solved in Section 4) rather than to the Max-Min sharing algorithm.

Figure 7(a) illustrates the improvement of the new model versus the previous SimGrid model considering the mean logarithmic error as metric on the whole set of experiments. The experiments are sorted according to the error of the new model. The upper graph depicts the mean error for both models. On the lower graph, we plot for each experiment the logarithmic ratio between the mean logarithmic error of

(9)

Gregory Tremblay Vincent Hayward Boston Jupiter Jean_Paul Alain Ronald Thibault Croteau Pointe_Claire Romano Emacs Linda UniPress Horne Jean_Maurice Maltais Mont_Tremblant Frank Wilfrid Toulouse Interleaf Poussart Gagnon Wright Ottawa Florient AutoCAD Fourier Toronto Europe Boily Charron George Saint_Amand Jean_Yves Foisy Bentz Julian Turcotte Ltd Browne SPARCs Victoriaville Mahoney Mike King Ginette

Figure 5: Typical 50-node random topology

−1 −0.5 0 0.5 1 0 20 40 60 80 100 120 140 Error Flow ID 0 1 2 3 4 5 6 7 8 9 10 11 12 13 14 15 Improved Max−Min GTNets Bandwidth (MBps)

Figure 6: Logarithmic errors of both models for a typical heterogeneous 50 node random topology.

the old SimGrid model and the mean logarithmic error of the new model. As this logarithmic ratio is always positive, our new model always improves on the mean logarithmic error of the previous model (by 234% on the average). In the end, the average mean logarithmic error is equal to 0.042, that is to say 4%.

Figure 7(b) is organized in the same way and illustrates the improvement with respect to the maximum logarithmic error. This error measure is much harder to improve as it requires to be accurate on the 150 flows at the same time. Therefore, we do not succeed to improve on the older model in all situation but still, on the average, we improve the maximum logarithmic error by 78%. In the end, the average max logarithmic error is equal to 0.32, that is to say 38%. The largest error with the new model is a situation where the throughput of one flow is off by 461%, which is clearly still not acceptable. The largest error with the old model is a situation where the throughput of one flow is off by more than 534%.

The new model is thus much better than the former Sim-Grid model and performs well on the average (only 5% of error on the average). However, there remains situations where it does not accurate estimates communication time, particularly for the maximum logarithmic error metric (see Table 4). Thus, there is still room for improvement and we believe the Max-Min sharing mechanism can now be incrim-inated.

6.

CONCLUSION

In [11] the SimGrid network engine was compared to the GTNetS packet level simulator considering the accuracy/speed tradeoff. In response time, the SimGrid framework cannot rely on packet level simulation since hundreds of flows lead to an unacceptable simulation time. Regarding accuracy, con-clusions pointed that the SimGrid network model was good only for messages over 10MB, due to the TCP slow start non-linear behavior. Another accuracy flaw was detected when the network is highly contended. This last issue seemed to blame the sharing model in SimGrid, pointing that future work should experiment different models as those presented in [14].

In the present work, we have shown that the SimGrid model could be improved to guarantee an excellent accu-racy for messages greater than 100KB (instead of 10MB). Further investigations pointed that the issue for highly con-tended networks was due to a bad instantiation of the model instead of previous suspicions indicating the sharing model as the cause. By correctly instantiating the SimGrid Max-Min sharing algorithm, we have been able to significantly reduce the error even on complex platforms and complex communication patterns.

In spite of the successful results presented here, the Max-Min sharing approach still should be compared to the models proposed in [14] to ensure that its accuracy cannot be fur-ther improved. Anofur-ther open research point is the precise determination of the validity range of this model. Having a more precise knowledge of the acceptable range of platform parameters provided by SimGrid end-users would enable to have a much more reliable simulation framework. The sim-ulator could then warn users when their parameters are out of range and might even provide interval confidence on the simulation results. We look forward to present such results in future work.

(10)

−3 −2 −1 0 1 2 3 10 20 30 40 50 60 70 80 90 100 110 120 130 140 150 160 Ratio Experiment 0 0.5 1 Mean Error Maxmin Improved

(a) Improvement of the mean logarithmic error.

−3 −2 −1 0 1 2 3 10 20 30 40 50 60 70 80 90 100 110 120 130 140 150 160 Ratio Experiment 0 0.5 1 1.5 2 Max Error Maxmin Improved

(b) Improvement of the maximum logarithmic error. Figure 7: Improvement of the logarithmic error for the new model.

Table 4: Largest errors in random topology

Platform Exp SimGrid Model Logarithmic Error Improved Model Logarithmic Error

MAX MEAN SD MAX MEAN SD

waxman 200 4.xml 10 0.4921 0.1817 0.0818 0.1689 0.0496 0.0261 waxman 200 2.xml 8 1.8481 0.5215 0.3070 0.2642 0.0501 0.0499 waxman 50 3.xml 7 0.3075 0.1406 0.0631 0.2701 0.0224 0.0312 waxman 200 3.xml 2 0.4589 0.1763 0.0849 0.3226 0.0352 0.0357 waxman 200 1.xml 9 1.3248 0.4263 0.2430 0.3321 0.0497 0.0576 waxman 200 2H.xml 8 1.0135 0.3206 0.1824 0.4118 0.0845 0.0617 waxman 50 1.xml 5 1.3280 0.3052 0.1981 0.4244 0.0501 0.0553 waxman 200 3H.xml 7 0.2238 0.1129 0.0443 0.4840 0.0700 0.1124 waxman 200 4H.xml 8 0.3086 0.0761 0.0423 0.5062 0.0315 0.0618 waxman 50 4.xml 8 1.3322 0.4177 0.2844 0.5406 0.0988 0.1073 waxman 50 2.xml 3 0.9592 0.3274 0.1935 0.5662 0.1280 0.1040 waxman 50 3H.xml 8 1.1057 0.2244 0.1351 0.7531 0.0842 0.1198 waxman 50 2H.xml 3 1.0930 0.1625 0.1992 0.8618 0.0791 0.1430 waxman 50 4H.xml 3 1.4286 0.1325 0.1687 1.2793 0.0710 0.1833 waxman 50 1H.xml 6 1.7615 0.1226 0.1733 1.6041 0.0906 0.1897 waxman 200 1H.xml 5 1.8034 0.0969 0.2279 1.7246 0.0573 0.2152

Acknowledgement

We would like to thank Henri Casanova and Kayo Fujiwara for their trailing work in integrating GTNetS in the Sim-Grid kernel and for their preliminary study on the validity of SimGrid’s models [11]. We also thank them for letting us access their experimental data and letting us reproduce the related work section.

Experiments presented in this paper were carried out us-ing the Grid’5000 experimental testbed, an initiative from the French Ministry of Research through the ACI GRID incentive action, INRIA, CNRS and RENATER and other contributing partners (see https://www.grid5000.fr).

This work is partially supported by ANR (Agence Na-tional de Recherche), project reference ANR 08 SEGI 022. Special thanks to CAPES/Brazil which supports Pedro Velho’s PhD thesis during the presented work.

7.

REFERENCES

[1] U. P. X. D. Al’fag and A. Schiper. Neko: A Single Environment to Simulate and Prototype Distributed Algorithms. Journal of Information Science and

Engeneering, 18(6):981–997, 2002.

[2] D. Bertsekas and R. Gallager. Data Networks. Prentice-Hall, 1992.

[3] D. G. Cameron, A. P. Millar, C. Nicholson, F. Z. R. Carvajal-Schiaffino, and K. Stockinger. Optorsim: a Simulation Tool for Scheduling and Replica Optimization in Data Grids. In Computing in High Energy and Nuclear Physics (CHEP) conference, September 2004.

[4] H. Casanova, A. Legrand, and M. Quinson. SimGrid: a Generic Framework for Large-Scale Distributed Experiments. In 10th IEEE International Conference on Computer Modeling and Simulation, Mar. 2008. [5] H. Casanova and L. Marchal. A network model for

simulation of grid application. Technical Report 2002-40, LIP, 2002.

[6] D. M. Chiu. Some Observations on Fairness of Bandwidth Sharing. In 10th IEEE Symposium on Computers and Communications (ISCC), July 2000. [7] J. H. Cowie, H. liu, J. Liu, D. Nicol, and A. Ogielski.

(11)

In International Conference on Parallel and Distributed Processing Techniques and Applications (PDPTA), June 1999.

[8] J. H. Cowie, D. M. Nicol, and A. Ogielski. Modeling the Global Internet. Computing in Science and Engineering, 1(1):42–50, 1999.

[9] C. Dumistrescu and I. Foster. GangSim: A Simulator for Grid Scheduling Studies. In Fifth IEEE

International Symposium on Cluster Computing and the Grid (CCGrid’05), May 2005.

[10] S. Floyd and K. Fall. Promoting the Use of End-to-end Congestion Control in the Internet. IEEE/ACM Transactions on Networking, 7(4):458–472, 1999. [11] K. Fujiwara and H. Casanova. Speed and accuracy of

network simulation in the simgrid framework. In Proceedings of the First International Workshop on Network Simulation Tools (NSTools), 2007.

[12] B. Liu, D. R. Figueiredo, Y. Guo, J. F. Kurose, and D. F. Towsley. A Study of Networks Simulation Efficiency: Fluid Simulation vs. Packet-level Simulation. In IEEE INFOCOM, April 2001.

[13] X. Liu and A. Chien. A Traffic-based Load Balance for Scalable Network Emulation. In ACM Conference on High Performance Computing and Networking (SC003), November 2003.

[14] S. H. Low. A duality model of TCP and queue management algorithms. IEEE/ACM Transactions on Networking, 11(4):525–536, 2003.

[15] L. Massouli´e and J. Roberts. Bandwidth Sharing: Objectives and Algorithms. IEEE/ACM Transactions on Networking, 10(3):320–328, 2002.

[16] M. Mathis, J. Semke, and J. Mahdavi. The Macroscopic Behavior of the TCP Congestion Avoidance Algorithm. Computer Comunications, 27(3):??, 1997.

[17] A. Medina, A. Lakhina, I. Matta, and J. Byers. BRITE: Universal topology generation from a user’s perspective. Electronic manual, Apr. 2001. Available at http://www.nrg.cs.uoregon.edu/topology_ generation/brite-manual/.

[18] T. Ott, J. Kemperman, and M. Mathis. Window Size Behavior in TCP/IP with Constant Loss Probabillity. In 4th IEEE Workshop on High-Performance

Communication Systems, June 1997.

[19] J. Padhye, V. Firoiu, D. Towsley, and J. Krusoe. Modeling TCP Throughput: A Simple Model and its Empirical Validation. In ACM SIGCOMM, September 1998.

[20] S. Phatanapherom, V. Kachitvichyanukul, and P. Uthayopas. Fast Simulation Model for Grid Scheduling Using Hypersim. In 2003 Winter Simulation Conference, December 2003. [21] B. Quetier and F. Cappello. A Survey of Grid

Research Tools: Simulators, Emulators and Real Life Platforms. In 17th IMACS World Congress, July 2005. [22] G. F. Riley. The Georgia Tech Network Simulator. In

ACM SIGCOMM Workshop on Models, Methods and Tools for Reproducible Network Research, August 2003.

[23] The SimGrid project.

http://simgrid.gforge.inria.fr.

[24] M. Snir and W. Gropp. MPI: The Complete Reference. MIT Press, second edition, 1998. [25] H. J. Song, X. Liu, D. Jackobsen, R. Bhagwan,

X. Zhang, K. Taura, and A. Chien. The MicroGrid: a Scientific Tool for Modelling Computational Grids. Scientific Programming, 8(3):127–141, 2000.

[26] A. Sulistio, G. Poduvaly, R. Buyya, and C.-K. Tham. On Incorporating Differentiated Level of Network Service into GridSim. Future Generation Computer Systems, 23(4):606–615, 2007.

[27] A. Takefusa, S. Matsuoka, H. Nakada, K. Aida, and U. Nagashima. Overview of a Performance Evaluation System for Global computing Scheduling Algorithms. In 8th IEEE International Symposium on High Performance Distributed Computing (HPDC-8), August 1999.

[28] N.-. Team. The Network Simulator - NS-2. http:// nsnam.isi.edu/nsnam/index.php/User_Information. [29] A. Vahdat, K. Yocum, K. Walsh, P. Mahadevan,

J. Kostic, D. Chase, and D. Becker. Scalability and Accuracy in a Large-Scale Network Emulator. In 5th ACM/USENIX Symposium on Operating System Design and Implementation (OSDI), December 2002. [30] B. M. Waxman. Routing of Multipoint Connections.

IEEE Journal on Selected Areas in Communications, 6(9):1617–1622, December 1988.

Figure

Figure 1: Dumbbell Topology
Table 1: Logarithmic error analysis of linear model with GTNetS.
Figure 3: Instantaneous throughput for both flows when the middle link is the bottleneck (B =100KB).
Table 3: Error analysis for dumbbell topology
+3

Références

Documents relatifs

Unit´e de recherche INRIA Rennes, Irisa, Campus universitaire de Beaulieu, 35042 RENNES Cedex Unit´e de recherche INRIA Rhˆone-Alpes, 655, avenue de l’Europe, 38330 MONTBONNOT ST

Theorem 1 allows the robust stability of the global remote system to be guaranteed with respect to the packet dropout and for observer and controller gains given in Seuret et al..

Key-words: distributed systems, performance evaluation, download time, response service time, data distribution, simulation model, max-min fairness.. ∗ INRIA, 2004 Route des

• There are still several cases where a flow with a very small trans- mission time has the same transmission time in both cases (DropTail and FavourTail): (1) it might have only

the magnetic anisotropy problem which has received considerable attention both theoretically [8] and experimentally [9] : let us consider a 3D Ising magnet with an

In this paper, we analyzed the overheads of lay- ered network protocol in a ULOS and proposed five optimization techniques: user-level signal masking, aggregated system calls,

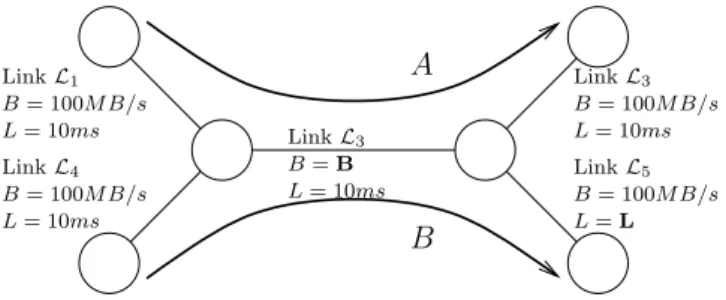
We will conduct a series of experiments with specified parameters and varying the redundancy ratio: L = 10 Mbit/s - bandwidth of the communication channels connecting clients and

For a specified sample size K, the estimation of the flow network reliability parameter by the standard estimator is the frequency of operating capacity vectors in the set of