HAL Id: hal-02024264
https://hal-amu.archives-ouvertes.fr/hal-02024264
Submitted on 9 Oct 2020
HAL is a multi-disciplinary open access
archive for the deposit and dissemination of
sci-entific research documents, whether they are
pub-lished or not. The documents may come from
teaching and research institutions in France or
abroad, or from public or private research centers.
L’archive ouverte pluridisciplinaire HAL, est
destinée au dépôt et à la diffusion de documents
scientifiques de niveau recherche, publiés ou non,
émanant des établissements d’enseignement et de
recherche français ou étrangers, des laboratoires
publics ou privés.
diazotrophic cyanobacteria in the western tropical South
Pacific
Marcus Stenegren, Andrea Caputo, Carlo Berg, Sophie Bonnet, Rachel Foster
To cite this version:
Marcus Stenegren, Andrea Caputo, Carlo Berg, Sophie Bonnet, Rachel Foster. Distribution and
drivers of symbiotic and free-living diazotrophic cyanobacteria in the western tropical South Pacific.
Biogeosciences, European Geosciences Union, 2018, 15 (5), pp.1559-1578. �10.5194/bg-15-1559-2018�.
�hal-02024264�
https://doi.org/10.5194/bg-15-1559-2018 © Author(s) 2018. This work is distributed under the Creative Commons Attribution 3.0 License.
Distribution and drivers of symbiotic and free-living diazotrophic
cyanobacteria in the western tropical South Pacific
Marcus Stenegren1, Andrea Caputo1, Carlo Berg2, Sophie Bonnet3,4, and Rachel A. Foster1
1Stockholm University, Department of Ecology, Environment and Plant Sciences, Stockholm, Sweden
2Science for Life Laboratory/Department of Biology and Environmental Science, Linnaeus University, Kalmar, Sweden 3Aix Marseille Université, Centre National de la Recherche Scientifique. Marseille/Noumea, New Caledonia, France 4Mediterranean Institute of Oceanography, Institut de Recherche pour le Dévelopement, Marseille, France
Correspondence: Marcus Stenegren (marcus.stenegren@su.se) Received: 23 February 2017 – Discussion started: 10 March 2017
Revised: 14 December 2017 – Accepted: 9 February 2018 – Published: 15 March 2018
Abstract. The abundance and distribution of cyanobacte-rial diazotrophs were quantified in two regions (Melanesian archipelago, MA; and subtropical gyre, SG) of the west-ern tropical South Pacific using nifH quantitative polymerase chain reaction (qPCR) assays. UCYN-A1 and A2 host pop-ulations were quantified using 18S rRNA qPCR assays in-cluding one newly developed assay. All phylotypes were detected in the upper photic zone (0–50 m), with higher abundances in the MA region. Trichodesmium and UCYN-B dominated and ranged from 2.18 × 10²to 9.41 × 10⁶and 1.10 × 10²to 2.78 × 10⁶nifHcopies L−1, respectively. Het-1 (symbiont of Rhizosolenia diatoms) was the next most abundant (1.40 × 101–1.74 × 10⁵ nifHcopies L−1) and co-occurred with het-2 and het-3. UCYN-A1 and A2 were the least abundant diazotrophs and were below detection (bd) in 63 and 79, respectively, of 120 samples. In addition, in up to 39 % of samples in which UCYN-A1 and A2 were detected, their respective hosts were bd. Pairwise comparisons of the nifHabundances and various environmental parameters sup-ported two groups: a deep-dwelling group (45 m) comprised of UCYN-A1 and A2 and a surface group (0–15 m) com-prised of Trichodesmium, het-1 and het-2. Temperature and photosynthetically active radiation were positively correlated with the surface group, while UCYN-A1 and A2 were posi-tively correlated with depth, salinity, and oxygen. Similarly, in a meta-analysis of 11 external datasets, all diazotrophs, ex-cept UCYN-A were correlated with temperature. Combined, our results indicate that conditions favoring the UCYN-A symbiosis differ from those of diatom diazotroph associa-tions and free-living cyanobacterial diazotrophs.
1 Introduction
Biological di-nitrogen (N2) fixation is considered a major
source of new nitrogen (N) to oceanic ecosystems (Karl et al., 1997). N2 fixation is an energetically expensive
pro-cess, in which N2 gas is reduced to bioavailable ammonia
(Howard and Rees, 1996), and is performed by a small but diverse group of bacteria and archaea. The nitrogenase en-zyme, which is encoded by a suite of nif genes, mediates N2
fixation (Jacobson et al., 1989; Young, 2005). Nitrogenase has a high iron (Fe) requirement (Howard and Rees, 1996), and often N2 fixers, or diazotrophs, are Fe limited (Kustka
et al., 2003; Raven, 1988). Nitrogenase is also sensitive to oxygen (O2), which has been shown to negatively influence
N2 fixation efficiency (Meyerhof and Burk, 1928; Stewart,
1969). Thus, autotrophic diazotrophs (e.g., cyanobacteria) have evolved strategies, such as temporal and spatial sep-aration of the fixation process, to protect their nitrogenase from O2evolution during photosynthesis (Berman-Frank et
al., 2001; Haselkorn, 1978; Mitsui et al., 1986). N2fixation
is widespread and occurs in marine, limnic, and terrestrial habitats. In marine ecosystems it mainly occurs in the photic zone, closest to the surface; however, more recently, evidence has shown activity in deeper depths below the photic zone, including oxygen minimum zones (Benavides et al., 2016; Bonnet et al., 2013; Fernandez et al., 2011; Halm et al., 2009; Löscher et al., 2015).
N2 fixation in the photic zone is often attributed to a
di-verse group of cyanobacteria. Traditionally, marine, photic-zone-dwelling diazotrophs are divided into two groups based on cell diameter, e.g., > 10 and < 10 µm size fractions.
Di-atom diazotroph associations (DDAs), symbioses between heterocystous cyanobacteria and a variety of diatom genera, and large filamentous non-heterocystous Trichodesmium spp. compose the larger size fraction (> 10 µm). Trichodesmium spp. occur as free filaments or often in two morphologies of colonies: tufts/rafts and puffs. There are three defined lin-eages of symbionts of DDAs based on their nifH phylogeny: het-1 and het-2 refer to the two Richelia intracellularis lin-eages that associate with diatom genera Rhizosolenia and Hemiaulus, respectively, while the third lineage, het-3, as-sociates with the heterocystous Calothrix rhizosoleniae and Chaetoceros compressus diatoms (Foster et al., 2010; Foster and Zehr, 2006).
The unicellular diazotrophic cyanobacterial groups are di-vided into UCYN-A, UCYN-B, and UCYN-C groups and are representatives of the < 10 µm size fraction. The UCYN-A (Candidatus UCYN-Atelocyanobacterium thalassa) group can be further delineated into six sublineages (Thompson et al., 2014; Turk-Kubo et al., 2017); two (UCYN-A1, UCYN-A2) are identified as symbiotic with small prymnesiophyte mi-croalgae (reviewed by Farnelid et al., 2016; see references within). The UCYN-B group has its closest cultured rela-tive as Crocosphaera watsonii and lives freely, colonially, and also in symbiosis with the diatom Climacodium frauen-feldianum(Bench et al., 2013; Carpenter and Janson, 2000; Webb et al., 2009; Zehr et al., 2001). Often overlooked is the observation that UCYN-B, when colonial or symbiotic, could also be associated with the > 10 µm size fraction. Less is known about the UCYN-C group, and given that its nifH nucleotide sequence is 90 % similar (Foster et al., 2007) to Cyanothecespp. ATCC51142, it is assumed to be analogous and thus co-occurring with the other < 10 µm size fraction. A diverse group of free-living heterotrophic bacteria (e.g., gamma proteobacteria) (Berthelot et al., 2015; Bombar et al., 2016; Halm et al., 2012; Langlois et al., 2005) and archaea (Zehr et al., 2005) are also within the < 10 µm size fraction.
The distribution and activity of diazotrophs in open-ocean ecosystems are governed by different ambient environmen-tal factors, including macronutrient availability (Moutin et al., 2008; Sañudo-Wilhelmy et al., 2001) and temperature (Messer et al., 2016; Moisander et al., 2010). There are also simultaneous influences by several factors (i.e., co-limitation of nutrients; Mills et al., 2004). Moreover, most oceanic models of N2fixation assume that all diazotrophs are equally
controlled by the same environmental parameters (Deutsch et al., 2007; Hood et al., 2004; Landolfi et al., 2015), de-spite well-recognized differences in genetic repertoires for assimilating dissolved nutrient pools (e.g., dissolved organic phosphate; Dyhrman et al., 2006; Dyhrman and Ruttenberg, 2006), life histories (free, symbiotic, colonial), and cell sizes (micrometers to millimeters). A better understanding of these differences would benefit oceanic models of N2fixation, our
understanding of marine N2 budgets, and the impact of N2
fixation in oceanic surface waters and their communities.
The tropical South Pacific Ocean is considered one of the most oligotrophic regions in the world’s oceans (Claustre and Maritorena, 2003), with a widespread N deficiency (Deutsch et al., 2007; Raimbault et al., 2008), and the central SP gyre has some of the lowest reported concentrations of dissolved Fe (Blain et al., 2008). One exception is the western tropi-cal South Pacific (WTSP), which harbors many islands with Fe-rich sediments adding to an island mass effect (Shiozaki et al., 2014) and is influenced by multiple ocean currents, both surface and subsurface, that drive the distribution of dissolved nutrients, micronutrients, and the biota (Fitzsim-mons et al., 2014; Gourdeau et al., 2008; Marchesiello and Estrade, 2010; Wells et al., 1999). The structure of these cur-rents also promotes shearing instabilities and strong eddies (Qiu et al., 2009). Moreover, Van Den Broeck et al. (2004) suggested that the WTSP is phosphate limited, while Law et al. (2011) hypothesized that primary production and N2
fixation in the WTSP follow the seasonality of cyclones, which in their wake, enrich surface waters with phosphate and fuel primary and new production. An earlier investiga-tion along a transect in the western equatorial Pacific esti-mated that 74 % of the total N2 fixation could be attributed
to the < 10 µm size fraction, although abundances of unicel-lular cyanobacteria were moderate (17 cells mL−1)(Bonnet et al., 2009). However, diazotroph quantification is lacking further south in tropical waters, despite being recently rec-ognized as a hot spot of N2 fixation, with average rates of
∼570 µmol N m−2d−1(Bonnet et al., this issue), i.e., in the upper range (100–1000 µmol N m−2d−1) of rates gathered in the global N2 fixation MAREDAT database (Luo et al.,
2012).
The primary aim of this study was to quantify diazotroph abundance and distribution in the WTSP, with an emphasis on symbiotic N2-fixing populations, both by at-sea and
lab-based quantitative approaches. Since earlier expeditions to the SW Pacific identified it as a potential hotspot for diazotro-phy (Bonnet et al., 2015, 2016, 2017; Moisander et al., 2010), the at-sea quantitative polymerase chain reaction (qPCR) was performed in order to make informed decisions about the presence, absence, and relative abundance of diazotrophs so that stations could be selected for other assays and characteri-zation of the hydrographic conditions (e.g., incubation exper-iments, sediment and drifter deployments; see Bonnet et al., 2018). For a more comprehensive investigation of the sym-biotic diazotrophs, we developed a new primer and probe set for quantification of the UCYN-A1 host. We also identified key environmental parameters, both biotic and abiotic, which influenced the distribution of diazotrophs in the WTSP and tested the congruency of these parameters in an additional 11 publicly available datasets. We hypothesized that the dis-tribution and the environmental drivers of the diazotrophic symbioses should differ due to the major differences in host taxonomy (e.g., diatom vs. prymnesiophyte), size (1–2 to hundreds of micrometers), and life history (free vs. symbi-otic, chain forming). For comparison and for similarly
di-Figure 1. Sampling locations and the horizontal and vertical distributions of diazotrophs and the UCYN-A1 and UCYN-A2 hosts in the study area. Sampling depths are indicated as black dots (white for LD stations) and the abundances are the log nifH gene copies L−1for the diazotrophs and 18S rRNA gene copies L−1for the UCYN-A host lineages. The boundary between the Melanesian archipelago and subtropical gyre in the transect map is marked with a dotted line.
vergent characteristics (symbiotic vs. free; colonial vs. sin-gle), several free-living (UCYN-B, Trichodesmium spp., and UCYN-C) cyanobacterial diazotrophs were also included.
2 Materials and methods 2.1 Sampling
Sampling was conducted on a transect in the WTSP dur-ing austral summer (19 February–5 April 2015), onboard the R/V L’Atalante (Fig. 1a). The cruise transect and sta-tions were selected according to the following: regions with low advection to better estimate biogeochemical budgets, contrasting diazotrophic community (e.g., Trichodesmium spp. dominated vs. UCYN dominated), and along a trophic and N2 fixation gradient from west to east (Moutin et al.,
2017). The cruise is divided into two geographic regions: Melanesian archipelago (MA: SD 1–12, LD A and LD B stations, 160–178◦E and 170–175◦W) and the subtropical gyre (SG: SD 13–15 and LD C stations, 160–169◦W).
Long-duration (LD) stations of 8 days were chosen based on hy-drographic conditions, satellite imagery, microscopic analy-ses of > 10 µm cyanobacterial diazotrophs, and the results of our at-sea qPCR analyses of four unicellular diazotrophic tar-gets (UCYN-A1, UCYN-A2, UCYN-B, and UCYN-C) (see below).
2.1.1 Nucleic acids
Seawater (2.5 L) was collected from 18 stations (LD A–C; SD 1–15) into clean (10 % bleach rinsed) 2.75 L polycarbon-ate bottles from six to seven discrete depths based on surface incident light intensity (100, 75, 54, 36, 10, 1, and 0.1 %) once per station at both short-duration (SD) and LD stations using Niskin bottles (12 L) arranged on a conductivity tem-perature depth (CTD; Seabird 911) rosette.
After collection from the CTD rosette, 2.5 L seawater was immediately filtered onto a 0.2 µm pore size Supor filter (Pall Corporation, Pall Norden AB; Lund, Sweden) held within a 25 mm diameter Swinnex filter holder (Merck Millipore;
Solna, Sweden) using a peristaltic pump (Cole-Parmer, Mas-terflex, Easy-load II; USA). In case the filters clogged with too much material, the remaining volume was measured and noted for later calculations. The filters were placed in pre-sterilized bead beater tubes (Biospec; Bartlesville, OK, USA) containing 30 µL of a 0.1 and 0.5 mm glass bead mixture, flash frozen in liquid nitrogen, and archived at −80◦C. Four additional DNA samples were collected from four discrete depths, (75, 50, 36, 10 % light), at 11 of the 18 stations, for the at-sea qPCR (see below) and filtered as described above. The at-sea samples were extracted and processed for qPCR immediately after collection (see below).
2.1.2 Cell abundances and microscopy observations At the LD stations, 5 L of seawater was collected at the same depths in parallel with the nucleic acid samples from the CTD rosette. Two sets of samples, one set each day, were taken on days 1 and 3 at each LD station and immediately fil-tered onto a 47 mm diameter Poretics (Millipore) membrane filter with a pore size of 5 µm using a peristaltic pump.
At the SD stations, the same collection was implemented; however a 25 mm diameter Poretics membrane filter was used. The high densities of cells on the latter made it im-possible to properly enumerate the various cyanobacterial diazotrophs and as such these samples were used only for qualitative observations (see below). Immediately after filtra-tion, samples were fixed in 1 % paraformaldehyde (v/v) for 30 min prior to storing at −20◦C. For enumeration, the filter was mounted on a glass slide and examined under an Olym-pus BX60 microscope equipped with a filter for blue (460– 490 nm) and green (545–580 nm) excitation wavelengths. Three areas (area = 0.94 mm2)per filter were counted sepa-rately and values were averaged. When abundances were low, the entire filter (area = 1734 mm2) was observed and cells enumerated. Due to weak fluorescence, only Trichodesmium colonies and free filaments could be accurately estimated with microscopy and in addition, the larger cell diame-ter Trichodesmium, hereafdiame-ter referred to as Katagynemene pelagicum, was enumerated separately as these were often present albeit at lower cell densities. Other cyanobacterial di-azotrophs, e.g., C. watsonii-like cells, C. rhizosoleniae (het-3), and R. intracellularis (het-1, het-2), were also present on the larger 47 mm diameter samples; however fluores-cence was weak and therefore difficult to enumerate. Pico-eukaryote populations, identified as round 1–3 µm diameter cells, with red excitation under the blue filter set, were also observed. For the latter populations, qualitative observations of presence and some details on cell integrity (e.g., fluores-cence, diatom frustule, free-living or symbiotic form) are in-cluded.
2.2 Nutrient analyses
Seawater for nutrient analyses was collected from each sta-tion using the CTD rosette at the same depths as those col-lected for the nucleic acids. Seawater for inorganic nutri-ent analysis was collected in 20 mL high-density polyethy-lene HCL-rinsed bottles and poisoned with HgCl2 to a
fi-nal concentration of 20 µg L−1and stored at 4◦C until anal-ysis. The samples were frozen and returned to the laboratory for analysis within 4 months. Dissolved nitrate and nitrite (NO−3 +NO−2, DIN), phosphate (PO3−4 , DIP), and silicate (Si (OH)4, DiSi) concentrations were determined with standard
colorimetric techniques using a segmented flow analyzer ac-cording to Aminot and Kérouel (2007) on a SEAL Analyti-cal AA3 HR system (Seal AnalytiAnalyti-cal, Serlabo Technologies; Entraigues Sur La Sorgue, France). Quantification limits for nitrate, phosphate, and silicate were all 0.05 µmol L−1. 2.3 DNA extraction
The DNA from the 120 archived samples was extracted as described in Moisander et al. (2008), with a 30 s reduction in the agitation step in a Fast Prep cell disrupter (Thermo, model FP120; Qbiogene, Inc.; CEDEX, France) and an elu-tion volume of 70 µL. The nucleic acid samples collected for the at-sea qPCR were extracted immediately after filtration using a modified version of the DNeasy plant kit (Qiagen) total DNA extraction protocol. The modifications were an initial 2 min agitation step using a bead beater (Biospec Mini-BeadBeater-16, model 607EUR; Biospec), 10 min proteinase K incubation, and final elution volume of 25 µL.
2.4 Oligonucleotide design
A new primer and probe set was designed to amplify the UCYN-A1 host and was based on a published 18S rRNA sequence (accession number JX291893) re-ported from the North Pacific gyre (station ALOHA) (Thompson et al., 2012). The design utilized the same 96 bp target region of the 18S rRNA used to amplify UCYN-A2 hosts described in Thompson et al. (2014) (Table S1 in the Supplement). The primers and probe for the UCYN-A1 host 18S rRNA gene assay are as follows: forward, 50AGGTTTGCCGGTCTGCCGAT-30; reverse, 50GAGCGGGTGTCGGAGACGGAT-30; probe, 50-FAM-CTGGTAGAACTGTCCT-TAMRA-30. The for-ward, reverse, and probe contain two to four, one, and five mismatches, respectively, to UCYN-A2 host sequences (accession number KF771248-KF771254) and the fol-lowing closely related sequences (98–100 %): uncultured eukaryote clones (station ALOHA: EU50069; Cariaco Basin: GU824119) Chrysochromulina parkeae: AM490994; Braarudosphaera bigelowii TP056a: AB250784; B. bigelowii Furue-15: AB478413; B. bigelowii Funahama T3: AB478413; and B. bigelowii Yastushiro-1 AB478414.
The UCYN-A1 host oligonucleotides specificity was tested de nova against the following closely related sequences derived from uncultured eukaryotic clonal sequences (ac-cession numbers: EU500067-68, FJ537341, EU500138-39, EF695227, EU500141, EU499958, EF695229, EF695220). Only one mismatch was found in the forward probe for one sequence (EU500138) (Table S1). The nucleotide sequence identity for UCYN-A1 and UCYN-A2 host sequences is 97.95 %. Finally, a cross-reactivity test between the newly designed UCYN-A1 host oligonucleotides and a dilution series of the UCYN-A2 host template was run (see below). 2.5 Quantitative PCR
Abundances of nifH gene copies from selected diazotrophic groups (UCYN-A1, UCYN-A2, UCYN-B, UCYN-C, het-1, het-2, het-3, and Trichodesmium spp.) and the 18S rRNA of UCYN-A1 and A2 hosts were quantified using previously published oligonucleotides and TaqMan assays (Church et al., 2005; Foster et al., 2007; Moisander et al., 2010; Thomp-son et al., 2014) and the newly designed UCYN-A1 host oligonucleotides (Table S1). The qPCRs were conducted in a StepOnePlus system (Applied Biosystems, Life Technolo-gies; Stockholm, Sweden) in fast (> 40 min) mode with the following parameters: 95◦C for 20 s, followed by 45 cycles of 95◦C for 1 s, and 60◦C for 20 s.
Cross-reactivity tests were run on two of the heterocystous symbiont (het-1 and het-2) oligonucleotides, the UCYN-A1 and UCYNA-2 oligonucleotides, and the newly designed UCYN-A1 host oligonucleotides and UCYN-A2 host primer and probe set. Cross-reactivity tests for het-3 were omitted as previously published tests (Foster et al., 2007) showed no cross-reaction with het-1 or het-2. The standard curve for a particular target was run in reactions with the other primers and probe sets. For example, the UCYN-A1 TaqMan host primers and probes were run in reactions with UCYN-A2 template DNA. The cross-reactivity for the het-1 and het-2 primer and probe sets has been previously reported (Foster et al., 2007), however only when the assay is run in stan-dard mode. Stanstan-dard mode runs the holding, denaturation, and annealing stages at the following longer intervals than in Fast mode: 11 min and 40 s, 14 s, and 40 s, respectively. Hence, we tested the cross-reactivity for the het primers and probes when run in fast mode, as the fast mode was used in our study. Similarly, the cross-reactivity between UCYN-A1 and UCYN-A2 was tested in fast mode at two annealing temperatures, 60 and 64◦C; 64◦C is the recommended
an-nealing temperature for the UCYN-A2 assay (Thompson et al., 2014).
Reaction volume was 20 µL in all qPCRs and consisted of 10 µL of 2X TaqMan fast buffer (Applied Biosystems), 5.5 µL of nuclease free water (Sigma Aldrich Sweden AB; Stockholm Sweden), 1 µL each of the forward and reverse primers (10 µM), 0.5 µL of fluorogenic probe (10 µM), and 2 µL of DNA extract. For standard mode runs, the latter
mas-ter mix was identical, with the exception of replacing the fast 2X buffer with the standard 2X buffer. For reactions quantify-ing Trichodesmium spp. nifH copies, SD 9 was excluded and 1 µL of DNA template was used for the remaining stations due to low template volume, and total reaction volume was adjusted by the addition of 1 µL of nuclease free water. Reac-tions were performed in duplicates for the at-sea qPCR and in triplicates for the archived samples and lab-based qPCR. For the at-sea qPCR, only four targets (A1, UCYN-A2, UCYN-B, and UCYN-C) were quantified and only at the SD stations. No assays were processed at SD 5–6, 10–12, and 14 for the at-sea qPCR due to no potential LD station selec-tion for these sites. Two microliters of nuclease free water was used as template in no-template controls; no nifH copies were detected in the no-template controls.
Gene copy abundance was calculated from the mean cycle threshold (Ct) value of the three replicates and the standard curve for the appropriate oligonucleotides in the lab-based qPCRs. For the at-sea qPCR, a mean Ct value of two repli-cates was used to maximize the number of samples run on one amplification plate (96 well). In samples in which one or two out of three replicates produced an amplification, signals were noted as detectable but not quantifiable (dnq) and no amplification was noted as below detection (bd).
2.6 Standard curves and PCR efficiency
Standard curves were plotted and analyzed in Excel for each target based on the qPCR Ct values from known di-lutions of synthesized target gene fragments (gBlocks®; In-tegrated DNA Technologies; Leuven, Belgium) (359 bp nifH and 733 bp 18S rRNA for UCYN-A hosts). We made 10-fold dilutions starting with 108to 101gene copies L−1. The PCR efficiency, for identification of possible interfering contami-nants in our samples, was determined as previously described (Short et al., 2004) for 12 samples run on the het-1, het-2, and het-3 primers and probe tests. The qPCR efficiency ranged from 90 to 99 % with an average of 94 % efficiency for the diazotroph targets het-1, het-2, and het-3.
2.7 Statistics and data analysis
Skewness and normal distribution tests by descriptive statis-tics were performed in IBM SPSS (version 23) on the fol-lowing parameters recorded during sample collection in the WTSP from the CTD package: depth (m), oxygen (mL L−1), temperature (◦C), chlorophyll fluorescence (µg L−1),
photo-synthetically active radiation (PAR; µmol photons m−2s−1), salinity (PSU), and gene copy abundances determined by qPCR. Since fewer samples and targets were processed in the at-sea qPCR, only the lab-based qPCR results from the archived samples was used for statistical analysis. Signifi-cant skew was noted when skewness, divided by its stan-dard deviation, exceeded 1.95. All but three targets (het-1, UCYN-B, and Trichodesmium spp.) and three environmental
parameters (temperature, salinity, and oxygen) were signifi-cantly skewed (not normally distributed) even after LOG10 transformation. Therefore, a nonparametric Spearman’s rank correlation was conducted to test possible correlations be-tween the targets and environmental parameters, where we assume that the het groups and UCYN-A clade are sym-biotic, while UCYN-B is free living. The resulting corre-lation matrices were visualized in the form of a heat map of hierarchical clustering in R (version 3.2.2) using pack-ages “hmisc” and “gplots”. Multivariate statistics by redun-dancy analysis (RDA) was conducted using the R pack-age “vegan”. T tests, in IBM SPSS (version 23), were per-formed to characterize the MA and SG regions and used the mean concentrations of nutrients at each station as in-put. For meta-analysis on the external data from 11 publi-cally available datasets, sampled in the Atlantic and Pacific oceans and the South China Sea, data were acquired from the PANGAEA database and previous publications (Bena-vides et al., 2016; Bombar et al., 2011; Church et al., 2005, 2008; Foster et al., 2007, 2009; Goebel et al., 2010; Kong et al., 2011; Langlois et al., 2008; Moisander et al., 2008, 2010). We included only datasets with a minimum of 10 data points on the previously mentioned diazotrophic tar-gets. Note that in all datasets the two UCYN-A phylotypes (A1 and A2) were not distinguished, and het-3 was excluded since it was rarely quantified. The meta-analysis was con-ducted using the software OpenMEE (Wallace et al., 2017) (based on R package “metafor”), where correlation coeffi-cients from Spearman’s rank were z-transformed (Fisher’s) and tested using weighted random effect models. Graphical visualization of the mean abundances of the most numerous diazotrophs across the cruise transect was also performed in IBM SPSS (version 23).
3 Results
3.1 Hydrographic conditions
Near-surface (0–5 m) DIN concentrations were below the quantification limit (bq) in both the MA and SG regions, while the mean surface DIP and DiSi concentrations were bq or low across all stations in the MA (bq-0.08 µM and 0.54– 0.56 µM, respectively) and significantly (p < 0.001; t test) higher (0.18 ± 0.07 µM and 0.79 ± 0.04 µM, respectively) at the stations in the SG (Table 1). The upper 25–30 m of the euphotic zone had stable temperatures of 29–30◦C, and the thermocline was deeper in the SG compared to the MA. The depth of the deep chlorophyll maximum (DCM) was between 70 and 165 m throughout the cruise, except for LD B (DCM at 35 m), which was sampled during a degrading surface phy-toplankton bloom. A 30-day composite of the surface chloro-phyll a (Chl a) confirmed the decreasing level of surface flu-orescence measured by the CTD package at LD B (data not shown).
3.2 Cross-reactivity tests
No amplification was detected for the newly designed UCYN-A1 host oligonucleotides run with the UCYN-A2 as template DNA and vice versa (Fig. S1a–b in the Supple-ment).
Running the het assay in fast mode showed a lower cross-reactivity between the het-1 assay and the het-2 template than vice versa (the het-2 assay and het-1 template) (Fig. S1e–f). In fact, no amplification was detected in the last two tem-plate additions and the Ct differences were > 9 when het-1 assay was run with het-2 templates. The UCYN-A2 assay detected the UCYN-A1 template in all but the last template addition and with Ct differences > 3 (1 order of magnitude) while there was a 18–20 difference in Ct value (less gene copies) when the UCYN-A1 assay was run in fast mode with UCYN-A2 templates at either annealing temperature (60 or 64◦C) and only the first three template additions (108–
106nifHcopies µL−1)were detected (Fig. S1c–d).
3.3 Comparison of at-sea and lab-based qPCR
In order to expedite the sample processing for the at-sea qPCR, a shortened and modified DNA extraction protocol was performed, four depths were sampled, and four targets were run (UCYN groups). In total, 44 samples can be com-pared with results from the parallel archived samples pro-cessed in the lab. Moreover, we considered the differences to be noteworthy only when there was at least 1 order of mag-nitude of difference in detection. A summary of the compar-ison, including the difference in nifH copy abundance is pro-vided in Table S2. In addition, a graphical comparison shows a 1 : 1 relationship between the nifH gene copies detected in the at-sea and archived samples (Fig. S3).
In general, the at-sea and lab-based qPCR values were similar in quantifying the targets. Discrepancies were noted in 7, 8, and 11 samples, which had higher detection in the at-sea analyses for UCYN-A1, UCYN-A2, and UCYN-B, re-spectively. There were fewer instances (three, four, and five, respectively) of samples processed in the lab with the full extraction that had higher nifH gene abundances for UCYN-A1, UCYN-A2, and UCYN-B, respectively.
3.4 Horizontal and vertical distributions
Trichodesmium and UCYN-B were the most abundant di-azotrophs and nifH gene abundances ranged from 104 to 106nifHcopies L−1 at multiple depths (four to six depths) in the upper water column (0–35 m) (Figs. 1–2; Table S3). Trichodesmiumrepresented 80–99 % of total nifH genes de-tected at 9 out of 17 stations with highest detection in the MA and low to bd in the SG. Microscopy observations and abun-dances of Trichodesmium spp. confirmed a high abundance of free filaments of Trichodesmium and C. watsonii-like cells
Table 1. Summary of environmental conditions in the surface (5 m) along the cruise transect. DIN is the sum of NO2+NO3.
Region Stations Surface DIN Surface DIP Surface DiSi Surface salinity Surface temp.
(µM) (µM) (µM) (PSU) (◦C)
Melanesian archipelago (MA) SD 1–12 0.02 ± 0.01 0.03 ± 0.02 0.55 ± 0.10 35.13 ± 0.27 29.33 ± 0.45
160–178◦E LDA
170–175◦W LDB
Subtropical gyre (SG) SD 13–15 0.01 ± 0.01 0.18 ± 0.07 0.79 ± 0.04 35.12 ± 0.10 29.34 ± 0.18
160–169◦W LDC
Figure 2. (a–b) LOG10 transformed mean abundances for four of the diazotrophs across the transect: het-1 (blue), Trichodesmium (green), UCYN-A1 (yellow), and UCYN-B (purple). The mean nifHabundance values are shown as a function of (a) percent (%) of surface irradiance and corresponding depth (m) on the secondary yaxis and (b) at each station. The corresponding depths for the per-cent of surface irradiance varied little; hence values were pooled and the mean is plotted. The solid black line in (b) designates the transi-tion between the Melanesian archipelago (MA) and the subtropical gyre (SG).
at LD B, while colonies were in general rarely observed (Ta-ble S5).
At stations where Trichodesmium was not the most abun-dant diazotroph (e.g., SD 2, 6, 7, 14, 15, and LD C), UCYN-B had the highest depth-integrated nifH copy abundance. UCYN-B was also the most consistently detected diazotroph and was quantifiable from all stations sampled,
account-ing for 81–100 % of the total detected nifH gene copies in the SG. There was also a depth dependency for maximum nifHgene abundance such that the average depth maxima of Trichodesmium (1.88 × 10⁶nifHcopies L−1) and UCYN-B (5.03 × 10⁵nifHcopies L−1)at the stations in the MA were 10 and 25 m, respectively. In the SG, the average depth max-imum for UCYN-B (1.50 × 10⁵nifHcopies L−1) was the same (25 m), while the average depth of the Trichodesmium maximum (1.30 × 10⁴nifHcopies L−1)deepened to 31 m.
Of the three heterocystous cyanobacterial symbiont lin-eages (het-1, het-2, and het-3), het-1 was the most dom-inant (60 % detection in total samples, 72 of 120 sam-ples), and similar to Trichodesmium had higher detection in the stations of the MA region. For example, at sta-tions SD 2, 4, and 9, het-1 represented 10–15 % of the total nifH genes quantified in the depth profiles, but in the total nifH genes quantified across the entire transect, het-1 only represented 1.5 %. Abundances for het-1 ranged between 103 and 105nifHcopies L−1 (15 of the 18 sta-tions) at multiple depths (0–90 m) and the average depth maximum at MA stations (3.11 × 10⁴nifHcopies L−1)was closer to the surface (15 m) compared to the SG stations (1.63 × 10³nifHcopies L−1; 60 m) (Fig. 1; Table S3). Het-2 and het-3 co-occurred with het-1, however at lower abun-dances (102–104nifHcopies L−1) and often bd. For ex-ample, het-2 and het-3 were bd at all depths sampled at 1 and 3 stations, respectively, located in the SG. The average depth of maximum abundance (17 m) for het-2 (3.89 × 10³nifHcopies L−1) was similar to het-1 (15 m), while het-3 (1.53 × 10³nifHcopies L−1)was deeper at 33 m (considering only the MA stations). Microscopy observa-tions confirmed the presence of R. intracellularis at five SD stations of the MA and LD B and absence at the SD stations and LD C of the SG. Noticeable was the co-occurrence of free filaments of R. intracellularis and degrading diatom cells (mainly belonging to the genus Rhizosolenia), especially at the SD 5, 6, and 7.
The unicellular symbiotic groups, UCYN-A1 and A2 (and their respective hosts), were the least detected tar-gets. For example, UCYN-A1 was bd in 53 % (63 of 120 samples) and UCYN-A2 was bd in 66 % (79 of 120 samples) of samples. UCYN-A1 and A2 represented <0.4 % of total nifH genes detected and UCYN-A
sym-bionts were bd in the SG, except at LD C. When de-tected, average nifH gene abundance for UCYN-A1 and A2 was 8.60 × 10⁴ and 4.60 × 10⁴nifHcopies L−1, respec-tively, and usually accounted for < 1.0–1.5 % of the to-tal nifH gene copies enumerated per station. One ex-ception was at LD C in the SG, when UCYN-A1 and A2 accounted for 4 and 11 %, respectively, of the to-tal nifH gene copies and were the second most abundant diazotroph (3.19 × 10⁴ and 8.53 × 10⁴nifHcopies L−1). The average depth of maximum nifH gene abundance for the UCYN-A1 (1.60 × 10⁴nifHcopies L−1) and A2 (5.76 × 10³nifHcopies L−1) symbionts was consistently recorded at deeper depths (55 and 58 m, respectively; 10 % light level).
The detection of the UCYN-A1 and A2 hosts mirrored the detection of their respective symbionts. However, in 22 and 15 samples, respectively, the UCYN-A1 and A2 symbionts were quantified while their hosts were bd. The UCYN-A hosts were never detected in samples in which their respec-tive symbionts were bd or dnq. When both UCYN-A host and symbiont were present, the abundances of the host’s 18S rRNA genes were always 1 order of magnitude less than their respective symbiont’s nifH genes, with the exception of two samples for UCYN-A1 symbionts in which their respective host 18S rRNA gene abundances were half, or nearly equal in abundance. UCYN-C was the least abundant unicellular diazotroph and was only quantified in the at-sea qPCR for which detection was poor and limited to the MA region (3 of 11 stations: one to three of four depths sampled) and abun-dances never exceeded 102nifHcopies L−1(Table S3). 3.5 Diazotroph and UCYN-A host covariation
Several significant correlations between the target dia-zotrophs and hosts were identified (Fig. 3; Table S4a). The nifHgene abundances of Trichodesmium and UCYN-B were significantly positively correlated with each other (N = 108, p <0.01). In addition, UCYN-B nifH gene copy abun-dance was significantly positively correlated with that of both UCYN-A symbionts (A1 and A2; N = 120, p < 0.01) and UCYN-A2 host abundance (N = 118, p < 0.04). Abun-dances of UCYN-A1 and A2 nifH genes were significantly positively correlated with each other, and in addition, with their respective host 18S rRNA gene abundances (N = 118– 120, p < 0.01). Lastly, the nifH gene abundances of het-1, het-2, and het-3 were significantly positively correlated with one another and with the nifH gene abundances of Tri-chodesmium and UCYN-B (N = 108–120, p < 0.01). The only correlations that were not significant were between the UCYN-A (including their hosts) and Trichodesmium and the het groups (with the exception of het-3, which correlated with the UCYN-A2 host (N = 118, p < 0.04)).
3.6 Influence of environmental conditions on diazotroph and UCYN-A host abundances in the WTSP
The nifH gene abundances of UCYN-A1 and A2 were significantly positively correlated with salinity (N = 107, p <0.02 and N = 107, p < 0.03, respectively) and depth (N = 118, p < 0.01 and N = 118, p < 0.002, respec-tively) (Fig. 3; Table S4b). However, except for het-3 (regarding depth), all other diazotrophs were signifi-cantly negatively correlated with salinity (N = 97–108, p < 0.006) and depth (N = 108–120, p < 0.001). Moreover, Tri-chodesmium, UCYN-B, and the het group (except het-3) were significantly positively correlated with PAR (N = 63– 72, p < 0.003) and temperature (N = 97–108, p < 0.001) while UCYN-A1 and A2 were significantly negatively cor-related (N = 72–108, p < 0.02) with the latter parameters. All diazotrophic targets, except UCYN-A1, UCYN-A2, and het-3, were significantly negatively correlated with DIN con-centration (N = 90–94, p < 0.02). All diazotrophs, except UCYN-A2, were significantly negatively correlated with DIP concentration (N = 96–100, p < 0.02), and all diazotrophs except UCYN-A1, A2, and het-3 were significantly nega-tively correlated with DiSi concentration (N = 97–102, p < 0.001). The gene copy abundances for the UCYN-A hosts, UCYN-A1 and UCYN-A2, and UCYN-B were significantly correlated with dissolved oxygen (UCYN-A and hosts, N = 106–108, p < 0.003; UCYN-B, N = 108, p < 0.03). In gen-eral, the correlations between nifH gene abundances and sev-eral hydrographic parameters divided the diazotrophs into two groups: the UCYN-A symbionts (and respective hosts) and all other target diazotrophs.
Hierarchical clustering based on the Spearman’s rank anal-yses resulted in two major groups: (1) a shallow group and (2) a deep group. The clustering in the euphotic zone was inferred from the negative and positive correlations for shal-low and deep groups, respectively, with depth (Fig. 3). For example, Trichodesmium and the symbiotic het-1 and het-2 lineages characterize an upper water column (shallow) group with significant clustering and positive correlations with tem-perature (N = 97–108, p < 0.001) and PAR (N = 63–72, p <0.003), while only UCYN-A1 and A2 symbionts and their respective hosts represent the deep group. UCYN-B was unique in an overlapping distribution and resulted in positive significant correlations with both the shallow and deep group euphotic zone diazotrophs (e.g., Trichodesmium, N =108, p < 0.001; UCYN-A1, N = 120, p < 0.004). Dia-zotroph targets in the deep-dwelling group significantly clus-tered and correlated positively with oxygen, depth, salin-ity, and fluorescence (N = 108–120, p < 0.03, except for UCYN-A2 and fluorescence, N = 108, p = 0.053). Despite clustering with the shallow group, het-3 was less robust in a negative correlation with salinity (N = 108, p = 0.005).
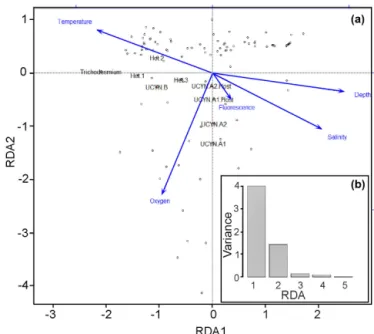
The results from the Spearman’s rank correlations were further confirmed and visualized in the RDA bi-plot (Fig. 4a),
Figure 3. Hierarchical clustering heat map of Spearman’s rho re-sults. The histogram shows negative (blue) and positive (green) val-ues of correlation strength between parameters. Stars within cells mark significant correlations (p < 0.05). In brackets are the two dis-tinct groups in the WTSP.
which explains parameter importance (Fig. 4b). Correlations with nutrients and PAR were omitted due to the limited num-ber of data points. Fluorescence, depth, and salinity corre-lated positively with each other and negatively with tem-perature, while oxygen was not significantly correlated with any other environmental parameters. The response variables UCYN-A1 and A2 and their respective hosts clustered with the explanatory variables, fluorescence, salinity, and depth, with a dependency towards oxygen. Conversely, the shal-low euphotic group (response variables Trichodesmium, het-1, and het-2) clustered closer to explanatory variable temper-ature. In addition, most of the observed variance is explained by the two axes RDA1 (72 %) and RDA2 (22 %), indicative of depth and temperature, respectively, as the most impor-tant environmental parameters for diazotroph abundance in our study. Together they form a depth–temperature gradi-ent (RDA1) where Trichodesmium occupies the warmest and shallowest waters and UCYN-A1 and A2 occupy the coldest and deepest waters, among the investigated cyanobacterial diazotrophs.
3.7 Global drivers of diazotrophic abundance
We found consistency between our results in the WTSP and the correlations identified in the 11 external datasets using the nonparametric correlation analyses and meta-analyses (Fig. 5a–d; Table S6). For example, in three of the
exter-Figure 4. (a–b) Multivariate RDA bi-plot (a) depicts the variance explained by the environmental parameters and qPCR data in sev-eral dimensions. (b) The majority of the variance (y axis: 0–4) in the dataset is explained by the RDA1 and RDA2 axes, meaning that most of the variance observed is explained by the environmen-tal parameters. The arrows are the constrained explanatory vectors with the dots representing the superimposed unconstrained response variables. PAR and nutrients (DIP and DIN) were omitted due to limited data points.
nal datasets, nifH gene abundances of Trichodesmium spp., UCYN-B, and het-1 were significantly positively correlated with temperature and negatively correlated with the same three parameters as in our study in the WTSP: salinity, DIP, and DIN. The latter correlations were identified in two re-gions of the WTSP (tropical and subtropical) and in the northern South China Sea (NSCS). In contrast to a significant positive correlation between UCYN-A nifH gene abundance and depth reported here in the WTSP, UCYN-A nifH gene abundance was negatively correlated with depth in 4 of the 11 external datasets (two regions of the WTSP, tropical At-lantic (TA), and NSCS). Moreover, and consistent with sev-eral of the other diazotrophs (Trichodesmium, UCYN-B, het-1), UCYN-A nifH gene abundance was negatively correlated with DIP and DIN concentrations (five and three additional external datasets, respectively) (Table S6).
Meta-analysis revealed similar groupings (e.g., shallow and deep) as observed in the WTSP; however, the signif-icance was less robust (Fig. 5a–d; Table S6). For example nifHgene abundances of Trichodesmium and 1 and het-2 were significantly positively correlated with temperature and negatively correlated with salinity (p < 0.05). No sig-nificance was found for UCYN-A nifH gene abundance for the latter parameters, and UCYN-B nifH gene abundance was not significantly correlated with salinity, but was
sig-Figure 5. (a–d) Meta-analysis bar graphs based on Table S6 for (a) Trichodesmium, (b) UCYN-B, (c) UCYN-A, and (d) het-1. Only the significant (p < 0.05) parameters are included and arranged with the strongest effect to the left and weakest to the right (either positive or negative). Each parameter is color coded, and the cyanobacterial diazotrophs are shades of orange and brown. Red: temperature; blue: salinity; black: depth; green: chlorophyll a; yellow: DIN; and purple: DIP.
nificantly positively correlated with temperature (p < 0.05). In addition, UCYN-A was the only diazotroph that was not significantly correlated with het-2, while all other di-azotrophs had a significant positive correlation with het-2 (p < 0.05). Similar to our findings reported for the WTSP, all diazotrophs, except UCYN-A, correlated significantly neg-atively with depth and DIP and DIN concentrations (p < 0.05) (except het-2 with DIP, which was not significant). Fi-nally, UCYN-B and het-1 nifH gene abundances were sig-nificantly negatively correlated with Chl a (p < 0.05), while Trichodesmium, UCYN-A, and het-2 were not.
4 Discussion
4.1 Environmental conditions in the WTSP
The tropical South Pacific Ocean is one of the most olig-otrophic regions of the world’s oceans with chronically low dissolved nutrient concentrations, especially DIN, and is thus considered an area primed for N2fixation. Likewise, we
en-countered surface hydrographic conditions in the WTSP that were consistently low in dissolved nutrient concentrations and similar to earlier reports for the equatorial Pacific (Bon-net et al., 2009; Dufour et al., 1999; Moutin et al., 2008; Van Den Broeck et al., 2004). The conservative tracers of temper-ature and salinity remained constant in the surface between the MA and SG regions; hence the elevated nutrient concen-trations in the SG are likely not related to an eddy intrusion. The deviation away from a 16 : 1 relationship (Redfield ra-tio) (data not shown) in the upper 125 m in both regions (MA and SG) was indicative of DIN limitation. The low DIP con-centrations in MA waters suggest utilization of DIP by
di-azotrophs in the absence of DIN; however, other sources of nitrogen were likely available to the phytoplankton commu-nity, e.g., dissolved organic nitrogen and N2fixation (Karl et
al., 2001).
4.2 Detection of diazotrophs and application of at-sea qPCR
Trichodesmium, UCYN-B, and the het group are easily iden-tifiable with standard epi-fluorescence microscopy, and so these populations can readily be observed at sea. However, UCYN-A1 and UCYN-A2, and their respective hosts, re-quire a lengthy fluorescent in situ hybridization (FISH) pro-tocol that is difficult to implement in the field. Conversely, modern oceanographers have a suite of other molecular ge-netic tools, some of which are also seagoing and autonomous (e.g., Robidart et al., 2014; Ottesen et al., 2013; Preston et al., 2011), thereby making quantification of microscop-ically unidentified microorganisms tangible by quantifying their genes, simultaneous with collection of hydrographic data. Here, we describe a rather effective, steadfast (within 3 h of sample collection) seagoing nucleic acid extraction and qPCR technique to quantify diazotrophs by their nifH gene, which was used in real time during the OUTPACE cruise to help locate the LD stations for the purpose of the project (see Moutin et al., 2017). The comparisons of the at-sea assays to the lab-based full extraction protocol and qPCR on archived samples indicated that the assays were consistent (Fig. S3a– c), and surprisingly the shortened DNA extraction performed at sea had higher abundances for all three targets (UCYN-A1, UCYN-A2, and UCYN-B) in 16–25 % of the samples processed, depending on the target diazotroph.
The disparity between the enumerations made at sea and in the lab could result from technical and/or sampling dif-ferences. For example, we do not know the DNA extrac-tion efficiency of either method used (at-sea vs. lab-based) or if extraction efficiency varies for a particular target, e.g., UCYN-A or UCYN-B. Variations between samples or repli-cates could be attested to different DNA extractions vary-ing in their efficiencies based on target organism (Boström et al., 2004). Some strains of UCYN-B are known to secrete thick extracellular matrix (Sohm et al., 2011), while others form dense colonies, and some are symbiotic with diatoms (Carpenter and Janson, 2000). Moreover, the UCYN-A sym-bioses are considered fragile and easily dismantled (Thomp-son et al., 2012). The latter observations could potentially result in differences in extraction efficiency, which is sup-ported by significant disparities in all samples for which the UCYN-A hosts were enumerated. However we find no clear pattern in higher detection for one method (at-sea vs. lab-based assays) or one particular target. Despite taking the samples from the same Niskin bottle for the archived and at-sea assays, we cannot discount the natural heterogeneity of plankton and differences in settling and that perhaps some samples were more enriched than others. Seldom are repli-cates processed in qPCR studies as those presented here, and so the disparity reported here highlights the need to address variation derived from sampling and/or extraction efficien-cies. Nonetheless, at-sea (and lab-based) qPCRs could also be appended with a multiplexing approach to both increase and broaden the number of metabolic pathways (e.g., narB, rbcL, nirS) and/or phylotypes quantified simultaneously. 4.3 Abundance and vertical distribution of diazotrophs
in the WTSP
Earlier work based on N isotope ratios (delta 15N) of sus-pended particulate matter and dissolved organic N in the WTSP suggested that new production is likely fueled by N2
fixation in this region (Hansell and Feely, 2000; Yoshikawa et al., 2005). The SP is also an area in which high nifH gene abundances of the unicellular diazotrophs, in particu-lar UCYN-A and UCYN-B, have been previously reported (Biegala and Raimbault, 2008; Bonnet et al., 2009, 2015; Moisander et al., 2010) and account for a significant (74 %) portion of the areal N2fixation (Bonnet et al., 2009). Hence,
it was likely to encounter the presence of diazotrophic popu-lations.
Recently UCYN-A and its various lineages have been highlighted as some of the most widespread and abundant diazotrophs (Farnelid et al., 2016, and references therein), which has led to the dramatic shift in the canonical paradigm of Trichodesmium as the only significant diazotroph. Sur-prisingly, here we report nifH gene abundances of the UCYN-A1 and UCYN-A2 lineages that are comparatively lower than earlier reports. In fact, UCYN-A1 and A2 were the least detected diazotrophs of our targets. Consistent
with higher UCYN-A1 and A2 biomass (3.2 × 10⁴ and 8.5 × 10⁴nifHcopies L−1, respectively) at depth (60 m) at LD C were microscopy observations of high abundances of pico-eukaryotes similar in size and shape previously reported for the UCYN-A hosts (Krupke et al., 2013). The vertical distribution of UCYN-A1 (and A2) was similar to that re-ported by Moisander et al. (2010) and others, including ear-lier studies in the North Pacific Ocean (NP) and North At-lantic (NA), where maximum abundances of UCYN-A are common to deeper depths in the euphotic zone (below 45 m) (e.g., Bonnet et al., 2015; Foster et al., 2007; Goebel et al., 2010; Needoba et al., 2007). Likewise, we also observed, like others (Cabello et al., 2016), that the UCYN-A1 and A2 sym-bioses co-occur and typically have decreased abundance to-wards the DCM and maximum abundances slightly above the nitracline.
Unlike UCYN-A phylotypes, high nifH gene abundances of Trichodesmium were common in the upper 10 m of the MA region and included both surface slicks and free fila-ments, which was consistent with earlier observations of high surface densities further north in the SP (Moisander et al., 2010; Shiozaki et al., 2014), as well as regional satellite ob-servations of blooms (Dupouy et al., 2011). Surface slicks have also been reported elsewhere, e.g., the NA (Goebel et al., 2010; Langlois et al., 2005). The depth of maximum nifHgene abundance for Trichodesmium deepened from the MA (10 m) region to the open gyre (SG, 31 m), which was similar to earlier reports in the equatorial Pacific (Bonnet et al., 2009). A niche partitioning has been suggested for Tri-chodesmiumand unicellular diazotrophs in the SP (Bonnet et al., 2015; Moisander et al., 2010) and elsewhere (Goebel et al., 2010; Langlois et al., 2005; Messer et al., 2015). How-ever, here in the WTSP, Trichodesmium abundance was pos-itively correlated with UCYN-B, which instead is consis-tent with previous studies in other ocean basins, e.g., the At-lantic Ocean (Foster et al., 2007, 2009; Langlois et al., 2008), and the South China Sea (Moisander et al., 2008). UCYN-B co-occurred with Trichodesmium in the surface samples, although at lower nifH gene abundances, and more often UCYN-B had subsurface maxima (35–70 m) in both regions (MA and SG) of the transect. The latter is also consistent with Moisander et al. (2010), who observed maximum nifH gene abundances of UCYN-B north of the Fijian islands at 37 m.
All three heterocystous symbiont phylotypes co-occurred and were widespread in the MA, with het-1 as the most abundant and most highly detected het group (70 % detec-tion or 84 of 120 samples). The early work of Moisander et al. (2010) detected het-1 at all but one of 26 stations sam-pled (56 % detected, or 56 of 100 samples), and highest nifH gene densities were reported northeast of our cruise transect. Moreover, Bonnet et al. (2015) detected het-1 and het-2 at the surface of one out of 10 stations west (approximately 10◦W) of our cruise transect. Het-2 and het-3 were not quantified by Moisander et al. (2010) and het-3 was not quantified by
Bon-net et al. (2015). Therefore, our study is among the first to report on the abundances and distributions for all three hete-rocystous diazotrophs in a large expanse of the SP. The three het phylotypes were however recently reported from a meso-cosm (enclosed design) experiment in the Noumea lagoon, a low-nutrient low-chlorophyll region located along the New Caledonian coast (Turk-Kubo et al., 2015). In fact, het-1 and het-2 were among the most abundant diazotrophs in the first half of the experiment (Turk-Kubo et al., 2015). Two addi-tional earlier studies have also reported microscopic obser-vations of free-living Richelia in the same lagoon (Biegala and Raimbault, 2008; Garcia et al., 2007).
The highest densities (104–106nifHcopies L−1) of the Richeliaphylotypes (het-1 and het-2) were restricted to the western region of the MA, and in the upper 12 m, which is shallower than the subsurface maximum (e.g., ≥ 25 m) pre-viously reported for het-1 (and het-2) in the western tropical North Atlantic (WTNA) and NP (Church et al., 2005; Foster et al., 2007; Goebel et al., 2010). Our microscopy observa-tions from SD 5 to 7 and LD A indicated that near-surface Rhizosoleniapopulations were in a moribund state since frus-tules were broken and free filaments of Richelia were ob-served. Our observations also coincide with a region of high backscattering measurements in the upper water column (5– 30 m) (Dupouy et al., 2018). Het-1 nifH genes were 4 orders of magnitude higher in abundance in the moored sediment traps of LD A (325 m: 2.0 × 10⁷nifHcopies L−1)and LD B (325 and 500 m: 5.8 × 10⁶ and 1.10 × 10⁷nifHcopies L−1, respectively) (Caffin et al., 2018) than the nifH genes de-tected in the overlying waters (3.11 × 10³nifHcopies L−1 and 4.1 × 10²nifHcopies L−1, respectively). Combined, the latter observations suggest that a higher density of the het-1 population was likely present prior to our sampling and perhaps derived from a “seed” population originating in the coastal regions of New Caledonia and that they play an im-portant role for export production in this region, as has previ-ously been shown in the NP (Karl et al., 2012), for example. The UCYN-C phylotype was poorly detected in the at-sea assays (61 % samples were bd and maximum abundance was 5.0 × 10²nifHcopies L−1), and as such was not enumerated in the archived samples. The low detection of UCYN-C is consistent with Taniuchi et al. (2012), who estimated that UCYN-C only represented a small portion of diazotrophs de-tected in the western Pacific (Kuroshio Current). However, a recent study reported relatively high UCYN-C abundances in the open waters of the Solomon Sea (north of the MA) (Berthelot et al., 2017). UCYN-C has also been observed in the New Caledonian lagoon (Turk-Kubo et al., 2015), where it was the most dominant diazotroph in the first part of the aforementioned mesocosm experiment (Turk-Kubo et al., 2015). Moreover, Turk-Kubo et al. (2015) reviewed the specificity of the UCYN-C assay used in our study (Foster et al., 2007) and concluded that it does quantify the majority of UCYN-C phylotypes. Hence, like most plankton,
abun-dances can be patchy, as was observed with UCYN-C in our study.
4.4 UCYN-A and host (co-)occurrence
Earlier and recent work has suggested a high host depen-dency (e.g., smaller and streamlined genomes) and selectiv-ity in the UCYN-A based symbioses (Cabello et al., 2016; Cornejo-Castillo et al., 2016; Farnelid et al., 2016; Krupke et al., 2013, 2014; Thompson et al., 2012; Tripp et al., 2010). Moreover, the UCYN-A partnerships are also consid-ered mutualistic, where the host and symbiont both benefit by exchange of metabolites (e.g., reduced C and N, respec-tively) (Krupke et al., 2014; Thompson et al., 2012), and based on streamlined genome content of UCYN-A, it has a photo-fermentative metabolism dependent on other organ-isms (Tripp et al., 2010; Zehr et al., 2008). Hence one would expect parallel distributions for both partners. Some have argued that the partnership is also obligatory since few ob-servations of free-living hosts have been reported and abun-dances of free symbionts assumed to be derived from dis-ruption during sample preparation are always correlated with their hosts (Cabello et al., 2016; Krupke et al., 2014; Thomp-son et al., 2012). Thus, by use of our newly designed oligonu-cleotides for the UCYN-A1 host and previously designed oligonucleotides for the UCYN-A2 host (Thompson et al., 2014), we unexpectedly found that both UCYN-A1 and A2 were often (89 and 59 %, respectively; not considering dnq) detected in the absence (or bd) of their respective hosts, while the hosts, when detected, always coincided with increased UCYN-A abundance. Our observations could result if the UCYN-A lineages live in either a loose association, or per-haps with a wider diversity of hosts than detected by the UCYN-A host assays.
The number of cells per partner lineage is considered spe-cific as well, such that 1–2 UCYN-A1 cell(s) is associated with a prymnesiophyte partner (UCYN-A1 host) and the larger B. bigelowii (UCYN-A2 host) host associates with multiple and variable numbers of UCYN-A2 cells to com-pensate for its higher N requirement (Cornejo-Castillo et al., 2016). We consistently observed higher abundances of the nifHgenes for the UCYN-A1 and A2 symbionts compared to their respective hosts’ 18S rRNA genes (2–10 and 6–34 times more abundant, for A1 and A2, respectively). Simi-lar results were found by Thompson et al. (2014), who ob-served symbiont / host ratios of 0.2–11. However, a higher detection of the UCYN-A 1 (and A2) in absence of the host detection would result if there is a broader diversity of hosts associated with the UCYN-A symbionts. Ultimately a CARD-FISH (CAtalyzed Reporter Deposition – Fluores-cence In Situ Hybridization) approach using the same 18S rRNA oligonucleotide as in the qPCR would help distinguish the discrepancy between the partner gene copy abundances.
A symbiosome-like compartment has also been described attached to the UCYN-A2 host or residing freely
(Cornejo-Castillo et al., 2016). Thus, another plausible explanation for the higher abundances of the UCYN-A2, in particular, in the absence of their respective host, could result if our assays quantified UCYN-A2 residing in a dislodged free-floating symbiosome, or an overestimate of the UCYN-A2 due to cross-reactivity with UCYN-A3 lineage as expected by in silico tests (Farnelid et al., 2016). It is less likely that the UCYN-A2 was overestimated due to cross-reaction with UCYN-A1 templates since our cross-reactivity tests showed a weak cross-reaction (see below).
4.5 Environmental influence on diazotroph abundances and distributions
The annual N inputs through biological N2 fixation in the
oceans is considered high, ranging from 100 to 200 Tg N (Eugster and Gruber, 2012; Luo et al., 2012), yet large un-certainties remain in what factor(s) influence the abundance, distribution, and activity of marine diazotrophs. Initially, we hypothesized that the conditions favoring a particular cyanobacterial diazotroph would be unique given the con-trasting life histories of different diazotrophic groups (free-living, colonial, and symbiotic). Moreover, we also suspected that the conditions promoting DDAs would differ from those influencing the UCYN-A-based symbioses given the vast dif-ferences in the symbionts and hosts (e.g., genome content of symbiont, cell size of symbiont and hosts in the two systems; expected number of symbionts per host; host phylogeny: di-atom vs. prymnesiophyte). Thus, determining the condition or sets of conditions that drive cyanobacterial diazotroph dis-tribution, abundance, and activity is of great interest.
Hydrographic conditions and dissolved nutrient concen-trations measured at the time of sampling were used to cor-relate diazotrophic abundances with various environmental parameters. Consistently, in two independent statistical tests, two groups emerged in the WTSP: (1) UCYN-A1 and A2 and their hosts (2) het-1, het-2, het-3, UCYN-B and Tri-chodesmium. Thus, conditions favoring the UCYN-A-based symbioses differ from the conditions for DDAs and free-living cyanobacterial diazotrophs.
Temperature is often cited as the most important driver of diazotroph abundance and distribution (Messer et al., 2016; Moisander et al., 2010), and recently marine nitro-gen fixation was shown to be controlled by surface irradi-ance and dissolved oxygen concentration (Luo et al., 2014). As shown earlier in the WTSP, both Trichodesmium spp. and UCYN-B were most abundant in warmer surface wa-ters (> 27◦C) in the north, while UCYN-A dominated in the
cooler (24–26◦C) southern waters of WTSP (Bonnet et al., 2015; Moisander et al., 2010). Likewise, we found similar abundances and temperature optima for the latter three zotrophs and significant correlations between the various dia-zotrophs and temperature. In fact, all diadia-zotrophs, except the UCYN-A lineages, were significantly positively correlated with temperature in the WTSP. In addition to temperature,
the environmental parameters of PAR, salinity, and depth also significantly influenced nifH gene abundance and distri-bution. Moreover, the latter two variables separated the abun-dances of the UCYN-A symbioses (A1 and A2) from the rest of the diazotrophs in the WTSP, including both free-living phylotypes and the symbiotic heterocystous lineages.
The maximum abundances at depth for UCYN-A1 and A2 were slightly above or at the nitracline and coincided with higher measures of fluorescence from the CTD. The latter is consistent with observations of high UCYN-A abundances in coastal habitats (Bombar et al., 2014), estuaries (Messer et al., 2015), or in waters that have been recently entrained with new nutrients (Moisander et al., 2010). Increased nifH copies and/or nifH gene expression for UCYN-A have also been re-ported from bioassay experiments amended with nutrients, including DIN, phosphate, and iron (Krupke et al., 2015; Langlois et al., 2012; Moisander et al., 2012). The latter is in contrast with the data reported here in the WTSP (including the meta-analysis) and several of the external datasets (e.g., WTSP, TA, NA, NSCS), which find a negative correlation be-tween DIN and DIP concentrations and nifH gene abundance of most of the diazotrophs, including UCYN-A. Across the cruise transect, conditions instead favored diatoms in sym-biosis with diazotrophs since surface DIP and DiSi concen-trations were considered not limiting (Thierry Moutin, per-sonal communication, 2017), while DIN was below detec-tion, and as reported here, resulted in higher abundances of het-1 nifH gene copies and observations of Rhizosolenia hosts in the MA. In the WTNA, waters with high DiSi con-centration and low N : P ratios, driven by a disproportion-ate utilization of N relative to P, results in consistent and widespread blooms of the Hemiaulus–Richelia symbioses (het-2) (Foster et al., 2007; Subramaniam et al., 2008).
All the diazotrophs described here are either pho-toautotrophic or associated with phopho-toautotrophic partners (UCYN-A, het-group). Therefore, light irradiance (e.g., PAR) and availability will impact the abundance and distri-bution of the diazotrophic populations. Results from CARD-FISH observations of the UYCN-A1 and A2 symbioses have reported a strong dependency on light intensity, which re-sults in higher abundances nearer to the surface (Cabello et al., 2016). Presence in shallower waters is also thought to be strategic for avoiding competition (Cabello et al., 2016). However, in the WTSP, in 11 of the 14 stations at which UCYN-A1 and A2 were detected at subsurface depth max-ima, the same lineages (and corresponding hosts) were unde-tected at the surface and displayed a negative correlation with PAR. Microscopy observations also confirmed higher num-bers of pico-eukaryotes at depth. Hence, it would appear that low light correlates with high abundances of UCYN-A, while the other free-living diazotrophs and symbiotic 1 and het-2 were positively correlated with PAR and had maxima closer to the surface with higher PAR. Interestingly, we found no significant correlation between PAR and the UCYN-A host
lineages, which is unexpected since the host partners require light for photosynthesis.
In an attempt to identify the consistency in the correla-tion patterns identified in the WTSP with other regions of the world’s ocean, the same statistical analyses were performed on 11 publically available datasets and subsequently run through a meta-analysis. Our statistical analyses provided co-efficients and p values for easy evaluation and comparisons between data sets for the influence of environmental parame-ter(s) and diazotroph abundance. The analyses confirmed that UCYN-A indeed stands out from the other diazotrophs in terms of environmental parameter influence, mainly by not being significantly correlated with temperature, which for all other diazotrophs was a significant positive correlation. In terms of temperature, UCYN-A has the lowest temperature optimum among the target cyanobacterial diazotrophs, which will influence their distributions and subsequent correlation with temperature both regionally and vertically. The stud-ies in the meta-analysis include a wide geographical range and, independent of ocean basin, the majority of the datasets found no significant correlation between UCYN-A and tem-perature. For most other environmental parameters the pat-tern for UCYN-A in the WTSP does not hold true in the meta-analysis. For example a significant negative correlation with depth was found for UCYN-A and perhaps related to high surface temperatures, given that Moisander et al. (2010) observed UCYN-A closer to the surface in the southern SP where surface temperatures were typically cooler. However, for the other target diazotrophs, depth and salinity follow the same pattern as observed in the WTSP (except for UCYN-B, which was not significantly correlated with salinity). Inter-estingly, UCYN-B seems to be mostly detected in the Pa-cific, where it was also found to be significantly negatively correlated with salinity, while in the Atlantic, perhaps due to lower detections or riverine impact, it was not significantly correlated, resulting in no significant correlation in the meta-analysis overall. Furthermore, what did unify all diazotrophs in the meta-analysis were their consistent significant pos-itive correlations with each other and significant negative correlations between abundance and concentrations of DIP and DIN, which was also observed in the WTSP, and again UCYN-A was the exception.
In summary, the correlations observed in the WTSP were not always consistent with the meta-analysis of the external datasets. We attribute the inconsistencies in part to seasonal differences in sample collections and the impact of an indi-vidual environmental parameter or sets of parameters on a local and regional scale, particularly for coastal studies that make it difficult to unambiguously explain the abundance and distribution patterns. Determining the condition or sets of conditions favoring one diazotroph or life history strategy (free-living vs. symbiotic) is complex and likely not all di-azotrophs are influenced by the same condition in time and space.
4.6 Estimation of diazotrophs by nifH qPCR
When interpreting abundance estimates by qPCR there are a few assumptions to keep in mind. A limitation of qPCR as-says is that gene copies do not equal cell abundances. Recent evidence in filamentous and heterocystous cyanobacteria re-ports evidence of polyploidy dependent on cell cycle (Griese et al., 2011; Sargent et al., 2016; Sukenik et al., 2012). More-over, Trichodesmium may contain up to 100 genome copies per cell (Sargent et al., 2016), thus a potential for overestima-tion. Conversely, underestimation of gene copies by qPCR is also plausible if one considers that DNA extraction efficiency is not 100 % and can vary among species and DNA extraction kits (Mumy and Findlay, 2004), and if high probe specificity favors exclusion of closely related phylotypes for a particular target or lineage.
A final consideration with qPCR, as shown here, is the de-gree of cross-reactivity in assays targeting closely related lin-eages (e.g., UCYN-A and het). Oligonucleotide specificity as a source of underestimation of the UCYN-A lineages was recently reviewed by a de nova analysis (Farnelid et al., 2016) showing the potential to underestimate UCYN-A sub-lineages since the widely used oligonucleotides for UCYN-A1 contain several mismatches to the other UCYN-A sub-lineages. The latter becomes important when the sublineages co-occur. Here, however, we highlight the potential to overes-timate. For example, UCYN-A2 oligonucleotides amplified the UCYN-A1 templates, indicating a tendency to overquan-tify UCYN-A2 in the presence of A1. Moreover, when the annealing temperature was set to 64◦C, to distinguish be-tween UCYN-A1 and A2 as recommended by Thompson et al. (2014), the assay still failed to separate the two sub-lineages when run in fast mode. Thus, the fast mode fea-ture has a shortcoming that could influence a wider range of targets than the ones presented here. We observed the same cross-reactivity reported earlier (Foster et al., 2007) for het-1 and het-2 when run in fast mode and highlight the potential to overestimate het-2 if het-1 co-occurs at densities of approxi-mately 106nifHcopies L−1. The latter observation has never been reported.
5 Conclusions
Consistent with earlier observations in the WTSP, we found diazotrophic cyanobacteria to be abundant, with the most abundant cyanobacterial diazotrophs being UCYN-B, Tri-chodesmium, and the symbiotic Richelia lineage het-1. Al-though the cell integrity and detection of het-1 in water col-umn samples and those from depth (e.g., sediment traps) in-dicated that the populations were in a senescent state, our work represents one of the first documentations of the three DDA populations in a wide expanse of the WTSP. In contrast to earlier work in the SP and other recent reports from global ocean surveys (Farnelid et al., 2016; Martínez-Pérez et al.,