HAL Id: hal-00449411
https://hal.archives-ouvertes.fr/hal-00449411
Submitted on 21 Jan 2010
HAL is a multi-disciplinary open access archive for the deposit and dissemination of sci-entific research documents, whether they are pub-lished or not. The documents may come from teaching and research institutions in France or abroad, or from public or private research centers.
L’archive ouverte pluridisciplinaire HAL, est destinée au dépôt et à la diffusion de documents scientifiques de niveau recherche, publiés ou non, émanant des établissements d’enseignement et de recherche français ou étrangers, des laboratoires publics ou privés.
the ocean quahog Arctica islandica, northeast Iceland
Julien Thébault, Bernd R. Schöne, Nadine Hallmann, Matthias Barth,
Elizabeth V. Nunn
To cite this version:
Julien Thébault, Bernd R. Schöne, Nadine Hallmann, Matthias Barth, Elizabeth V. Nunn. Investiga-tion of Li/Ca variaInvestiga-tions in aragonitic shells of the ocean quahog Arctica islandica, northeast Iceland. Geochemistry, Geophysics, Geosystems, AGU and the Geochemical Society, 2009, 10 (12), pp.Q12008. �10.1029/2009GC002789�. �hal-00449411�
Investigation of Li/Ca variations in aragonitic shells of the ocean quahog Arctica
islandica (northeast Iceland)
Julien Thébault a,*, Bernd R. Schöne a, Nadine Hallmann a, Matthias Barth b, and Elizabeth V. Nunn a
a Earth System Science Research Centre (Geocycles), Department of Applied and Analytical
Paleontology (INCREMENTS), Institute of Geosciences, University of Mainz, Johann-Joachim-Becherweg 21, 55128 Mainz, Germany
b Earth System Science Research Centre (Geocycles), Department of Geochemical Petrology,
Institute of Geosciences, University of Mainz, Johann-Joachim-Becherweg 21, 55128 Mainz, Germany
Running title: Li/Ca record in aragonitic bivalve shells
* Correspondence author. Present address: Université de Bretagne Occidentale, Laboratoire des Sciences de l'Environnement Marin (UMR6539 UBO/CNRS/IRD), Institut Universitaire Européen de la Mer, Technopole Brest-Iroise, Place Nicolas Copernic, 29280 Plouzané, France. Phone: +33 2 98 49 86 33; Fax: +33 2 98 49 86 45; Email: julien.thebault@univ-brest.fr
ABSTRACT
1 2
Inter- and intra-annual variations in lithium-to-calcium ratio were investigated with high 3
temporal resolution in the aragonitic outer shell layer of juvenile Arctica islandica (Mollusca; 4
Bivalvia) collected alive in 2006 off northeast Iceland. Li/Cashell ranged between 7.00 and
5
11.12 µmol mol-1 and presented well-marked seasonal cycles with minimum values recorded 6
at the annual growth lines; a general pattern was a progressive increase in Li/Cashell from
7
March to May, followed by a plateau in June, and a decrease down to minimum values in 8
July–August. Li/Cashell was correlated with δ18Oshell-derived temperature but the strength of
9
this relationship was weak (r2 < 0.25; p < 0.05). It covaried significantly with microgrowth
10
increment width and with the discharge from one of the closest rivers. Seasonal variations of 11
Li/Cashell in A. islandica may most likely be explained (1) by calcification rate, and/or (2) by
12
significant river inputs of Li-rich silicate particles flowing to the sea as soon as snow melts. In 13
the first case, Li/Cashell may be a useful proxy for addressing seasonal variations of growth
14
rate in bivalves that lack discernable microgrowth patterns. Abrupt decreases of Li/Cashell may
15
in turn help identify growth retardations due to harsh environmental conditions. Alternatively, 16
if Li/Cashell variations are linked to particulate Li inputs by rivers, this could be a new proxy
17
for the intensity of mechanical weathering of Icelandic basalts, with interesting perspectives 18
for the reconstruction of frequency and intensity of past jökulhlaups (subglacial outburst 19
floods). Further works, including experimental studies, are needed to test these hypotheses. 20
Keywords: bivalve; lithium; calcification; shell growth rate; weathering; Iceland
21
Index Terms:
22
0424 Biogeosciences: Biosignatures and proxies 23
0438 Biogeosciences: Diel, seasonal, and annual cycles (4227) 24
0454 Biogeosciences: Isotopic composition and chemistry (1041, 4870) 25
4870 Oceanography: Biological and chemical: Stable isotopes (0454, 1041) 26
4875 Oceanography: Biological and chemical: Trace elements (0489) 27
1. INTRODUCTION
28 29
During the past sixty years, a large number of studies have focused on the use of 30
elemental concentrations in marine sediment cores as proxies for past variations of 31
environmental parameters. These parameters include, among others, temperature (proxies: 32
Mg/Ca, Sr/Ca), alkalinity (Ba/Ca), dissolved inorganic carbon concentration (Cd/Ca), ocean 33
circulation (Cd/Ca, Nd, Hf, Pb), biological productivity (BaSO4, Pa/Th, Be/Th, U) and
34
sedimentation rate (230Th, 210Pb, 231Pa/230Th) (for thorough reviews, see: Wefer et al., 1999; 35
Henderson, 2002). However, the temporal resolution of such paleoceanographic 36
reconstructions is low, generally coarser than decades. Therefore, efforts have been made to 37
assess the potential of elemental content in marine biogenic carbonates, especially bivalve 38
mollusk shells, as high-resolution proxies for environmental conditions (e.g. Stecher et al., 39
1996; Vander Putten et al., 2000; Thébault et al., 2009). 40
Bivalve shells grow by accretion of calcium carbonate crystals, either in the form of 41
calcite, aragonite, or both depending on the species (Pannella and MacClintock, 1968). Shell 42
growth, however, does not occur continuously over a day, or over a year; instead, growth 43
ceases periodically, on ultradian (several growth stops during a single day), circatidal (semi-44
diurnal, ca. 12.4h), circadian (solar day, ca. 24h), circalunidian (lunar day, ca. 24.8h), or 45
annual timescales (Schöne, 2008). These growth stops result in the formation of so-called 46
growth lines, which are enriched in organic matter and separate growth increments that 47
represent equal time slices. These periodic growth lines can therefore be used to assign 48
precise calendar dates to each successive increment of accreted shell material. This 49
characteristic gives bivalve shells an outstanding potential for the high-resolution 50
reconstruction of paleoenvironmental conditions, especially through geochemical analyses. 51
For example, skeletal oxygen isotope composition (δ18O) of many bivalve species (including
scallops, mussels, and clams) has been extensively used since the pioneering work of Epstein 53
et al. (1953) to infer paleotemperature variations, sometimes with an accuracy of less than 54
1°C (Chauvaud et al., 2005; Thébault et al., 2007). 55
In the past decade, the elemental composition of bivalve shells has also been 56
increasingly used for paleoenvironmental reconstructions. Bivalve shells are not exclusively 57
made of CaCO3. Aside from Ca, a number of minor and trace elements are also incorporated
58
within the shell during its formation, either in an interstitial location within the crystal lattice 59
or as carbonates (substitution for Ca2+; Okumura and Kitano, 1986), or even within the 60
organic matrix (Lingard et al., 1992), which can represent up to 5% of the shell dry weight 61
(Marin and Luquet, 2004). The incorporation of these elements is known to be partly 62
controlled by various environmental parameters, either physical (temperature, salinity), 63
chemical (seawater elemental concentration, metallic contamination), or biological (primary 64
production). Physiology, however, also exerts an important control on the chemical 65
composition of bivalve shells (Schöne, 2008). 66
Micro-analytical techniques (e.g. laser ablation coupled to an ICP-MS system = LA-67
ICP-MS; Craig et al., 2000) allow the accurate measurement of tens of elements archived in 68
biogenic carbonates within a few seconds. Their abiding improvement considerably increases 69
the probability of discovering new paleoenvironmental proxies. With the exception of a few 70
studies (e.g. Lindh et al., 1988; Carriker et al., 1996; Dick et al., 2007) however, most 71
investigations on the geochemical composition of bivalve shells have only dealt with a few 72
elements (mainly Sr, Mg, Ba, and some trace metals including Mn, Pb, Zn, and Cd). 73
Lithium is a trace element that (1) is easily measurable using mass spectrometers, (2) 74
has been demonstrated to present an interesting potential as a paleoceanographic proxy in 75
some marine biogenic carbonates (Delaney et al., 1985; Delaney et al., 1989; Hall and Chan, 76
2004; Marriott et al., 2004a,b; Hathorne and James, 2006; Montagna et al., 2006), and (3) has 77
surprisingly not yet been analyzed in bivalve shells. One of the first studies dealing with 78
Li/Ca ratios in marine biogenic carbonates suggested that this ratio in foraminiferal calcite 79
was partly controlled by the Li/Ca ratio of the growing medium (Delaney et al., 1985). This 80
was later confirmed by Hathorne and James (2006) who demonstrated that Li/Ca in 81
foraminifera could be used to reconstruct past changes in the Li/Ca ratio of seawater, which 82
could be interpreted in terms of continental silicate weathering rate. Several studies have also 83
highlighted significant inverse relationships between temperature and Li/Ca in foraminifera 84
(Hall and Chan, 2004; Marriott et al., 2004a), in calcitic brachiopods (Delaney et al., 1989), in 85
coralline aragonite (Marriott et al., 2004b; Montagna et al., 2006), and in inorganic calcite 86
(Marriott et al., 2004b). It has finally been suggested that the main factor controlling Li 87
incorporation in foraminifera is not temperature but calcification rate (Hall and Chan, 2004; 88
Marriott et al, 2004a). Because calcification rate may be a function of CO32- concentration in
89
the oceans, it has been suggested that the Li/Ca ratio in foraminifera could be a potential 90
proxy of past atmospheric CO2 (Hall and Chan, 2004).
91
Here, we present for the first time Li/Ca records in bivalve mollusk shells. We have 92
focused on juvenile ocean quahogs Arctica islandica (Linnaeus, 1767) collected alive in 2006 93
off the coast of northeast Iceland, probably one of the last pristine ecosystems in the North 94
Atlantic. A. islandica has all the characteristics necessary for paleoceanographic 95
reconstructions. First, it produces circadian and annual growth patterns in its aragonitic shell 96
(Schöne et al., 2005a). Second, it holds the longevity record for bivalves and may in fact be 97
the longest-lived non-colonial animal, living up to 4 centuries (Schöne et al., 2005b; 98
Wanamaker et al., 2008a). Third, it exhibits a broad biogeographic distribution centered 99
around Iceland, inhabiting the continental shelves on both sides of the North Atlantic, in 100
Europe from the Barents Sea to the Bay of Cadiz in Spain, and in North America from 101
Newfoundland to Cape Hatteras (Thorarinsdóttir and Jacobson, 2005). Fourth, this species has 102
been intensively studied for its anatomy, behavior, physiology, biology, and ecology 103
(Witbaard, 1997). And finally, several studies have already highlighted that shells of 104
A. islandica provide multi-proxy records of environmental variables. Changes in
105
environmental parameters are recorded in variations of growth rates (Marchitto et al., 2000; 106
Schöne et al., 2003; Schöne et al., 2005b), stable isotope composition (Weidman et al., 1994; 107
Schöne et al., 2004; Schöne et al., 2005a,b,c; Wanamaker et al., 2008b) and trace element 108
concentrations (Epplé, 2004; Toland et al., 2000; Liehr et al., 2005). 109
The aims of this paper are (1) to analyze the behavior of Li/Ca in A. islandica aragonitic 110
shells (inter- and intra-annual variability) using variations of the oxygen isotope composition 111
of these shells as chronological checks, (2) to review the different processes that may explain 112
the temporal variations of this ratio, and (3) to assess if Li/Ca could be a promising addition to 113
the arsenal of proxies already used in bivalve shells. 114
115
2. MATERIAL AND METHODS
116 117
2.1. Study area
118
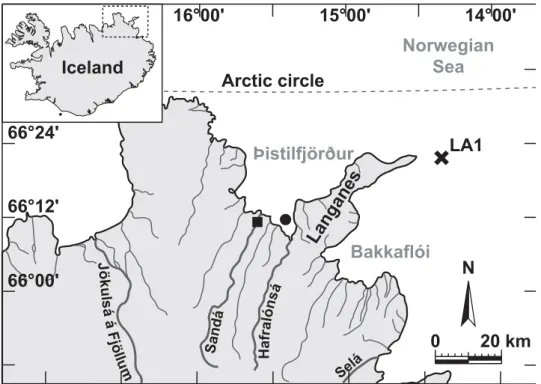
Our study site is located in Þistilfjörður (northeast Iceland; 66°10.751’N – 119
15°21.296’W), 1 km off the southwestern edge of Langanes Peninsula and 3 km away from 120
Hafralónsá estuary (Fig. 1). Hafralónsá and Sandá are the two main rivers flowing into 121
Þistilfjörður. Catchments of these two non-glacial rivers are comprised of old basaltic rocks 122
(> 3.1 million years of age). Water depth at our study site is 30 m and the substrate mainly 123
consists of sand and silt sediments. Hydrographic conditions off north Iceland largely depend 124
on the physical characteristics of the East Icelandic Current, which in turn depend on the 125
eastward transport of Greenland Polar Water by the East Greenland Current and the 126
northward transport of Irminger Atlantic Water by the North Irminger Current (Hopkins, 127
1991). No environmental survey has ever been conducted in Þistilfjörður because of its 128
isolated situation in this remote part of Iceland. The closest site where environmental data are 129
available is located 50 km northeastward of our study site, off the northeastern part of the 130
Langanes Peninsula (Langanes Austur LA1, 66°22’N – 14°22’W; Fig. 1). Environmental 131
conditions at LA1 are also mainly controlled by the relative intensities of the East Icelandic 132
Current and the North Irminger Current. Temperature and salinity are measured at this 133
location at a depth of 20 m by the Oceanographic Group of the Marine Research Institute of 134
Reykjavik using a CTD profiler (data available at http://www.hafro.is/Sjora/). This dataset 135
indicates that water temperature is lowest in February–March (mean [2000-2006] = 2.8°C; σ 136
= 0.9°C) and reaches a maximum in August (7.9°C; σ = 0.8°C). Over the same period, salinity 137
variations ranged between 34.4 and 34.8. These temperature and salinity values are similar to 138
those measured at 20-30 m water-depth in two other fjords in North Iceland: Reykjarfjörður 139
(Andrews et al., 2001) and Ísafjörður (Assthorsson, 1990). From early May to the end of 140
August, somewhat lower salinities (< 34) can be observed near the surface in Icelandic fjords 141
because of meltwater runoff from the land. However, these low salinities are restricted to the 142
top 10 m of the water column (Assthorsson, 1990; Andrews et al., 2001). Therefore, 143
temperature and salinity data measured at 20 m depth at LA1 likely reflect those of our study 144
site at 30 m depth. 145
The seawater oxygen isotope composition of our study site was measured on 17th 146
August 2006 (δ18O
water = – 0.58 ‰ VSMOW; Salinity = 34.58). Seasonal variations in
147
δ18Owater are expected given the salinity variations around the Langanes Peninsula but
148
coefficients of the local δ18Owater–salinity relationship are unknown. The δ18Owater and salinity
149
values were measured off northwest Iceland in October 1998 (65.98–68.72°N; 22.98– 150
29.25°W; depth = 10-30 m) in the framework of the VEINS Program (Variability of 151
Exchanges In the Northern Seas; data compiled by Schmidt et al., 1999). These data indicate 152
that, over the salinity range 32-35, we can expect a lowering of the δ18Owater values of 0.68 ‰
153
for every unit decrease in salinity. Given (1) δ18Owater and salinity values measured on
154
17/08/2006 at our study site, and (2) the slope of the δ18Owater–salinity relationship derived
155
from the VEINS Program, we can expect seasonal variations of δ18Owater at our study site of
156
between –0.7 and – 0.4 ‰ VSMOW over the salinity range 34.4-34.8. 157
158
2.2. Shell sampling and preparation
159
Two specimens of Arctica islandica were collected alive on 17 August 2006 by 160
dredging on our study site in Þistilfjörður, at a depth of 30 m. Both specimens (ICE06-6.2-161
A55 and ICE06-6.2-A56, hereafter simply named A55 and A56) were juveniles with a shell 162
height of 33.0 and 31.2 mm, respectively (shell length of 40.0 and 37.4 mm, respectively; Fig. 163
2a). We chose young specimens because A. islandica grows fairly rapidly during early 164
ontogenetic stages (Jones, 1983; Weidman et al., 1994; Jones, 1998; Kilada et al., 2007) and 165
young shells therefore provide the highest temporal resolution in carbonate records. 166
Immediately after dredging, the soft parts were discarded and the right and left valves 167
kept frozen until analysis. The left valves of shells A55 and A56 were gently rinsed with de-168
ionized water and air-dried. Each valve was mounted on a Plexiglas cube using a two-part 169
methacrylat glue (plastic welder, Gluetec GmbH & Co. KG, Germany) and embedded in a 170
two-part metal-epoxy resin (Wiko, Germany) to strengthen the shell and to avoid shell 171
fracture during sawing (Fig. 2b). Two immediately adjacent, 2.6-mm-thick sections were cut 172
from each valve perpendicular to the growth lines along the axis of maximum growth using a 173
low-speed precision saw (Isomet 1000, Buehler Ltd., IL, USA) equipped with a 0.4 mm thick 174
diamond-coated blade cooled and kept wet using de-ionized water (Fig. 2c). These 175
“mirroring” sections were then mounted on glass slides, manually ground with ca. 12 µm and 176
8 µm SiC powder, and polished with 1 µm Al2O3 powder to visualize the internal growth
patterns. Thick sections were ultrasonically rinsed with de-ionized water between each 178
grinding/polishing step to remove any adhering grinding powder. Thick section “A” was used 179
for isotopic analyses and thick section “B” for trace elemental analyses. Once geochemical 180
analyses were done, these thick sections were cleaned with ethanol before being etched in the 181
so-called Mutvei’s solution for 25 minutes at 37-40°C in order to resolve inter- and intra-182
annual growth lines and increments (see Schöne et al. (2005d) for a detailed description of 183
this method). Finally, the sections were gently rinsed with de-ionized water and air-dried. 184
Microgrowth increment width was subsequently measured using the image analysis software 185
Panopea (© 2004 Peinl and Schöne). High-resolution photographs of these four sections were 186
taken using a Nikon Coolpix 995 digital camera attached to a Wild Heerbrugg M3Z 187
stereozoom microscope. Photo stitching software (Photoshop Elements 2.0) was then used to 188
assemble the 25-30 photographs taken for each section into a single, high-resolution picture. 189
190
2.3. Isotopic analyses
191
The oxygen isotope ratio (18O/16O) of marine biogenic carbonate is controlled by
192
temperature and the oxygen isotope composition of the seawater from which it precipitates 193
(McCrea, 1950; Epstein et al., 1953). Therefore, shells of our two A. islandica specimens 194
were sampled for isotopic analyses in order to reconstruct variations in the bottom-water 195
temperatures these animals experienced during their life. Aragonite samples (48 and 50 196
samples on shells A55 and A56 respectively) were collected in thick sections “A” using a 197
micro-drill (Minimo C121, Minitor Co. Ltd., Japan) equipped with a 0.3 mm tungsten carbide 198
drill bit (model H52.104.003, Gebr. Brasseler GmbH & Co. KG, Germany). Samples were 199
taken in the outer shell layer along an axis running from the ventral margin and toward the 200
youth portions of the shells. Holes drilled in these sections were ca. 350 µm in diameter. 201
Aliquots of shell aragonite weighing between 38 and 125 µg (mean = 80 µg) were analyzed at 202
the University of Frankfurt using an automated Gas Bench II carbonate device interfaced with 203
a Thermo Finnigan MAT 253 isotope ratio mass spectrometer. Shell isotopic data are 204
expressed in conventional delta (δ) notation (Epstein et al., 1953) relative to the VPDB 205
standard. The in-house standard used was a Carrara marble (δ18OCarrara = – 1.74 ‰ VPDB)
206
calibrated against NBS19. The isotopic value used for this calibration was δ18ONBS19 = – 2.20
207
‰ VPDB (for more details, see Fiebig et al., 2005). Repeated analyses of this standard 208
yielded a reproducibility (1σ) of 0.07 ‰ VPDB. 209
To temporally align aragonite samples taken between two annual growth lines, we 210
compared the temperature reconstructed from our δ18Oshell records (hereafter referred as Tδ18O)
211
with seasonal variations of seawater temperature measured at 20 m depth at station LA1. To 212
this end, we used the empirically determined paleothermometry equation of Grossman and Ku 213
(1986; equation 1 in their paper). A modification of this equation was, however, required as 214
their water values were reported in VSMOW minus 0.27 ‰ (Hut, 1987). Once corrected, their 215
equation translates to: 216
217
Tδ18O = 19.43 – 4.34 (δ18Oshell – δ18Owater) (Eq. 1)
218 219
where Tδ18O is seawater temperature (in °C) reconstructed from δ18Oshell, and δ18Oshell and
220
δ18Owater are the oxygen isotope composition of aragonite and water expressed in ‰ relative to
221
the VPDB and VSMOW standards respectively. We used an average δ18O
water value of – 0.55
222
‰ VSMOW. In order to estimate the uncertainty on Tδ18O, i.e. half the difference between
223
upper and lower bounds, we applied the following formula using (1) the uncertainty in 224
δ18Oshell value given by IR-MS (εIRMS = ±0.07 ‰), and (2) the estimated range of δ18Owater
225
(min. = – 0.7 ‰ ; max. = – 0.4 ‰): 226
Uncertainty = 4.34 × (2 εIRMS + δ18Owater max. – δ18Owater min.) / 2 (Eq. 2)
228 229
This resulted in an absolute uncertainty on Tδ18O of ± 0.95°C.
230 231
2.4. Li/Cashell analyses
232
Li/Ca ratios were analyzed in thick sections “B” using LA-ICP-MS at the University of 233
Mainz. An Agilent 7500ce quadrupole ICP-MS (Agilent Technologies Inc., CA, USA) 234
coupled to a UP-213 laser ablation system (New Wave Research, CA, USA) was used with 235
the parameters listed in Table 1. Aragonite samples (n = 332 in each shell) were ablated in the 236
outer shell layer from the ventral margin toward the youth portions of the shells at a constant 237
distance from the shell surface (400 µm). The diameter of the laser spots was 80 µm and the 238
distance between the centers of two successive spots was 100 µm (i.e. 20 µm between edges 239
of two successive spots). During acquisition, signal intensities were recorded for 7Li, 43Ca and 240
44Ca. The intensity of the isotope of interest was systematically normalized against the 43Ca
241
signal (internal standard) in order to correct for laser beam energy drift, focus variation at the 242
sample surface, and ICP-MS detection drift (see Pearce et al., 1997). The glass reference 243
material NIST SRM 612 was used as a calibration standard with the values of Pearce et al. 244
(1997). Precision (degree of reproducibility) and accuracy (degree of veracity) of the applied 245
method were controlled by repeated analyses of the glass reference material NIST SRM 614 246
(Li concentration value taken from Kurosawa et al., 2002). For each shell, the sequence of 247
analyses was as follows: (NIST612)×2 + shell×2 + (shell×15 + NIST614 + shell×15 +
248
NIST612)×11 + NIST612. Data processing (including instrumental drift correction and
249
normalization) was performed using GLITTER v.4 software (Macquarie Research Ltd., 250
Australia; Van Achterbergh et al., 2001), following the methods of Longerich et al. (1996). 251
Li/Ca detection limit at the 99% confidence level was calculated by GLITTER using 252
Poisson counting statistics and was 0.243 µmol mol-1. Repeated measurements of NIST SRM 253
614 (n = 22) yielded a precision of 1.9 % (% RSD). Accuracy was extremely good with a Li 254
concentration value in NIST SRM 614 of 1.687 ± 0.007 µg g-1 compared with the 255
recommended value of 1.69 ± 0.026 µg g-1 (means ± standard errors). 256
257
2.5. Statistical analyses
258
Two different statistical tests were used to compare the means of two independent 259
samples: Student’s t-test (large samples: min(n1, n2) ≥ 30) and Mann-Whitney U-test (small
260
samples: min(n1, n2) < 30). An analysis of covariance (ANCOVA; α = 0.05) was used to test
261
whether there were significant differences between the slopes of the least-square linear 262
regressions (Li/Cashell vs. Tδ18O) calculated for each of the two shells. Homogeneity of residual
263
variances was tested with Bartlett’s test (α = 0.01). No data were excluded. All statistical 264
analyses were performed according to Scherrer (1984). 265 266 3. RESULTS 267 268 3.1. δ18Oshell profiles 269
In each shell, δ18Oshell profile showed cyclical oscillations in phase with the main growth
270
lines that were revealed after the immersion of shell sections in Mutvei’s solution (Fig. 3). 271
This confirms the annual periodicity of these growth lines. Seven main growth lines were 272
observed in both shells, suggesting that both specimens settled on the seafloor in 1999. 273
Isotopic data covered four full years of growth (2002-2005) and the beginning of year 2006. 274
δ18Oshell values ranged from 1.64 to 3.51 ‰ in shell A55 and from 1.73 to 3.45 ‰ in
275
shell A56. Annual minima ranged from 1.64 to 2.15 ‰, whereas annual maxima varied 276
between 2.92 and 3.51 ‰ (Table 2). Seasonal δ18Oshell cycles were strongly right-skewed with
277
minimum/maximum values occurring shortly before/after the annual growth lines (Fig. 3). 278
These δ18Oshell values were converted into temperature (Tδ18O) using Eq. (1) and a
279
δ18Owater value of – 0.55 ‰ (Fig. 3). Annual minimum temperatures recorded by the shells
280
ranged from 1.8 to 4.4°C (mean [2002-2006] = 3.1°C; σ = 1.0°C; Table 2). Mean annual 281
minima in shells A55 (3.0°C) and A56 (3.3°C) were not significantly different from each 282
other (Mann-Whitney U = 8.5, n1 = n2 = 5, p > 0.05). Annual maximum temperatures
283
recorded by the shells ranged from 7.7 to 9.9°C (mean [2002-2005] = 8.5°C; σ = 0.8°C; Table 284
2). Mean annual maxima in shells A55 (8.4°C) and A56 (8.7°C) did not differ significantly 285
(Mann-Whitney U = 5, n1 = n2 = 4, p > 0.05).
286
The offsets between Tδ18O and TLA1 (0.3°C and 0.6°C for average annual minima and
287
maxima respectively) are within the ± 0.95°C uncertainty on Tδ18O, so it is reasonable to
288
assume that the whole annual range of seawater temperature was recorded by the shells. 289
290
3.2. Li/Cashell profiles
291
For both specimens, Li/Cashell profiles showed cyclical variations with minimum values
292
recorded exactly at the annual growth lines (Fig. 3). A general tendency of the seasonal 293
Li/Cashell variations was a progressive increase after the annual line, followed by a plateau and
294
then a decrease down to minimum values. Maximum Li/Cashell values tended to occur earlier
295
during the growing season than δ18O
shell minima (i.e. before temperature maxima; Fig. 3).
296
Li/Cashell ranged from 7.00 to 9.40 µmol mol-1 in shell A55 (mean = 8.37 µmol mol-1;
297
Fig. 3a) and from 6.91 to 11.12 µmol mol-1 in shell A56 (mean = 9.23 µmol mol-1; Fig. 3b). 298
Mean Li/Cashell ratio was significantly higher in shell A56 than in shell A55 (t-test t = 16.87,
299
n1 = n2 = 332, p < 0.01).
Annual minimum values ranged from 7.00 to 7.29 µmol mol-1 in shell A55 (mean 301
[2001-2005] = 7.16 µmol mol-1; σ = 0.12 µmol mol-1), and from 7.10 to 7.64 µmol mol-1 in 302
shell A56 (mean [2002-2005] = 7.44 µmol mol-1; σ = 0.23 µmol mol-1; Table 3). Mean annual 303
minima in shells A55 and A56 did not differ significantly (Mann-Whitney U = 3, n1 = 5, n2 =
304
4, p > 0.05). 305
Annual maxima ranged from 9.08 to 9.40 µmol mol-1 in shell A55 (mean [2001-2005] = 306
9.30 µmol mol-1; σ = 0.13 µmol mol-1), and from 10.03 to 11.12 µmol mol-1 in shell A56 307
(mean [2002-2005] = 10.46 µmol mol-1; σ = 0.22 µmol mol-1; Table 3). Mean annual 308
maximum in shell A56 was significantly higher than in shell A55 (Mann-Whitney U = 0, n1 =
309
5, n2 = 4, p < 0.05).
310
As a consequence, mean annual amplitude in shells A55 (2.14 µmol mol-1) and A56 311
(3.02 µmol mol-1) were significantly different (Mann-Whitney U = 0, n1 = 5, n2 = 4, p < 0.05).
312
Annual amplitude ranged from 2.01 to 2.32 µmol mol-1 in shell A55, and from 2.76 to 3.63 313
µmol mol-1 in shell A56 (Table 3). 314
Li/Cashell in both shells was statistically correlated with the δ18Oshell-derived temperature
315
(p < 0.05 for both specimens; Fig. 4). An ANCOVA showed no significant difference 316
between slopes of the two linear regressions (Bartlett’s test: BC = 5.52, df = 1; ANCOVA: F =
317
0.02, df = 1 and 95). The strength of these correlations was, however, extremely weak with 318
determination coefficients ranging from 0.11 (shell A56) to 0.25 (shell A55). The difference 319
in intercept values (ca. 1 µmol mol-1) reflects the difference in annual maxima between shell
320
A56 and shell A55. 321
The comparison of Li/Cashell variations with daily shell growth rates was difficult
322
because we were unexpectedly unable to resolve microgrowth structures over the whole shell 323
sections despite etching with Mutvei’s solution. Nevertheless, 22 groups of 3-5 microgrowth 324
increments were quite clearly revealed in the A56 shell portion formed in 2004. The average 325
increment width in each of these 22 batches was calculated and plotted with the A56 Li/Cashell
326
record for year 2004 (Fig. 5a). Although the number of increment data was limited, our data 327
showed that Li/Cashell covaried with microgrowth increment width, which ranged from 24-28
328
µm near the annual lines to 43 µm in the first half of the 2004 growing season (average = 32.3 329
µm). A simple linear regression indicated that microgrowth increment width explained 53% 330
of the Li/Cashell variability in shell A56 (p < 0.001; Fig. 5b). Note that all geochemical and
331
shell growth data obtained on specimens A55 and A56 can be retrieved in the auxiliary 332 material. 333 334 4. DISCUSSION 335 336
4.1. Seasonal timing of geochemical records in shells
337
The present study is the first to investigate Li/Ca records in bivalve shells. Li/Cashell
338
seasonal variations in our two Arctica islandica specimens were well-marked, presenting a 339
1.3- to 1.6-fold range over a given growing season (Fig. 3). The inter-annual variability 340
between ontogenetic ages 3 to 8 was far less pronounced than intra-annual variability. 341
Combined analyses of Li/Cashell and δ18Oshell, and reconstruction of seawater temperature from
342
δ18Oshell allowed us to estimate the seasonal timing of Li/Cashell variations.
343
Tδ18O variations (average annual range = 3.1 – 8.5°C) showed that the whole annual
344
range of seawater temperature (2.8 to 7.9°C at 20 m depth at LA1) was recorded by the shells 345
(Table 2). This implies that A. islandica shells did not stop growing because of thermal stress. 346
Conversely, the position of the annual growth breaks between minimum and maximum 347
δ18Oshell (i.e. between maximum and minimum temperatures, recorded in August and March,
348
respectively) suggests that shells stopped growing between September and February. The 349
average microgrowth increment width measured in shell A56 was 32.3 µm at ontogenetic age 350
6, i.e. similar to the value calculated by Schöne et al. (2005a) for North Sea specimens (31.5 351
µm at ontogenetic age 4). This suggests that shell growth lasted ca. 185 days to achieve the 352
5.96 mm width of the 2004 annual increment. This result supports the hypothesis of a ca. 6-353
month growth break between September and February. As minimum temperatures were 354
recorded by δ18Oshell, shells did not stop growing because of harsh winter conditions. Schöne
355
et al. (2005a) showed that A. islandica specimens from the North Sea stopped growing from 356
early September to mid-November and described this growth break as a spawning biocheck. 357
In Iceland, A. islandica spawning activity peaks in June-July, whereas gametogenesis occurs 358
from January to May (Thorarinsdóttir, 2000). Therefore, the annual growth breaks found in 359
our specimens cannot be attributed to reproductive activity. Moreover, our specimens were 360
likely juveniles as in Icelandic waters, only 10% of A. islandica of 40 mm shell length are 361
mature (Thorarinsdóttir and Jacobson, 2005). Therefore, the origin of these annual growth 362
breaks remains unclear. Their investigation, however, is far beyond the goals of this paper. 363
The most important point is that the timing of the growing season determined by Tδ18O
364
variations allowed us to conclude that Li/Cashell increases from March to May, i.e. right after
365
the annual line, stays roughly stable in June, and then decreases in July–August. 366
367
4.2. Processes potentially involved in Li/Cashell seasonal variations
368
The shape of Li/Cashell variations is very similar in shells A55 and A56 and as such this
369
ratio likely responds to environmental variations or to variations of a physiological process 370
synchronized within a given population by genetic and/or exogenous factors. Based on 371
published literature on Li/Ca ratios in CaCO3 structures, the following parameters may
372
provide plausible hypotheses to explain the Li/Cashell variations in A. islandica: temperature,
373
calcification rate, and Li/Ca ratio in seawater. Their potential influence on the shell 374
geochemistry will be discussed in light of the evidence presented here. A fourth hypothesis 375
will also be put forward: the influence of suspended Li-rich particles originating from the 376
mechanical weathering of basaltic rocks. 377
378
4.2.1. Temperature
379
Several studies have found a significant inverse relationship between Li/Ca in CaCO3
380
structures and temperature in coralline aragonite (Marriott et al., 2004b; Montagna et al., 381
2006), in foraminiferal calcite (Hall and Chan, 2004; Marriott et al., 2004a), in calcitic 382
brachiopods (Delaney et al., 1989), and in inorganic calcite (Marriott et al., 2004b). We also 383
found relationships with temperature in A. islandica aragonitic shells but these were positive, 384
not negative (Fig. 4). Unlike these previous studies, our findings agree with thermodynamic 385
calculations predicting that Li concentration in CaCO3 structures should decrease with
386
decreasing temperature (Hall and Chan, 2004). According to Okumura and Kitano (1986), Li 387
is incorporated in the crystal structure of aragonite in substitution of Ca, leading to the 388
formation of lithium carbonate (Li2CO3) crystals. Smith et al. (1971) showed that the
389
solubility of Li2CO3 increases with decreasing temperature. In other words, crystallization of
390
Li2CO3 becomes easier as temperature rises (an almost linear relationship between 0 and
391
30°C; Smith et al., 1971). Although statistically significant (p < 0.05), the strength of our 392
temperature-Li/Cashell relationships is extremely weak (0.11 < r2 < 0.25). The weakness of this
393
relationship is particularly obvious for the 2003 Li/Cashell record in shell A56 where an
394
important offset can be seen between Li/Cashell and δ18Oshell (Fig. 3b). Our findings suggest
395
that if temperature-dependant solubility of Li2CO3 really plays a role on Li/Cashell in
396
A. islandica, this influence is extremely weak.
397 398
4.2.2. Calcification rate
Many authors have suggested that the main factor controlling Li incorporation in 400
foraminiferal calcite could be calcification rate, which may itself correlate partly with 401
temperature (Delaney et al., 1985; Hall and Chan, 2004; Marriott et al, 2004a). According to 402
Carré et al. (2006), crystal growth rate strongly influences incorporation of Sr, Ba, Mn, and 403
Mg in aragonitic shells of two Peruvian bivalve species (Mesodesma donacium and Chione 404
subrugosa). However, they did not investigate Li/Cashell ratios. Our own results seem to
405
support these findings. Indeed, we found a relatively strong relationship between microgrowth 406
increment width and Li/Ca in A. islandica shells (Fig. 5). Although microgrowth increment 407
width represents the dorso-ventral linear extension of the shell per unit time and may slightly 408
differ from the absolute calcification rate (see Gillikin et al. (2005) for elaboration), our 409
results suggest that Li/Cashell may increase as a direct response of increasing calcification rate.
410
Another argument in favor of this hypothesis is the difference observed in the range of Li/Ca 411
variations in shells A55 and A56; although these two specimens appeared to have grown at an 412
equivalent annual rate from 1999 to 2006, it can be assumed that A56 reached higher daily 413
growth rates in summer than A55, explaining the difference in annual Li/Cashell maxima
414
between these two shells. The mechanisms involved in these vital effects are unknown and 415
any discussion on that subject would be highly speculative due to the scarcity of studies 416
dealing with the formation of Li2CO3 crystals within aragonitic structures. Identification of
417
these mechanisms would require biomineralization and/or inorganic precipitation 418 experiments. 419 420 4.2.3. Li/Caseawater 421
Delaney et al. (1985) and Hathorne and James (2006) suggested that Li/Ca ratio in 422
calcitic foraminifera was directly controlled by the Li/Ca of the growing medium. Could 423
possible variations of Li/Caseawater over A. islandica growing season have an influence on the
shell geochemistry? Li is essentially conservative in seawater with an almost constant 425
concentration of 26 µmol L-1 and a Li/Caseawater ratio of ca. 2310 µmol mol-1 (Li, 2000). It has
426
no significant involvement in biological activity or scavenging by particles (Stoffyn-Egli and 427
Mackenzie, 1984). Given the long residence times of Li (1.5 million years; Huh et al., 1998) 428
and Ca (1 million year; Broecker and Peng, 1982), the Li/Ca ratio of the global ocean has 429
probably not changed over the Holocene (Hall and Chan, 2004). The two major sources of Li 430
to the ocean are (1) high-temperature basalt-seawater reactions, and (2) river input from the 431
weathering of continental crust (Hoefs and Sywall, 1997). In hydrothermal systems near the 432
mid-ocean ridges, Li is leached from oceanic basalts at temperatures >250°C (Hoefs and 433
Sywall, 1997). Although the mid-Atlantic ridge runs right through Iceland, it is unlikely that 434
such high temperatures could be reached at shallow coastal locations. Moreover, it is hardly 435
conceivable that Li leaching from this ridge would follow a seasonal pattern; it is rather 436
roughly constant throughout the year. Therefore, high-temperature hydrothermal circulation 437
can certainly not explain Li/Cashell seasonal variations.
438
Seasonal variations of riverine inputs may, however, have a local influence on Li/Ca 439
ratios in coastal waters. Intensities of chemical and mechanical weathering of silicate rocks 440
like basalts are usually expressed in terms of fluxes of dissolved and suspended materials, 441
respectively (Gislason et al., 2009). Gislason et al. (2009) found a relationship between air 442
temperature and chemical weathering rate in 8 northeastern Iceland river catchments. Air 443
temperature in Iceland starts increasing in March and reaches maxima in July. Intensity of 444
chemical weathering may therefore follow the same general pattern as Li/Cashell. Pogge von
445
Strandmann et al. (2006) analyzed the chemical composition of 25 Icelandic rivers in 446
September 2003 and August 2005 and found an average dissolved Li concentration of 87.5 447
nmol L-1 (range: 1.54–1250 nmol L-1) and a Li/Cariver ratio ranging from 31 to 2461 µmol
448
mol-1 (average = 563 µmol mol-1). This dissolved Li concentration range is similar to that
measured by Vigier et al. (2009) in the major Icelandic rivers (range: 3–317 nmol L-1; average 450
= 86.5 nmol L-1). These values may be slightly higher in July, ie. at the annual air temperature 451
maximum. According to Delaney et al. (1985), a 1.8 to 2.6-fold increase of the average 452
Li/Caseawater ratio is necessary to observe a 1.3 to 1.6-fold increase of Li/Ca in calcitic
453
foraminifera. This relationship can probably not be applied to A. islandica shells because of 454
their aragonitic structure. Nevertheless, it highlights that Li/Caseawater must increase
455
significantly to induce a 1.3 to 1.6-fold increase of Li/Ca in biogenic carbonates. Given that 456
the maximum Li/Cariver ratio measured by Pogge von Strandmann et al. (2006) was only
1.1-457
fold higher than Li/Caseawater, seasonal variations of basalt chemical weathering and dissolved
458
Li flux can hardly explain the full variability of Li/Cashell in A. islandica.
459 460
4.2.4. Suspended Li-rich basaltic particles
461
A fourth hypothesis could be put forward to explain Li/Cashell seasonal variations: the
462
possible influence of weathered basaltic particles carried by rivers. Seasonal variations of 463
Sandá River discharge were obtained from the Hydrological Service of the Icelandic National 464
Energy Authority (http://www.os.is/; Fig. 6). These data show that discharge roughly follows 465
the same seasonal pattern as Li/Cashell, with values ranging from ca. 10 m3 s-1 in fall and
466
winter to ca. 35 m3 s-1 in June (long term average). Could these variations in river discharge 467
induce large changes in the flux of suspended particles? Gislason et al. (2009) described and 468
quantified a direct relationship between river discharge and mechanical weathering (expressed 469
as suspended inorganic material (SIM) flux) in 8 river catchments in northeast Iceland. 470
Depending on which of their 8 discharge-SIM flux equations is used for calculation, the 350% 471
seasonal increase in river discharge would induce a 350 to 4900% increase in SIM flux over a 472
year. Therefore, high loads of suspended basaltic particles probably flow to the sea with 473
Icelandic rivers as soon as the snow melts, reaching a peak roughly at the same time as the 474
Li/Cashell annual maximum. These river particles have a high Li content (several ppm; Pogge
475
von Strandmann et al., 2006), ca. 1 order of magnitude larger than in shells. Although the 476
freshwater inputs likely flow as a thin surface layer (ca. 10 meters thickness; cf. Assthorsson, 477
1990; Andrews et al., 2001), it is likely that suspended material carried by rivers can cross the 478
halocline and settle on the seafloor, thus modifying the chemistry of bottom waters. 479
Consequently, these Li-rich particles may significantly increase Li/Cashell, either directly (if
480
ingested, transferred to the internal fluids, and then incorporated within the shell during 481
biomineralization) or indirectly if they weather after deposition on the seafloor. This 482
hypothesis could be tested in further studies through analyses of the lithium isotope 483
composition of A. islandica shells. SIM originating from the weathering of basaltic material 484
has a very low δ7Li value (δ7LiSIM = – 1.3 to 7.5‰ in Icelandic rivers; Pogge von Strandmann
485
et al., 2006) in comparison to seawater (δ7Liseawater = 32‰; Huh et al., 1998). If indeed Li
486
incorporation in shells is linked to Li-rich particle inputs by rivers, then shell aragonite must 487
have a δ7Li several per mil lighter than seawater. 488
489
4.3. Conclusions
490
Lithium is likely incorporated in A. islandica aragonitic shells as lithium carbonate 491
Li2CO3, i.e. Li+ substitutes for Ca2+ at the site of calcification in the extrapallial fluid. Several
492
explanations could account for the observed seasonal variations in Li/Ca ratio in shells: 493
1 - The significant positive relationship found between δ18O
shell-derived temperature and
494
Li/Cashell suggests that seasonal Li/Cashell variations could be linked to increasing solubility of
495
Li2CO3 with decreasing temperature in the extrapallial fluid. However, the strength of this
496
relationship is so weak that temperature-dependant solubility of Li2CO3 cannot possibly be
497
the main factor controlling Li/Cashell variations;
2 - Given the strong and significant positive relationship found between Li/Cashell and
499
microgrowth increment width, Li/Cashell may partly be controlled by variations in calcification
500
rate. As this rate is also partly controlled by temperature, it is difficult to make conclusions 501
about the exact importance of Li2CO3 solubility in Li/Cashell variations;
502
3 - Sandá river discharge and Li/Cashell presented an intriguing similarity in their seasonal
503
variations. As soon as snow melts in spring, mechanical weathering of basaltic rocks gains 504
intensity due to the increased river discharge, leading to a massive flow of Li-rich silicate 505
particles into the ocean. This phenomenon reaches a peak at the same time as Li/Cashell. We
506
therefore suggest that this massive input of Li could be trapped in the shell, thus impacting 507
Li/Cashell.
508
If indeed Li/Cashell is mainly controlled by calcification rate, then this ratio may be
509
useful to address seasonal variations in growth rate of bivalve species in which daily growth 510
increments and lines are not easily discernable. In turn, abrupt decreases of Li/Cashell may be
511
helpful to identify growth retardations, for instance related to the occurrence of toxic 512
phytoplankton blooms in coastal ecosystems. Alternatively, if Li/Cashell in A. islandica is
513
controlled by river inputs of Li-rich silicate particles, it may then be used a proxy for the 514
intensity of mechanical weathering of Icelandic basaltic rocks. This could have exciting 515
perspectives, e.g. to get a better insight about the frequency and intensity of past jökulhlaups 516
(subglacial outburst floods). It may also be interesting to analyze the geochemical 517
composition of recent A. islandica shells from the south-east coast of Iceland, where a huge 518
jökulhlaup flowed under the Vatnajökull glacier in 1996 because of the subglacial eruption of 519
the Grímsvötn Volcano. In any event, it is clear from our work that further studies, including 520
δ7Lishell analyses and experiments under controlled conditions, are needed to better understand
521
Li/Cashell variations in bivalve shells and to determine if this could be a useful proxy for
522
paleoecological reconstructions. 523
ACKNOWLEDGMENTS
524 525
We acknowledge Jens Fiebig (University of Frankfurt, Germany) for isotopic analyses 526
of Arctica shells, Chris Romanek (University of Georgia, USA) for δ18O analysis of water 527
samples, and Sven Baier for help during dredging in Iceland. Dredging of samples was kindly 528
made possible through Siggeir Stefánsson and Þorgrímur Kjartansson (Hraðfrystistöð 529
Þórshafnar, Iceland). We also express deep appreciation to the Oceanographic Group of the 530
Marine Research Institute of Reykjavik for making their temperature and salinity data freely 531
available on their website (http://www.hafro.is/Sjora/), and to the Hydrological Service of the 532
Icelandic National Energy Authority for Sandá River discharge data (data available at 533
http://www.os.is/). Thanks are due to the NASA Goddard Institute for Space Studies and 534
especially Gavin Schmidt, Grant Bigg and Eelco Rohling for their compilation of salinity and 535
δ18Owater data (http://data.giss.nasa.gov/o18data/), and to the scientists of the VEINS Program
536
who made their salinity and δ18Owater data available on the NASA website. This manuscript
537
has greatly benefited from critical reviews and very helpful comments by Katie Matthews and 538
two anonymous reviewers. Financial support for this study was provided by the German 539
Research Foundation (DFG) to Bernd R. Schöne (SCHO 793/4). Julien Thébault gratefully 540
acknowledges the Alexander von Humboldt Foundation (Bonn, Germany) for the award of a 541
Research Fellowship for Postdoctoral Researchers. This is Geocycles publication number 627. 542
REFERENCES
543 544
Andrews, J. T., C. Caseldine, N. J. Weiner, and J. Hatton (2001), Late Holocene (ca. 4 ka) 545
marine and terrestrial environmental change in Reykjarfjördur, north Iceland: climate 546
and/or settlement?, J. Quarter. Sci., 16, 133-143. 547
Astthorsson, O. S. (1990), Ecology of the euphausiids Thysanoessa raschi, T. inermis and 548
Meganyctiphanes norvegica in Ísafjord-deep, northwest-Iceland, Mar. Biol., 107,
147-549
157. 550
Broecker, W. S., and T.-H. Peng (Eds.) (1982), Tracers in the sea, 690 pp., Eldigio Press, 551
Palisades. 552
Carré, M., I. Bentaleb, O. Bruguier, E. Ordinola, N. T. Barrett, and M. Fontugne (2006), 553
Calcification rate influence on trace element concentrations in aragonitic bivalve shells: 554
Evidences and mechanisms, Geochim. Cosmochim. Acta, 70, 4906-4920. 555
Carriker, M. R., C. P. Swann, J. Ewart, and C. L. Counts III (1996), Ontogenetic trends of 556
elements (Na to Sr) in prismatic shell of living Crassostrea virginica (Gmelin) grown in 557
three ecologically dissimilar habitats for 28 weeks: a proton probe study, J. Exp. Mar. 558
Biol. Ecol., 201, 87-135.
559
Chauvaud, L., A. Lorrain, R. B. Dunbar, Y.-M. Paulet, G. Thouzeau, F. Jean, J.-M. Guarini, 560
and D. Mucciarone (2005), Shell of the Great Scallop Pecten maximus as a high-561
frequency archive of paleoenvironmental changes, Geochem. Geophys. Geosystems, 562
6(8), Q08001, doi:10.1029/2004GC000890.
563
Craig, C.-A., K. E. Jarvis, and L. J. Clarke (2000), An assessment of calibration strategies for 564
the quantitative and semi-quantitative analysis of calcium carbonate matrices by laser 565
ablation-inductively coupled plasma-mass spectrometry (LA-ICP-MS), J. Anal. At. 566
Spectrom., 15, 1001-1008.
Delaney, M. L., A. W. H. Bé, and E. A. Boyle (1985), Li, Sr, Mg, and Na in foraminiferal 568
calcite shells from laboratory culture, sediment traps, and sediment cores, Geochim. 569
Cosmochim. Acta, 49, 1327-1341.
570
Delaney, M. L., B. N. Popp, C. G. Lepzelter, and T. F. Anderson (1989), Lithium-to-calcium 571
ratios in modern, Cenozoic, and Paleozoic articulate brachiopod shells, 572
Paleoceanography, 4, 681-691.
573
Dick, D., E. Philipp, M. Kriews, and D. Abele (2007), Is the umbo matrix of bivalve shells 574
(Laternula elliptica) a climate archive?, Aquat. Toxicol., 84, 450-456. 575
Epplé, V. M. (2004), High-resolution climate reconstruction for the Holocene based on 576
growth chronologies of the bivalve Arctica islandica from the North Sea, Ph.D. thesis, 577
101 pp., University of Bremen, 17 December. 578
Epstein, S., R. Buchsbaum, H. A. Lowenstam, and H. C. Urey (1953), Revised carbonate-579
water isotopic temperature scale, Bull. Geol. Soc. Am., 64, 1315-1326. 580
Fiebig, J., B. R. Schöne, and W. Oschmann (2005), High-precision oxygen and carbon 581
isotope analysis of very small (10–30 μg) amounts of carbonates using continuous flow 582
isotope ratio mass spectrometry, Rapid Commun. Mass Spectrom., 19, 2355-2358. 583
Gillikin, D. P., A. Lorrain, J. Navez, J. W. Taylor, L. André, E. Keppens, W. Baeyens, and F. 584
Dehairs (2005), Strong biological controls on Sr/Ca ratios in aragonitic marine bivalve 585
shells, Geochem. Geophys. Geosystems, 6(5), Q05009, doi:10.1029/2004GC000874. 586
Gislason, S. R., et al. (2009), Direct evidence of the feedback between climate and 587
weathering, Earth and Planetary Science Letters, 277, 213-222. 588
Grossman, E. L., and T.-L. Ku (1986), Oxygen and carbon isotope fractionation in biogenic 589
aragonite; temperature effects, Chem. Geol., 59, 59-74. 590
Hall, J. M., and L.-H. Chan (2004), Li/Ca in multiple species of benthic and planktonic 591
foraminifera: thermocline, latitudinal, and glacial-interglacial variation, Geochim. 592
Cosmochim. Acta, 68, 529-545.
593
Hathorne, E. C., and R. H. James (2006), Temporal record of lithium in seawater: A tracer for 594
silicate weathering?, Earth Planet. Sci. Lett., 246, 393-406. 595
Henderson, G. M. (2002), New oceanic proxies for paleoclimate, Earth Planet. Sci. Lett., 203, 596
1-13. 597
Hoefs, J., and M. Sywall (1997), Lithium isotope composition of quaternary and tertiary 598
biogene carbonates and a global lithium isotope balance, Geochim. Cosmochim. Acta, 599
61, 2679-2690.
600
Hopkins, T. S. (1991), The GIN Sea - a synthesis of its physical oceanography and literature 601
review 1972-1985, Earth Sci. Rev., 30, 175-318. 602
Huh, Y., L.-H. Chan, L. Zhang, and J. M. Edmond (1998), Lithium and its isotopes in major 603
world rivers: implications for weathering and the oceanic budget, Geochim. Cosmochim. 604
Acta, 62, 2039-2051.
605
Hut, G. (1987), Consultants' group meeting on stable isotope reference samples for 606
geochemical and hydrological investigations, Report to the Director General, 44 pp., 607
International Atomic Energy Agency, Vienna. 608
Jones, D. S. (1983), Sclerochronology: Reading the record of the molluscan shell, Am. Sci., 609
71, 384-391.
610
Jones, D. S. (1998), Isotopic determination of growth and longevity on fossil and modern 611
invertebrates, Palaeontol. Soc. Pap., 4, 37-67. 612
Kilada, R. W., S. E. Campana, and D. Roddick (2007), Validated age, growth, and mortality 613
estimates of the ocean quahog (Arctica islandica) in the western Atlantic, ICES J. Mar. 614
Sci., 64, 31-38.
Kurosawa, M., S. E. Jackson, and S. Sueno (2002), Trace element analysis of NIST SRM 614 616
and 616 glass reference materials by Laser Ablation Microprobe-Inductively Coupled 617
Plasma-Mass Spectrometry, Geostand. Geoanal. Res., 26, 75-84. 618
Li, Y.-H. (Ed.) (2000), A compendium of geochemistry: From solar nebula to the human 619
brain, 440 pp., Princeton University Press, Princeton.
620
Liehr, G. A., M. L. Zettler, T. Leipe, and G. Witt (2005), The ocean quahog Arctica islandica 621
L.: a bioindicator for contaminated sediments, Mar. Biol., 147, 671-679. 622
Lindh, U., H. Mutvei, T. Sunde, and T. Westermark (1988), Environmental history told by 623
mussel shells, Nucl. Instr. Meth. Phys. Res. B, 30, 388-392. 624
Lingard, S. M., R. D. Evans, and B. P. Bourgoin (1992), Method for the estimation of 625
organic-bound and crystal-bound metal concentrations in bivalve shells, Bull. Environ. 626
Contam. Toxicol., 48, 179-184.
627
Longerich, H. P., S. E. Jackson, and D. Günther (1996), Laser ablation inductively coupled 628
plasma mass spectrometric transient signal data acquisition and analyte concentration 629
calculation, J. Anal. At. Spectrom., 11, 899-904. 630
Marchitto, T. M., G. A. Jones, G. A. Goodfriend, and C. R. Weidman (2000), Precise 631
temporal correlation of Holocene mollusk shells using sclérochronologie, Quat. Res., 632
53, 236-246.
633
Marin, F., and G. Luquet (2004), Molluscan shell proteins, C. R. Palevol, 3, 469-492. 634
Marriott, C. S., G. M. Henderson, R. Crompton, M. Staubwasser, and S. Shaw (2004a), Effect 635
of mineralogy, salinity, and temperature on Li/Ca and Li isotope composition of calcium 636
carbonate, Chem. Geol., 212, 5-15. 637
Marriott, C. S., G. M. Henderson, N. S. Belshaw, and A. W. Tudhope (2004b), Temperature 638
dependence of δ7Li, δ44Ca and Li/Ca during growth of calcium carbonate, Earth Planet. 639
Sci. Lett., 222, 615-624.
McCrea, J. M. (1950), On the isotopic chemistry of carbonates and a paleotemperature scale, 641
J. Chem. Phys., 18, 849-857.
642
Montagna, P., M. McCulloch, C. Mazzoli, S. Silenzi, and S. Schiaparelli (2006), Li/Ca ratios 643
in the Mediterranean non-tropical coral Cladocora caespitosa as a potential 644
paleothermometer, Geophys. Res. Abstr., 8, Abstract 03695. 645
Okumura, M., and Y. Kitano (1986), Coprecipitation of alkali metal ions with calcium 646
carbonate, Geochim. Cosmochim. Acta, 50, 49-58. 647
Pannella, G., and C. McClintock (1968), Biological and environmental rhythms reflected in 648
molluscan shell growth, J. Paleontol., 42, 64-80. 649
Pearce, N. J. G., W. T. Perkins, J. A. Westgate, M. P. Gorton, S. E. Jackson, C. R. Neal, and 650
S. P. Chenery (1997), A compilation of new and published major and trace element data 651
for NIST SRM 610 and NIST SRM 612 glass reference materials, Geostand. Geoanal. 652
Res., 21, 115-144.
653
Pogge von Strandmann, P. A. E., K. W. Burton, R. H. James, P. van Calsteren, S. R. Gíslason, 654
and F. Mokadem (2006), Riverine behaviour of uranium and lithium isotopes in an 655
actively glaciated basaltic terrain, Earth Planet. Sci. Lett., 251, 134-147. 656
Scherrer, B. (1984), Biostatistiques, 850 pp., Gaëtan Morin Editeur, Québec. 657
Schmidt, G.A., G. R. Bigg, and E. J. Rohling (1999), Global seawater oxygen-18 database, 658
http://data.giss.nasa.gov/o18data/, Goddard Institute for Space Studies, New York. 659
Schöne, B. R. (2008), The curse of physiology—challenges and opportunities in the 660
interpretation of geochemical data from mollusk shells, Geo-Marine Lett., 28, 269-285. 661
Schöne, B. R., W. Oschmann, J. Rössler, A. D. Freyre Castro, S. D. Houk, I. Kröncke, W. 662
Dreyer, R. Janssen, H. Rumohr, and E. Dunca (2003), North Atlantic Oscillation 663
dynamics recorded in shells of a long-lived bivalve mollusk, Geology, 31, 1037-1040. 664
Schöne, B. R., A. D. Freyre Castro, J. Fiebig, S. D. Houk, W. Oschmann, and I. Kröncke 665
(2004), Sea surface water temperatures over the period 1884–1983 reconstructed from 666
oxygen isotope ratios of a bivalve mollusk shell (Arctica islandica, southern North Sea), 667
Palaeogeogr. Palaeoclimatol. Palaeoecol., 212, 215-232.
668
Schöne, B. R., S. D. Houk, A. D. Freyre Castro, J. Fiebig, W. Oschmann, I. Kröncke, W. 669
Dreyer, and F. Gosselck (2005a), Daily growth rates in shells of Arctica islandica: 670
Assessing sub-seasonal environmental controls on a long-lived bivalve mollusk, 671
Palaios, 20, 78-92.
672
Schöne, B. R., J. Fiebig, M. Pfeiffer, R. Gleß, J. Hickson, A. L. A. Johnson, W. Dreyer, and 673
W. Oschmann (2005b), Climate records from a bivalved Methuselah (Arctica islandica, 674
Mollusca; Iceland), Palaeogeogr. Palaeoclimatol. Palaeoecol., 228, 130-148. 675
Schöne, B. R., M. Pfeiffer, T. Pohlmann, and F. Siegismund (2005c), A seasonally resolved 676
bottom-water temperature record for the period AD 1866-2002 based on shells of 677
Arctica islandica (Mollusca, North Sea), Int. J. Climatol., 25, 947-962.
678
Schöne, B. R., E. Dunca, J. Fiebig, and M. Pfeiffer (2005d), Mutvei's solution: An ideal agent 679
for resolving microgrowth structures of biogenic carbonates, Palaeogeogr. 680
Palaeoclimatol. Palaeoecol., 228, 149-166.
681
Smith, S. H., D. D. Williams, and R. R. Miller (1971), Solubility of lithium carbonate at 682
elevated temperatures, J. Chem. Eng. Data, 16, 74-75. 683
Stecher III, H. A., D. E. Krantz, C. J. Lord III, G. W. Luther III, and K. W. Bock (1996), 684
Profiles of strontium and barium in Mercenaria mercenaria and Spisula solidissima 685
shells, Geochim. Cosmochim. Acta, 60, 3445-3456. 686
Stoffyn-Egli, P., and F. T. Mackenzie (1984), Mass balance of dissolved lithium in the 687
oceans, Geochim. Cosmochim. Acta, 48, 859-872. 688
Thébault, J., L. Chauvaud, J. Clavier, J. Guarini, R. B. Dunbar, R. Fichez, D. A. Mucciarone, 689
and E. Morize (2007), Reconstruction of seasonal temperature variability in the tropical 690
Pacific Ocean from the shell of the scallop, Comptopallium radula. Geochim. 691
Cosmochim. Acta, 71, 918-928.
692
Thébault, J., L. Chauvaud, S. L’Helguen, J. Clavier, A. Barats, S. Jacquet, C. Pécheyran, and 693
D. Amouroux (2009), Barium and molybdenum records in bivalve shells: geochemical 694
proxies for phytoplankton dynamics in coastal environments?, Limnol. Oceanogr., 54, 695
1002-1014. 696
Thorarinsdóttir, G. G. (2000), Annual gametogenic cycle in ocean quahog, Arctica islandica 697
from north-western Iceland, J. Mar. Biol. Assoc. U. K., 80, 661-666. 698
Thorarinsdóttir, G. G., and L. D. Jacobson (2005), Fishery biology and biological reference 699
points for management of ocean quahogs (Arctica islandica) off Iceland, Fish. Res., 75, 700
97-106. 701
Toland, H., B. Perkins, N. Pearce, F. Keenan, and M. J. Leng (2000), A study of 702
sclerochronology by laser ablation ICP-MS, J. Anal. At. Spectrom., 15, 1143-1148. 703
Van Achterbergh, E., C. G. Ryan, S. E. Jackson, and W. L. Griffin (2001), Data reduction 704
software for LA-ICP-MS, in Laser ablation-ICPMS in the earth sciences: principles 705
and applications, edited by P. J. Sylvester, pp. 239-243, Mineralogical Association of
706
Canada Short Course Series 29, Ottawa. 707
Vander Putten, E., F. Dehairs, E. Keppens, and W. Baeyens (2000), High resolution 708
distribution of trace elements in the calcite shell layer of modern Mytilus edulis: 709
environmental and biological controls, Geochim. Cosmochim. Acta, 64, 997-1011. 710
Vigier, N., S. R. Gislason, K. W. Burton, R. Millot, and F. Mokadem (2009), The relationship 711
between riverine lithium isotope composition and silicate weathering rates in Iceland, 712
Earth Planet. Sci. Lett., doi: 10.1016/j.epsl.2009.08.026.
Wanamaker, A. D., J. Heinemeier, J. D. Scourse, C. A. Richardson, P. G. Butler, J. Eiríksson, 714
and K. L. Knudsen (2008a), Very-long lived molluscs confirm 17th century AD tephra-715
based radiocarbon reservoir ages for north Icelandic shelf waters, Radiocarbon, 50, 399-716
412. 717
Wanamaker, A. D., K. J. Kreutz, B. R. Schöne, N. Pettigrew, H. W. Borns, D. S. Introne, D. 718
Belknap, K. A. Maasch, and S. Feindel (2008b), Coupled North Atlantic slope water 719
forcing on Gulf of Maine temperatures over the past millennium, Clim. Dyn., 31, 183-720
194. 721
Wefer, G., W. H. Berger, J. Bijma, and G. Fischer (1999), Clues to ocean history: a brief 722
overview of proxies, in Use of proxies in paleoceanography: examples from the South 723
Atlantic, edited by G. Fischer and G. Wefer, pp. 1-68, Springer-Verlag, Berlin.
724
Weidman, C. R., G. A. Jones, and K. C. Lohmann (1994), The long-lived mollusc Arctica 725
islandica: A new paleoceanographic tool for the reconstruction of bottom temperatures
726
for the continental shelves of the northern North Atlantic Ocean, J. Geophys. Res., 99, 727
18305-18314. 728
Witbaard, R. (1997), Tree of the sea: The use of the internal growth lines in the shell of 729
Arctica islandica (Bivalvia, Mollusca) for the retrospective assessment of marine
730
environmental change, Ph.D. thesis, 157 pp., Rijksuniversiteit Groningen, 30 May. 731
TABLES
733 734
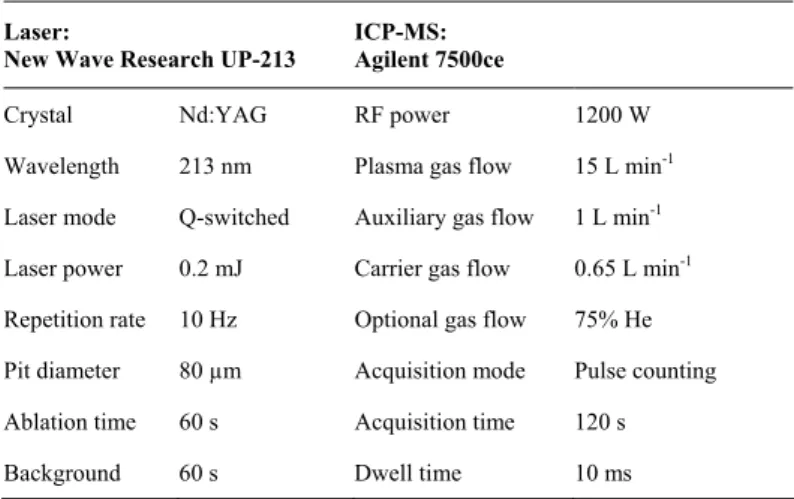
Table 1. LA-ICP-MS operating conditions. 735
736
Laser:
New Wave Research UP-213 ICP-MS: Agilent 7500ce
Crystal Nd:YAG RF power 1200 W Wavelength 213 nm Plasma gas flow 15 L min-1
Laser mode Q-switched Auxiliary gas flow 1 L min-1
Laser power 0.2 mJ Carrier gas flow 0.65 L min-1
Repetition rate 10 Hz Optional gas flow 75% He Pit diameter 80 µm Acquisition mode Pulse counting Ablation time 60 s Acquisition time 120 s Background 60 s Dwell time 10 ms
Table 2. Annual amplitudes of δ18Oshell and Tδ18O of specimens A55 and A56 over the period
738
2002-2006. Tδ18O were calculated using Eq. (1) using a mean δ18Owater value of – 0.55 ‰. The
739
uncertainty in temperature reconstruction from δ18Oshell is ± 0.95 °C.
740 741
δ18O
shell (‰VPDB) Tδ18O (± 0.95°C)
Year Shell
Min. Max. Min. Max. A55 2.12 3.51 1.8 7.8 2002 A56 2.08 3.23 3.0 8.0 A55 2.06 3.29 2.8 8.1 2003 A56 1.93 2.92 4.4 8.7 A55 2.15 3.46 2.0 7.7 2004 A56 1.73 3.21 3.1 9.5 A55 1.64 3.05 3.8 9.9 2005 A56 1.96 3.45 2.1 8.5 A55 - 2.92 4.4 - 2006 A56 - 2.98 4.1 - 742
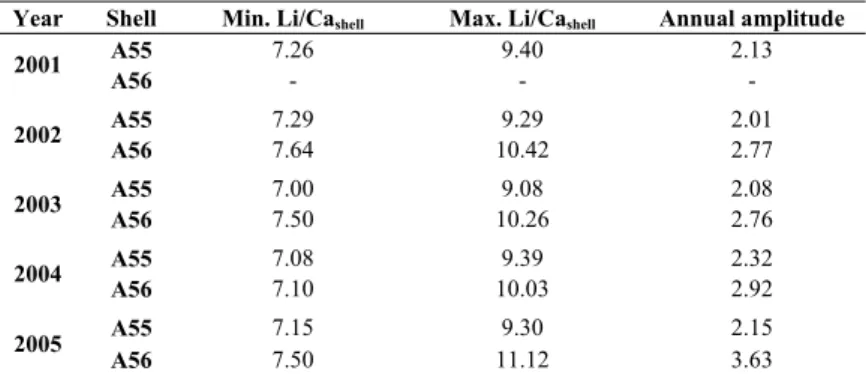
Table 3. Annual minima, maxima, and amplitude of Li/Cashell values of specimens A55 and
743
A56 over the period 2001-2005. 744
745
Year Shell Min. Li/Cashell Max. Li/Cashell Annual amplitude
A55 7.26 9.40 2.13 2001 A56 - - - A55 7.29 9.29 2.01 2002 A56 7.64 10.42 2.77 A55 7.00 9.08 2.08 2003 A56 7.50 10.26 2.76 A55 7.08 9.39 2.32 2004 A56 7.10 10.03 2.92 A55 7.15 9.30 2.15 2005 A56 7.50 11.12 3.63 746 747 748