978-1-5090-4947-9/16/$31.00 ©2016 IEEE
Accurate measurement of Aluminum layer thickness
in a multilayer material using eddy current sensor
Islam Nacereddine El Ghoul
LGEB Laboratory. Biskra University Biskra, Algeria [email protected]
Ahmed Cheriet
LGEB Laboratory. Biskra University Biskra, Algeria [email protected] Samir Bensaid LM2DLab., Bouira University Bouira, Algeria [email protected]
Ala Eddine Lakhdari
LGEB Laboratory. Biskra University Biskra, Algeria [email protected]
Abstract—This paper presents an eddy current sensor based system that allows thickness measurement of an Aluminum layer in multilayer material. An electromagnetic analytical model is used to give the relationship between the response of the eddy current sensor and the Aluminum layer thickness for different frequencies, and then looking for the optimal working frequency according to a given criterion. The measurement system is performed and controlled by a Labview application in which the analytical relationship is integrated. Some experimental samples of multilayer material containing an Aluminum layer with different thicknesses are used to verify the measurement system. A good accuracy and agreement is observed between the measured thicknesses and the exact thickness of the samples.
Keywords— EC-NDE; EC sensor; Thickness measurement;
conductive coating; multilayer material.
I. INTRODUCTION
Different protective coatings or surface treatments are used to improve the behaviour of steel. This coating acts as a physical barrier which isolates the steel from the exterior environment. Unprotected steel is used only in a dry environment and not corrosive, therefore to use the steel outside this environment various solutions such as Aluminium metallic coating can be used [1-4]. Thickness measurement and controlling of the Aluminium coating are necessary for the steel fabrication. As well, in the manufacture and maintenance of industrial metal pieces, it is very important to make the control and the measurement of their geometrical properties [5]. Eddy current based methods which are widely used in non-destructive testing of conductive materials [6]; can be also used as an alternative method for thickness measurement [7-10]. The main advantages of eddy current methods are the low cost and the robustness [11-13]. According to the penetration depth equation, we can understand that the penetration of eddy current in the material is relative to geometrical, electric and magnetic proprieties and the working frequency as:
μσ π δ f 1 = (1) δ is the depth of penetration, f is the eddy current frequency, μ is the magnetic permeability and σ is the electric conductivity of the material.
On the other hand, in real conditions, there are a lot of parameters that affect the eddy current distribution in the material under test such as the eddy current sensor dimensions, material thickness, and the gap between the sensor and the material so-called lift-off [5]. If one or more of these parameters change, the response of the eddy current sensor changes. By using an appropriate processing of the sensor response a lot of material properties can be evaluated such as its thickness. Labview program is a very comfortable and a simply design environment for the data acquisition, processing and visualisation [14, 15]. In this paper an eddy current sensor based system that allows thickness measurement of an Aluminium layer in multilayer steel material is performed. For that, the relationship between the eddy current sensor response and the Aluminium layer thickness is given by the electromagnetic analytical model of Dodd and Deeds [16, 17]. The measurement setup is controlled by a Labview application in which the given relationship is integrated. A series of multilayer material containing Aluminium layer with different thicknesses ranging from 0.03 mm to 0.18 mm are prepared as experimental samples and then measured.
II. ELECTROMAGNETIC ANALYTICAL MODEL The corresponding problem (Fig. 1) is an eddy current sensor placed above the material made of two layers; the first one is an Aluminium layer while the second one is a steel layer. The EC sensor is made with 407 turns, with outer diameter (Do) of
19.4 mm, inner diameter (Di) of 10 mm, height (h) of 4 mm.
The lift-off is about 0.1 mm. Table I show the geometrical and physical proprieties of the material.
TABLE I. PHYSICAL AND GEOMETRICAL PROPRIETIES OFMATERIAL. Layer Electric conductivity [MS/m] Relative magnetic permeability Thickness [mm] 1st Layer (Aluminium) 35.5 1 From 0.03 to 0.18 2nd layer (steel) 4.2 50 5
The electromagnetic analytical solution of the corresponding problem is given by Dodd and Deeds formulation. The normalized resistance and reactance of the sensor given by equations (2) and (3) are calculated for various Aluminium layer thicknesses and different frequencies (Fig. 2).
0 X c X n X = (2) 0 0 X R c R n R = − (3) Rn and Xn are respectively the normalized resistance and
normalized reactance .Rc and Xc are respectively the resistance
and reactance of the eddy current sensor.X0 is the sensor
reactance deprived of the material.
(a)
(b)
Fig. 2. Normalized resistance and reactance of the eddy current sensor (a) normalized resistance, (b) normalized reactance.
The purpose here is to find the optimal working frequencyf0that satisfy the following two criterion; a good
sensitivity of the sensor and a best linear relationship between Rn or Xn and the Aluminum layer thickness. Accordingly, we
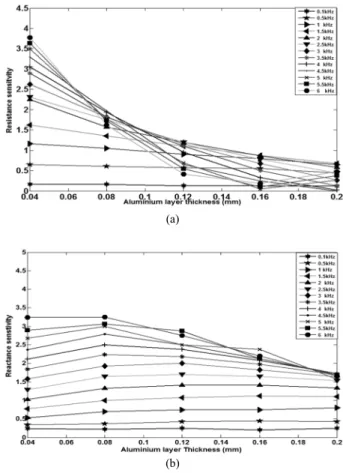
calculate both resistance and reactance sensitivities which are given by the ratio between the reactance or resistance differences of two successive calculations and the difference of the corresponding Aluminum layer thicknesses as:
e n G S Δ Δ = (4) Gncan be the normalized resistance Rn or the normalized
reactance Xn and e is the Aluminium layer thickness. The
resistance and reactance sensitivities vs. the Aluminium layer thickness for different frequencies are shown in Fig. 3.
(a)
(b)
Fig. 3. Resistance and reactance sensitivities vs. Aluminium layer thickness for different frequencies
(a) resistance sensitivity, (b) reactance sensitivity.
Let us taking the sensitivity threshold Sth=1, and consider
only frequencies having sensitivity greater than Sth. It is well
observed that the resistance has a poor sensitivity according to the selected sensitivity threshold, especially for Aluminum layer thicknesses greater than 0.16 mm (Fig.3.a). However, for frequencies greater than 2 kHz good reactance sensitivity is observed (Fig.3.b). Thereafter only the reactance is taken into account and that for frequencies greater than 2 kHz so fo>
2kHz. Now, let us consider the second criterion; looking for the best linear relationship between the normalized reactance
Xn and the Aluminum layer thickness and that for frequencies
fo> 2 kHz. Thus, let us approximate the curves shown in Fig.
2.b by a set of linear equations as: b e a + = . n Xˆ (5) n
Xˆ is a linear approximation of Xn. As a result, a set of
equations similar to (5) are formulated and that for frequencies greater than 2 kHz. The coefficients a and b are given by using the beginning and ending points of curves as:
2 1 2 1 n X n X e e a − − = (6) 1 1 b=e −aXn (7) Where (e1, Xn1) corresponds to the beginning point and (e2,
Xn2) corresponds to the ending point (Fig. 2.b). For example,
for the frequency 6 kHz, (e1, Xn1) equal to (0 mm, 1.3) and (e2,
Xn2) equal to (0.2 mm, 0.8). e1=0 mm signify that the material
is free from the Aluminium layer. Let us define the linearity indicator Lind as follows:
% 1 ( ) ) ( ˆ ) ( 100 = − = m k Xn k k n X k n X m ind L (8)
In (8) m is the number of the computed points for each frequency i.e.m=6. For example the linearity indicator for 6 kHz is Lind= 3%. In the fact Lind corresponds to the error of the
linear approximation given by equation (5). By the way, a best linear relationshipcorresponds to the minimum Lind which is
observed for 3 kHz (Fig. 4). Accordingly, the looking-for optimal working frequency is fo =3 kHz that allow a good
linear approximation with Lind = 0.02%.
Fig. 4. Linearity indicator Lind for f> 2 kHz
From the previous, the appropriate working frequency is 3 kHz, and so, its corresponding linear approximation will be integrated afterward in the Labview application of the experimental setup.
III. EXPERIMENTAL SETUP
The experimental setup is realized with three main components: the eddy current sensor, the RLC-meter and the
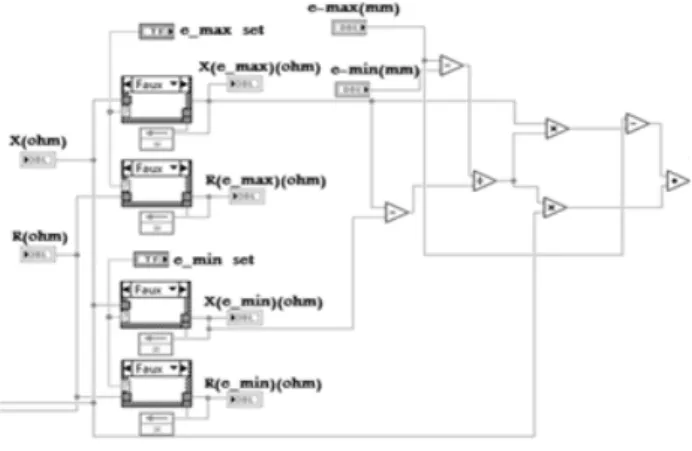
laptop in which the Labview application is developed. These components are connected as shown in Fig. 5. Note that the working frequency is 3 kHz and its corresponding linear equation (5) is integrated in the Labview application (Fig.6).The Labview application is developed within two steps:
• Creation of a Labview RS232 driver for the RLC-meter instrument.
• Development of the Labview Block diagram and its corresponding front panel.
Fig. 5. Aluminium layer thickness measurement in multilayer steel material, the experimental setup
Fig. 6. Labview block diagram of equation (5)
The measurement of the Aluminium layer thickness is carried out as follows; once the eddy current sensor placed above the multilayer material, both resistance and reactance are displayed in the Labview application front-panel (Fig. 7), as well as the Aluminium layer thickness.
Fig. 7. Front-panel of the developed Labview application
IV. RESULTS
Some experimental samples of multilayer materials containing Aluminium layer with different thicknesses ranging from 0.03 mm to 0.18 mm are prepared. Table II and Fig. 8 give the exact known thicknesses and those measured by using the realized experimental setup.
TABLE II. Aluminium thickness measurement Exact thickness [mm] Measured thickness [mm] Relative error [%] Average error [%] 0.03 0.0299 0.33 0.54 0.06 0.0604 0.67 0.09 0.0904 0.44 0.12 0.1204 0.33 0.15 0.1511 0.73 0.18 0.1813 0.72
Fig. 8. Relative error of the measurement
These results confirm a good accuracy of the measurements carried out with the experimental setup; note that the maximum relative error doesn’t exceed 1%.
V. CONCLUSION
In this paper, an eddy current sensor based system is realized for Aluminium layer thickness measurement in multilayer material. The relationship between the sensor reactance and the Aluminium layer thickness has been obtained by the electromagnetic analytical model of Dodd and Deeds, and followed by implemented in the developed Labview application. The optimal working frequency is selected according to the sensitivity and the relationship linearity of the sensor. Some experimental samples of multilayer material containing Aluminium layer with different thicknesses are prepared and measured. The measured thicknesses compared
to exact ones, show the good accuracy of the experimental setup where the maximum relative error doesn’t exceed 1%.
REFERENCES
[1] S. Guo, Z. B. Wang, and K. Lu, “An Aluminide Surface Layer Containing Al on Ferritic-Martensitic Steel Formed by Lower-Temperature Aluminization,” Journal of Materials Science and Technology, vol. 31, no. 12, pp. 1268–1273, 2015.
[2] C. H. Jensen, R. E. Demuth, and R. W. Mowery, “The Electrical Properties of Single-Layer Aluminum Conductors, Steel Reinforced (ACSR), Having Single Steel Core Wires with Heavy Aluminum Coating,” Transactions of the American Institute of Electrical Engineers. Part III: Power Apparatus and Systems, vol. 81, no. 3, pp. 27–32, 1962. [3] F. Pedraza, C. Gomez, M. C. Carpintero, M. P. Hierro, and F. J. Pérez,
“On the aluminisation of stainless steel by CVD in fluidised beds,” Surface and Coatings Technology, vol. 190, no. 2–3, pp. 223–230, 2005. [4] Z. D. Xiang and P. K. Datta, “Relationship between pack chemistry and
aluminide coating formation for low-temperature aluminisation of alloy steels,” Acta Materialia, vol. 54, no. 17, pp. 4453–4463, 2006.
[5] L. Janoušek, “Impact of selected parameters on eddy current attenuation in conductive materials,” in Proceedings of 9th International Conference, ELEKTRO 2012, 2012, pp. 419–422.
[6] A. Cheriet, M. Feliachi, and S. M. Mimoune, “3D movement simulation technique in FVM method application to eddy current non destructive testing,” Compel, vol. 28, no. 1, pp. 77–84, 2009.
[7] Z. Qu, Q. Zhao, and Y. Meng, “Improvement of sensitivity of eddy current sensors for nano-scale thickness measurement of Cu films,” NDT and E International, vol. 61, pp. 53–57, 2014.
[8] C. Vargas-Estevez, R. R. Robaina, R. P. D. Real, and J. A. Plaza, “Nanometric Metal-Film Thickness Measurement Based on a Planar Spiral Coils Stack,” IEEE Transactions on Nanotechnology, vol. 14, no. 2, pp. 297–303, 2015.
[9] W. Cheng and I. Komura, “Simulation of Transient Eddy-Current Measurement for the Characterization of Depth and Conductivity of a Conductive Plate,” IEEE Transactions on Magnetics, vol. 44, no. 11, pp. 3281–3284, 2008.
[10] W. Yin and A. Peyton, “Thickness measurement of non-magnetic plates using multi-frequency eddy current sensors,” NDT & E International, vol. 40, no. 1, pp. 43–48, 2007.
[11] H. Wang, W. Li, and Z. Feng, “Noncontact Thickness Measurement of Metal Films Using Eddy-Current Sensors Immune to Distance Variation,” IEEE Transactions on Instrumentation and Measurement, vol. 64, no. 9, pp. 2557–2564, 2015.
[12] F. Röper, “High-frequency eddy current method for the thickness measurement of thin metallic foils using ferrite-core transmission systems,” NDT and E International, vol. 33, no. 3, pp. 163–172, 2000. [13] Y. K. Shin, D. M. Choi, Y. J. Kim, and S. S. Lee, “Signal characteristics
of differential-pulsed eddy current sensors in the evaluation of plate thickness,” NDT and E International, vol. 42, no. 3, pp. 215–221, 2009. [14] J. Ding, T. Qian, and T. Qian, “The Reconstruction of Crack in Surface
Based on Virtual Instrument,” 2009 International Conference on Information Engineering and Computer Science, 2009.
[15] Z. Wang, Y. Shang, J. Liu, and X. Wu, “A LabVIEW based automatic test system for sieving chips,” Measurement, vol. 46, no. 1, pp. 402–410, 2013.
[16] T. Theodoulidis and E. Kriezis, “Series expansions in eddy current nondestructive evaluation models,” in Journal of Materials Processing Technology, 2005, vol. 161, no. 1–2 SPEC. ISS., pp. 343–347.
[17] C. V. Dodd and W. E. Deeds, “Analytical solutions to eddy-current probe-coil problems,” Journal of Applied Physics, vol. 39, no. 6, pp. 2829–2838, 1968.

![TABLE II. Aluminium thickness measurement Exact thickness [mm] Measured thickness [mm] Relative error [%] Average error [%] 0.03 0.0299 0.33 0.54 0.06 0.0604 0.67 0.09 0.0904 0.44 0.12 0.1204 0.33 0.15 0.1511 0.73 0.18 0.1813 0.72](https://thumb-eu.123doks.com/thumbv2/123doknet/13791828.440491/4.892.48.442.455.764/aluminium-thickness-measurement-thickness-measured-thickness-relative-average.webp)
