HAL Id: inserm-00348223
https://www.hal.inserm.fr/inserm-00348223
Submitted on 15 Mar 2013HAL is a multi-disciplinary open access archive for the deposit and dissemination of sci-entific research documents, whether they are pub-lished or not. The documents may come from teaching and research institutions in France or abroad, or from public or private research centers.
L’archive ouverte pluridisciplinaire HAL, est destinée au dépôt et à la diffusion de documents scientifiques de niveau recherche, publiés ou non, émanant des établissements d’enseignement et de recherche français ou étrangers, des laboratoires publics ou privés.
Population pharmacokinetics of emtricitabine in human
immunodeficiency virus type 1-infected pregnant women
and their neonates.
Déborah Hirt, Saik Urien, Elisabeth Rey, Elise Arrivé, Didier Ekouévi, Patrick
Coffié, Sim Kruy Leang, Sarita Lalsab, Divine Avit, Eric Nerrienet, et al.
To cite this version:
Déborah Hirt, Saik Urien, Elisabeth Rey, Elise Arrivé, Didier Ekouévi, et al.. Population pharmacoki-netics of emtricitabine in human immunodeficiency virus type 1-infected pregnant women and their neonates.. Antimicrobial Agents and Chemotherapy, American Society for Microbiology, 2009, 53 (3), pp.1067-73. �10.1128/AAC.00860-08�. �inserm-00348223�
Population Pharmacokinetics of Emtricitabine in HIV-1 infected Pregnant Women and their neonates (ANRS 12109).
Déborah Hirt* a, b, Saik Urien a, b, Elisabeth Rey c , Elise Arrivé d, Didier K. Ekouévi e, Patrick
Coffié e, Sim Kruy Leang f , Sarita Lalsab g, Divine Avit e, Eric Nerrienet h, James McIntyre g,
Stéphane Blanche i, François Dabis d, Jean-Marc Tréluyer a, b, c.
a
EA3620, Université Paris - Descartes, France, b Unité de Recherche clinique, AP-HP,
Hôpital Tarnier, Paris, France, c Service de Pharmacologie Clinique, AP-HP, Hôpital
Cochin-Saint-Vincent-de-Paul, Université Paris – Descartes, France, d INSERM U897, ISPED,
Université Victor Segalen, Bordeaux, France , e Programme PAC-CI, ANRS Abidjan, Côte
d’Ivoire, f Service Gynécologie-obstétrique de l’Hôpital Calmette, Phnom Penh, Cambodia, g
Perinatal HIV Research Unit (PHRU), University of the Witwatersrand, Chris Hani Baragwanath Hospital, Johannesburg, South Africa, h Institut Pasteur du Cambodge, Phnom
Penh, Cambodia, i Service d’Immunologie et Hématologie Pédiatrique, Hôpital Necker
Enfants Malades, Université Paris-Descartes, Paris, France
Short title: Mother - neonate emtricitabine pharmacokinetics
Corresponding author: Déborah Hirt
Unité de Recherche Clinique, Hôpital Tarnier, 89 rue d’Assas, 75006 Paris,
deborah.hirt@univ-paris5.fr, tel : +33158412884 Fax : +33158411183
Abstract: 250 words, Manuscript: 3367 words
Number of figures: 4, Number of tables: 4, Number of references: 18
Key words: Population pharmacokinetics, Prevention of Mother-to-child transmission of
Abstract.
1
Objectives: To evaluate emtricitabine (FTC) pharmacokinetics (PK) in pregnant women and 2
their neonates and to determine the optimal prophylactic dose for neonates after birth to 3
prevent mother-to-child transmission of HIV (PMTCT). 4
Methods: 38 HIV-infected pregnant women were administered Tenofovir Disoproxyl 5
Fumarate (TDF, 300mg)- emtricitabine (FTC, 200mg) tablets: 2 at the initiation of labour and 6
1 daily for 7 days postpartum. By pair, 11 maternal, 1 cord blood and 2 neonatal FTC 7
concentrations were measured using an HPLC MS MS validated method and analyzed by a 8
population approach. 9
Results: Model and mean estimates (inter-patient variability) were a 2-compartment model for 10
mother with absorption rate constant 0.54 h-1 (61%), apparent elimination and 11
intercompartmental clearance 23.2 (17%) and 6.04 L.h-1 and apparent central and peripheral 12
volume 127 and 237L; an effect compartment linked to maternal circulation for cord and a 13
neonatal compartment disconnected, after delivery, with a 10.6 hours half life (30%). After 14
the 400 mg FTC administration, median population AUC, Cmax and Cmin in pregnant women
15
were 14.3 mg.L-1.h, 1.68 and 0.076 mg/L respectively. At delivery, median (range) FTC 16
predicted maternal and cord concentrations were respectively 1.16 (0.14–1.99) and 0.72 17
(0.05–1.19) mg.L-1. 18
Conclusion: The 400 mg FTC administration in pregnant women produces higher exposition 19
than the 200 mg administration to adults, at steady state. FTC was shown to have good 20
placental transfer (80%). Administering FTC 1 mg/kg as soon as possible after birth or 2 21
mg/kg 12 hours after birth should produce neonatal concentrations comparable to those 22
observed in adults. 23
Introduction
24
To prevent mother-to-child transmission of HIV around the delivery, a single-dose 25
administration of nevirapine (sdNVP) administered at start of labour is the most common 26
antiretroviral regimen used in resource-limited settings, as recommended by the World Health 27
Organization in the antiretroviral drugs for treating pregnant women and preventing HIV 28
infection in infants report (http://www.who.int/hiv/pub/guidelines/pmtctguidelines3.pdf). 29
However, the use of sdNVP results in resistance mutations in 15 to 70% of women, at 4 to 6 30
weeks postpartum, compromising the success of subsequent treatments with NVP in mother 31
and child (7, 9). A recent clinical study suggests that adding a single dose of TDF and FTC at 32
delivery may reduce those resistances by half (6). 33
Emtricitabine is a potent, once daily (QD) nucleoside reverse transcriptase inhibitor approved 34
for the treatment of human immunodeficiency virus (HIV) in adults and children older than 3 35
months in combination with other antiretroviral agents. The physiological changes associated 36
with pregnancy can lead to significant variations in pharmacokinetics (10, 12, 14). However, 37
few pharmacokinetic data on emtricitabine in pregnant women (3) and no data on placental 38
transfer are available. Only one study reports pharmacokinetic of emtricitabine in neonates 39
exposed to HIV in utero; apparent elimination clearance was 13 mL/min in 5 to 21 days-old 40
neonates and 22 mL/min in 23 to 42 days-old neonates (5). This suggests that the youngest 41
neonates have the lowest elimination clearance. The neonatal pharmacokinetics just after birth 42
is still unknown. 43
In the present work, a population pharmacokinetic study was performed on mother, cord and 44
neonatal plasma samples in order i) to describe the concentration-time courses of FTC in 45
mothers, the transfer of FTC from maternal plasma to cord plasma and the neonatal 46
elimination, ii) to study the influence of covariates (such maternal bodyweight, gestational 47
age, type of delivery, maternal creatinine, neonatal bodyweight, height and body surface area) 48
on FTC pharmacokinetics and iii) to model various dosing strategies to determine optimal
49
dosing scheme for newborn.
50 51 Methods 52 53 Patients. 54
The TEmAA (Tenofovir/Emtricitabine in Africa and Asia) - ANRS 12-109 study was an 55
open, phase I/II trial evaluating the pharmacokinetics, the safety and toxicity of the 56
Tenofovir-Emtricitabine combination in HIV infected pregnant women and their neonates. 57
This trial was conducted in Abidjan, Côte d’Ivoire, Phnom Penh, Cambodia and Soweto, 58
South Africa. Pregnant women (between 28 and 38 weeks of gestation), older than 18 years, 59
infected by HIV-1 or HIV-2, naïve to all antiretroviral treatment, who had an indication for 60
antiretroviral prophylaxis for Prevention of Mother-To-Child-Transmission (PMTCT) during 61
pregnancy (in line with international or national recommendations: WHO’s clinical stage 1, 2 62
and CD4≥200/mm3 or stage 3 and CD4≥350/mm3) were eligible. Neonates with a gestational
63
age greater than 32 weeks and a birth weight greater than 2000 grams were eligible. This
64
study protocol was approved by the national ethics committees of Côte d’Ivoire, South Africa 65
and Cambodia and by each country health authorities. The mother and the father of the child 66
to be born provided signed informed-consent. 67
68
Treatments
69
Mothers were administered ZDV (300 mg twice a day) from enrolment to delivery date, one 70
tablet of NVP (200 mg) and two tablets of TDF (300 mg)-FTC (200 mg) at start of labour, 71
and one tablet of TDF (300 mg)-FTC (200 mg) per day during 7 days at postpartum. Children 72
were given NVP syrup (2 mg/kg) as a single-dose on the first day of life and ZDV syrup (4 73
mg/kg every 12 hours during 7 days). 74
75
Sampling
76
All women received FTC and underwent blood samplings for pharmacokinetic analysis: at 77
delivery, 1, 2, 3, 5, 8, 12 and 24 hours after the administration of FTC 400 mg and before the 78
2nd , 3rd and 7th administration of FTC 200 mg. A cord blood sample was obtained at delivery, 79
the neonate had sampling on days 1 and 2 of life. Time elapsed between administrations and 80
sampling time, maternal, fetal bodyweight and gestational age were recorded. 81
82
Analytical method
83
The emtricitabine essay was performed according to the previously published method (11) 84
with a limit of quantification (LOQ), intra- and inter-assay precision of 0.01 mg/L, 3.6 % and 85
7.9 %. The biais between observed and theoretical concentration range from 0.7 to 14.9 %. 86
87
Modeling strategy and population pharmacokinetic model.
88
Data were analyzed using the nonlinear mixed effect modeling software program NONMEM 89
(version VI, level 1.0) with the DIGITAL FORTRAN compiler (2). The first-order 90
conditional estimation (FOCE) with interaction method was used. A 2-compartment model 91
with first order absorption and elimination best described maternal data. For cord 92
concentrations, an “effect” compartment model of negligible volume and negligible drug 93
accumulation linked to the maternal circulation was used. The effect compartment is modeled 94
as a virtual compartment linked to the maternal plasma compartment by a first-order process 95
which does not modify the compartmental model in the mother. After delivery, this fetal 96
compartment is disconnected, time is reset to zero and the neonate has his own elimination 97
(Fig 1). Parameters of the model were the absorption rate constant (ka), maternal elimination
98
clearance from the central compartment (CL), volume of the central maternal compartment 99
(V1), maternal intercompartmental clearance (Q2), volume of the peripheral maternal
100
compartment (V2), maternal to fetal rate constant (k1F), fetal to maternal rate constant (kF1)
101
and neonate elimination rate constant (kFO). Since emtricitabine was orally administered, only
102
ka, CL/F, V1/F, Q2/F, V2/F, k1F, kF1 and kFO were identifiable, where F is the unknown
103
bioavailability. Analytical equations were used in a $PRED section in NONMEM to estimate 104
these pharmacokinetic parameters. When FTC concentrations were below the LOQ, we set 105
them to half of the LOQ. Several error models were investigated (i.e. multiplicative and 106
additive error models) to describe residual variability. Exponential model was used for inter-107
subject variability (ISV). Only significant ISVs on pharmacokinetic were kept. The effect of 108
each patient covariate was systematically tested via generalized additive modeling on the 109
basic model. Continuous covariates (CO), as bodyweight, gestational age, creatinine, height 110
and body surface area were tested according to the following equation, using CL for example, 111 CL CO β CL ) median(CO) CO ( θ
CL= × , where θCL is the typical value of clearance for a patient with
112
the median covariate value and CL CO
β is the estimated influential factor for the continuous 113
covariate. When a covariate was missing, it was set to the median value from all the other 114
women. Categorical covariates (CA =0 or 1) were tested according to 115 CA) β (1 θ CL CL CA CL× + ×
= for inducing effect or CL θ /(1 βCL CA)
CA CL + ×
= for inhibitory
116
effect. The type of delivery (TD) was tested according to CL=θCL ×(1+βCLTD×TD×DEL), 117
where DEL = 1 before delivery and DEL = 0 after delivery. A covariate was kept if its effect 118
was biologically plausible; it produced a minimum reduction of 6.63 in the objective function 119
value (OFV) and a reduction in the variability of the pharmacokinetic parameter, assessed by 120
the associated inter-subject variability. An intermediate model with all significant covariates 121
was obtained. A backward elimination phase was finally performed by deleting each covariate 122
from the intermediate model, to obtain the final model, using a likelihood ratio test. 123
124
Evaluation and validation
125
For evaluation of the goodness-of-fit, the following graphs were performed: observed and 126
predicted concentrations versus time, observed concentrations vs population predictions, 127
weighted residuals vs time and weighted residuals vs predictions. Similar graphs using 128
individual predictive POSTHOC estimation were displayed. The diagnostic graphs were 129
performed using RfN (S. Urien, RFN-831-20070911,
130
https://sourceforge.net/project/showfiles.php?group_id=29501&package_id=140129&release 131
_id=538680) with the R program (8). 132
Emtricitabine concentration profiles were simulated and compared with the observed data 133
thanks to visual predictive check in order to validate the model. More precisely, the vector of 134
pharmacokinetic parameters from 1000 patients was simulated using the final model. Each 135
vector parameter was drawn in a log-normal distribution with a variance corresponding to the 136
ISV previously estimated. A simulated residual error was added to each simulated 137
concentration. The simulations were performed using NONMEM. The 5th, 50th and 95th 138
percentiles of the simulated concentrations at each time were then overlaid on the observed 139
concentration data using the R program and a visual inspection was performed. 140
141
Maternal concentrations after 400 mg FTC administration to the mother before delivery and
142
placental transfer.
143
After the 400 mg administration to each pregnant woman, FTC minimal (Cmin) and maximal
144
(Cmax) plasma concentration and area under the concentration curve (AUC) were derived from
145
the estimated individual pharmacokinetic parameters. Median values and ranges were 146
calculated and compared to data from adults, in literature. At delivery cord (i.e. fetal) and 147
maternal plasma concentrations were determined. The ratio between fetal and maternal 148
concentrations was calculated and its variation as a function of the delay between drug uptake 149
and delivery was followed. In order to better evaluate placental transfer, for a 400 mg dose 150
administered to the mother, maternal and neonatal areas under the curve were estimated and 151
the ratio between neonatal and maternal AUC was calculated. 152
153
Determination of the optimal dosing scheme for the newborn.
154
The optimal timing for FTC administration to the newborns was determined in order to obtain
155
a similar exposure to that observed in adults, (i.e.
(
AUC0→24h)
neonates = 10.4 mg/L.h) and to156
guarantee newborn FTC concentration above 0.077 mg/L (i.e. residual adult concentration), 157
before the administration to the neonate and as long as possible after administration to the 158
neonate. The target minimal concentration of 0.077 mg/L corresponds to the mean minimal
159
concentration for FTC 200 mg QD in adults from 3 previous studies (0.071 mg/L for Zhong et
160
al. (18), 0.075 mg/L for Blum et al.(5) and 0.085 mg/L for Ramanathan et al. (15) study). The
161
following hypotheses were necessary: neonate has same bioavailability and absorption rate as 162
his mother and neonatal volume of distribution VF is proportional to maternal volume of
163
distribution on a bodyweight (BW) basis: VF = (V1+V2)* BWneonate/BWMother. Neonatal AUC 164
was calculated taking into account both neonatal administration and mother-to-fetus drug 165
transfer. As adults receive 200 mg doses or 3 mg/kg, a 3 mg/kg administration was simulated 166
and this dose was modified in order to obtain a neonatal AUC0−24h close to 10.4 (median
167
adults AUC after a 200 mg dose). Different administration schemes were simulated in the 168
neonates: 1, 2, 3 mg/kg, 1 hour after birth and 2 mg/kg 12 hours after birth. 169
170 171
Results
172
Demographic data
173
Data from the 38 enrolled women and 32 of their neonates were available for FTC 174
pharmacokinetic evaluation. Table 1 summarizes patients’ characteristics. 175
176
Population pharmacokinetics
177
A total of 411 maternal, 37 cord blood concentrations and 66 neonatal concentrations were 178
used for pharmacokinetic analysis. Four maternal residual FTC concentrations were excluded 179
because they were seven to 20 times higher than the three other residual concentrations in the 180
same patient. Seven FTC concentrations were lower than the LOQ, so they were set to half of 181
the LOQ (1). The available data were not sufficient to estimate inter-subject variability for 182
V1/F, Q2/F, V2/F, k1F and kF1 and fixing the variance of these random effects to zero had no
183
influence on the objective function values (OFV). Variabilities were thus estimated: for ka,
184
CL/F and kFO. All residual variabilities were best described by a proportional error model.
185
The addition of a correlation between mother and cord residual variabilities, using a L2 item, 186
(r= 0.80 (24%)) decreased OFV by 11.8 units. The effects of maternal bodyweight, serum 187
creatinine, gestational age and type of delivery were tested on CL/F and the effects of
188
neonatal bodyweight, height, body surface area and gestational age were tested on kFO, none
189
of these effects was significant. 190
Figure 2 displays FTC observed and predicted plasma concentrations as a function of time for 191
the mother, the cord and the neonate. To better visualize neonatal concentrations, cord 192
concentrations were reported on the graph at time zero. Table 2 summarizes the final 193
population pharmacokinetic estimates. Final model performance was appreciated by 194
comparing population predicted and individual predicted to observed plasma concentrations 195
and population weighted residuals versus predicted concentrations and versus time for FTC 196 (not shown). 197 198 Validation 199
Visual predictive check of the final population pharmacokinetic model (Fig 3) showed the 5th, 200
50th and 95th predicted percentiles from the 1000 simulations and the observed concentrations 201
of emtricitabine. The visual predictive checking confirmed that the average prediction 202
matched the observed concentrations. The variability was reasonably estimated. 203
204
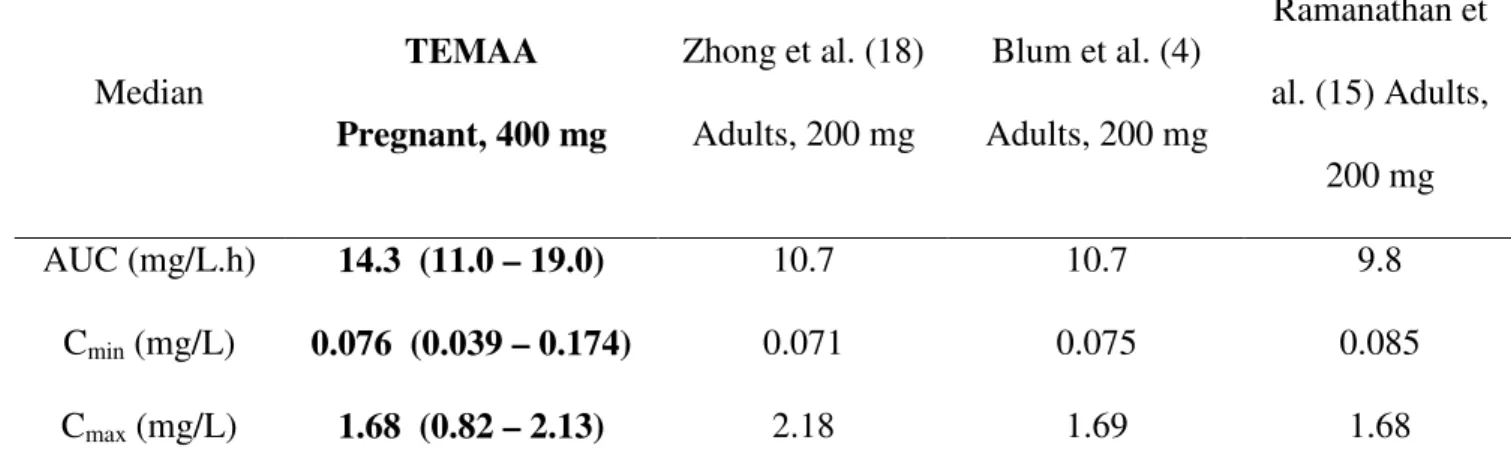
Maternal concentrations after 400 mg administration to the mother before delivery
205
Table 3 summarizes the maternal Cmin, Cmax and AUC obtained after a 400 mg administration
206
to the pregnant woman at the start of the labour, and values previously found after a 200 mg 207
administration to adults, at steady state. In the present study, total elimination clearance was 208
28 L/h for women at delivery, after a 400 mg dose whereas in previous studies, the mean 209
value was 19.3 L/h in adults after a 200 mg dose. Total elimination clearance increased by 210
45% in pregnant woman, on the day of delivery. 211
212
Placental transfer
213
Median delay between samples drawn before the first maternal FTC administration and 214
delivery was 5.1 hours (min - max: 0.6 - 20 hours). At delivery, median predicted neonatal 215
and maternal concentrations were respectively 0.72 mg/L (min – max: 0.05 - 1.19) and 1.16 216
mg/L (min – max: 0.14 - 1.99). The median predicted ratio between cord and maternal 217
concentrations at delivery was 76 % (min – max: 9 - 144), depending on the delay between 218
maternal drug administration and delivery. This range of concentration ratio at delivery 219
suggests that placental transfer depends on the delay between maternal drug intake and 220
delivery and could not be given as a simple percentage. A more representative measure of 221
placental transfer would be the ratio between neonatal and maternal FTC AUC for 24 hours. 222
Figure 4 represented maternal and neonatal concentrations as a function of time when delivery 223
occured 2, 6 or 12 hours after maternal drug intake. This figure (down) showed the neonatal-224
to-maternal AUC ratio as a function of the delay between maternal administration and labour. 225
226
Determination of the optimal timing for FTC administration to the newborns.
227
As the median predicted neonatal concentration was relatively high at delivery (0.72 mg/L), 228
with a 10.6 hours half life, this remained above 0.077 mg/L (minimal adult concentrations) 229
for at least 3 half-lives, i.e. 31.8 hours after delivery. Table 4 summarizes neonatal minimal 230
concentration before administration, AUC0→24h and the time during which neonatal
231
concentration remained over 0.077 mg/L for 1, 2 or 3 mg/kg at 1 hour after birth and 2 mg/kg 232
12 hours after birth. If emtricitabine was only administered to the mother, thanks to placental 233
transfer, it would produce a neonatal AUC0→24h of 8.2 mg/L.h. Administering, as a single 234
dose, 1 mg/kg of emtricitabine 1 hour after birth or 2 mg/kg 12 hours after birth would allow 235
the neonate to obtain same exposition as adults. These results were obtained assuming a
236
neonatal volume of distribution (VF) proportional to the maternal volume of distribution on a
237
bodyweight basis (mean VF = (V1+V2)* BWneonate / BWMother ≈ (127+237)*2.8/60.3 ≈ 16.9 L).
238
However, 1 mg/kg 1 hour after birth would produce an AUC0-24h of 9.2 mg/L.h and a
239
concentration above 0.077 mg/L during 34 h if VF was in reality twice higher than in the
240
assumption. This dose would produce an AUC0-24h of 12.0 mg/L.h and a concentration above
241
0.077 mg/L during 40.2 h if the true VF was twice lower than assumed. In both cases, even
242
with a 100% error on neonatal volume of distribution, the AUC0-24h was close to 10.4 mg/L.h.
243 244 245
Discussion
246
In the present work, emtricitabine mother and child pharmacokinetics were satisfactorily 247
described by the proposed compartmental model. The following observations support the 248
validity of this model: 249
Population predicted maternal, cord and neonatal concentrations were well correlated with 250
observed concentrations. The population model was validated thanks to the visual predictive 251
check method. 252
In pregnant women, the AUC obtained from our population model was decreased (14.3 253
mg/L.h for a 400 mg dose, i.e. 7.15 mg/L.h for a 200 mg) compared to non pregnant adult 254
value (10.7 mg/L.h for a 200 mg dose). This is in agreement with the PATCG/IMPAACT 255
P1026 study which reports, during the third trimester of pregnancy, a median AUC of 8.6 256
mg/L.h for a 200 mg dose (3). 257
As shown in table 3, despite a higher elimination clearance in pregnant women than in non 258
pregnant adults, the 400 mg emtricitabine administration before delivery produces higher 259
exposure than the 200 mg administration in others adults at steady state. Calculating 260
emtricitabine clearance as a dose to AUC ratio, we found 28.0 L/h for pregnant women (our 261
study) compared to 18.7 L/h (4, 18) and 20.4 L/h for adults (15). FTC clearance was increased 262
by 37 or 50 %. FTC is primarily excreted by the kidney by both glomerular filtration and 263
tubular secretion with 86% recovery of the dose achieved in urine, as described in the full 264
prescribing information for Truvada® (http://www.gilead.com/pdf/truvada_pi.pdf). During 265
pregnancy, renal plasma flow increases by 25 to 50% and glomerular filtration rate by 50% 266
which should have enhanced emtricitabine elimination (13). The lowest FTC clearance 267
increase in the PATCG/IMPAACT P1026 study (23.3 vs 28.0 L/h in our study) may be due 268
the sampling time during pregnancy (third trimester vs the day of delivery in our study). None 269
of the covariates tested had an effect on maternal absorption or elimination clearance. 270
No data were reported on emtricitabine placental transfer. In this study, from one sample at 271
delivery (at various times after drug administration) in each mother – cord pairs, we could 272
draw maternal and cord concentrations curves as a function of the delay and estimate inter 273
subject and residual variabilities. Placental transfer was estimated as fetal to maternal 274
exposure ratio to the drug. We found a relatively constant ratio of 80% for a delivery 275
occurring at least 4 hours after maternal drug administration. This transfer seems to be mainly 276
due to a passive diffusion of the drug through the placenta. Data about active transport are 277
missing. 278
279
Cord concentrations were relatively high (0.72 mg/L) compared to the minimal adult 280
concentrations previously reported (0.07 mg/L). This was due to both a good placental 281
transfer of the drug and a higher exposure in mothers; with 400 mg of emtricitabine at 282
delivery time, maternal exposure was higher than the exposure with 200 mg in non pregnant 283
adults. So, even if women delivered a long time after drug intake, cord concentrations should 284
remain over the adult minimal concentration. However re-administering 2 tablets of Truvada® 285
to the mother after 12 hours of labour (if she did not delivered yet, as suggested for tenofovir, 286
unpublished data) would produce reasonable emtricitabine cord concentrations (similar to 287
cord concentrations of a neonate born 5 hours after maternal first drug intake). 288
289
The emtricitabine median neonatal half life was 10.6 hours, in agreement with Blum study 290
reporting half lives of 12.5 hours in neonates from birth to 21 days, 11.5 hours for 22 to 42 291
days old infants and 11.8 hours for 43 to 90 days old children (5). Moreover these half-lives 292
are comparable to children values (9.3 to 11.7 hours for the 2 – 17 years) (17) and adults 293
values (10.5 h for Blum, 9.4h for Zhong and 8.3 h for Ramanathan) (4, 15, 18). 294
As the model was validated thanks to the visual predictive check method, it was used 295
to simulate the optimal dosage. For this, it was assumed that the child had the same absorption 296
rate and bioavailability as the mother and its volume of distribution was proportional to the 297
total maternal volume distribution on a bodyweight basis. Accordingly, in our model, the
298
mean volume of distribution was 16.9 L for a children weighting 2.7 kg at birth, which is
299
close to the volume of distribution of 14 L (t1/2=12.5 h and CL=13mL/min) found in the 18
300
children from 0 to 21 days of Blum’s study (5). Moreover, even with a 100% error on
301
neonatal volume of distribution, the AUC0-24h and the time during which the concentration
302
was above 0.077 mg/L showed a less than 20% change. The optimal single neonatal dose was
303
determined in order to obtain an exposure in neonates similar to the known exposure in adults 304
(i.e. 10.4 mg/L.h) and concentrations above the residual adult concentration (=0.077 mg/L) 305
before, and as long as possible after neonatal administration. Criteria were based on plasma 306
emtricitabine concentrations although intracellular emtricitabine triphosphate concentrations 307
would have been more appropriate to follow the pharmacologically active part of FTC. It was 308
also supposed that the enzymes of phosphorylation were matures in the neonates (16). For 309
practical reasons, we suggest that FTC should be administered to the neonate at the same time 310
as tenofovir (unpublished data). As previously shown, tenofovir should be administered 311
quickly after birth, i.e. one hour after delivery, so we simulated concentrations obtained with 312
1, 2 or 3 mg/kg of emtricitabine given one hour after birth to the neonate. A 2 mg/kg FTC 313
dose given 12 hours after birth was also simulated. Taking into account the high exposure of 314
the fetus to the drug due to maternal administration (AUC0-24h =8.2 mg/L.h), only 1 mg/kg of
315
emtricitabine was needed one hour after birth to reach an AUC0-24h of 10.1 mg/L.h. However
316
if the neonate could only be administered FTC 12 hours after birth, the dose would increase to 317
2 mg/kg. This dosage is recommended for a single administration following birth and not for 318
repeated doses as in the Blum study (5). 319
In conclusion, the maternal 400 mg emtricitabine administration before delivery 320
produces higher exposure than the 200 mg administration in others adults at steady state. 321
Emtricitabine placental transfer, described by neonatal to maternal exposure ratio was around 322
80%. Finally, neonates should receive FTC 1 mg/kg as soon as possible after birth or 2 mg/kg 323
12 hours after birth to have concentrations comparable to those observed in adults. The 324
second step of TEmAA trial will validate these recommendations. 325 326 327 328 329 Acknowledgements
We acknowledge the French Agence Nationale de Recherche contre le VIH/SIDA et les hepatitis virales (ANRS) for sponsoring the trial, as well as European and Developing Clinical Trials Partnership (EDCTP) for their additional financial support.
We greatly thank the local investigators and their staff in the Formations Sanitaires Urbaines de Youpougon and Abobo and the Centre Hospitalier Universitaire de Yopougon in Abidjan, in the Calmette Hospital and Pasteur Institute in Phnom Penh, and the Perinatal HIV Research Unit and Lesedi Clinic in Soweto. We also thank the women who accepted to participate in the trial and their infants. We acknowledge Gilead Sciences for providing the study drugs. Didier K Ekouevi was EDCTP Senior fellowship (2005-2007).
The TEmAA trial group is constituted as follows:
- Co-investigators: Prs Christine Rouzioux, Stéphane Blanche and Jean-Marc Treluyer, Dr Marie-Laure Chaix and Dr Elisabeth Rey (Paris, France), Pr N’dri-Yoman (Abidjan, Côte d’Ivoire), Pr Kruy Leang Sim and Dr Eric Nerrienet (in
Phnom Penh, Cambodia) and Prs Glenda Gray and James McIntyre (Soweto, South Africa)
- Trial coordinator: Dr Elise Arrivé (Bordeaux, France)
- Other members of the TEmAA ANRS 12109 Study Group (by place and alphabetic order):
• Paris: Déborah Hirt, Saik Urien
• Abidjan: Gérard Allou, Clarisse Amani-Bosse, Divine Avit, Gédéon Bédikou, Kouakou Brou, Patrick Coffié, Patrice Fian, Eulalie Kanga, Broulaye Kone, Suzanne Kouadio, Guy César Kouaho, Jeanne Eliam Kouakou, Sidonie Ngatchou, Touré Pety, Zenica Seoue, Mamourou Kone
• Phnom Penh: Laurence Borand, Pinn Chou, Kearena Chhim, Meng Ly Ek, Viseth Horm Srey, Seng Hout, Sethikar Im, Saroeum Keo, Vannith Lim, Sopheak Ngin, Vara Ouk, Vibol Ung , and the Magna and
Maryknoll associations
• Soweto : Gail Ashford, Promise Duma, Portia Duma, Sarita Lalsab, Shini Legote, Tshepiso Mabena, Joseph Makhura, Modise Maphutha, Selvan Naidoo, Mandisa Nyati
- Scientific Board: Pr Bernard Koffi Ngoran (Abidjan, Côte d’Ivoire), Pr Koum Kanal (Phnom Penh, Cambodia), Pr Lynn Morris (Johannesburg, South Africa), Dr Séverine Blesson (ANRS, Paris, France), Dr Camille Aubron-Olivier (Gilead Sciences, Paris, France), Pr Gilles Peytavin (Paris, France), Pr Koen Van Rompay (Davis, California, USA), Dr Valériane Leroy (Bordeaux, France)
- Independent Committee: Prs John Sullivan (Worcester, Massachusetts, USA), Philippe Lepage (Brussels, Belgium), Laurent Mandelbrot (Paris, France), Marie-Louise Newell (London, UK), Anne-Marie Taburet (Paris, France)
References
1. Beal, S. L. 2001. Ways to fit a PK model with some data below the quantification limit. J Pharmacokinet Pharmacodyn 28:481-504.
2. Beal, S. L., and L. B. Sheiner. 1998. NONMEM User's Guide; NONMEM project group, San Francisco:University of California.
3. Best, B., A. Stek, C. Hu, S. Burchett, S. Rossi, E. Smith, B. Sheeran, J. Read, E. Capparelli, M. Mirochnick, and a. f. t. P. I. P. s. Team. 2008. Presented at the 15th Conference on Retroviruses and Opportunistic Infections, Boston, 3-6th of febrary. 4. Blum, M. R., G. E. Chittick, J. A. Begley, and J. Zong. 2007. Steady-state
pharmacokinetics of emtricitabine and tenofovir disoproxil fumarate administered alone and in combination in healthy volunteers. J Clin Pharmacol 47:751-9.
5. Blum, M. R., D. Ndiweni, G. Chittick, N. Adda, D. Kargl, and D. Josipovic. 2006. Presented at the 13th Conference on Retroviruses and Opportunistic Infections, Denver, 5-8 th of febrary 2006.
6. Chi, B. H., M. Sinkala, F. Mbewe, R. A. Cantrell, G. Kruse, N. Chintu, G. M. Aldrovandi, E. M. Stringer, C. Kankasa, J. T. Safrit, and J. S. Stringer. 2007. Single-dose tenofovir and emtricitabine for reduction of viral resistance to non-nucleoside reverse transcriptase inhibitor drugs in women given intrapartum nevirapine for perinatal HIV prevention: an open-label randomised trial. Lancet
370:1698-705.
7. Eshleman, S. H., D. R. Hoover, S. Chen, S. E. Hudelson, L. A. Guay, A. Mwatha, S. A. Fiscus, F. Mmiro, P. Musoke, J. B. Jackson, N. Kumwenda, and T. Taha.
2005. Nevirapine (NVP) resistance in women with HIV-1 subtype C, compared with subtypes A and D, after the administration of single-dose NVP. J Infect Dis 192:30-6.
8. Ihaka, R., and R. Gentleman. 1996. R: a language for data analysis and graphics. J Comput Graph Stat 5:299.
9. Jackson, J. B., G. Becker-Pergola, L. A. Guay, P. Musoke, M. Mracna, M. G. Fowler, L. M. Mofenson, M. Mirochnick, F. Mmiro, and S. H. Eshleman. 2000. Identification of the K103N resistance mutation in Ugandan women receiving nevirapine to prevent HIV-1 vertical transmission. AIDS 14:F111-5.
10. Krauer, B., F. Krauer, and F. E. Hytten. 1980. Drug disposition and pharmacokinetics in the maternal-placental-fetal unit. Pharmacol Ther 10:301-28. 11. Le Saux, T., S. Chhun, E. Rey, O. Launay, L. Weiss, J. P. Viard, G. Pons, and V.
Jullien. 2008. Quantification of seven nucleoside/nucleotide reverse transcriptase inhibitors in human plasma by high-performance liquid chromatography with tandem mass-spectrometry. J Chromatogr B Analyt Technol Biomed Life Sci 865:81-90. 12. Loebstein, R., A. Lalkin, and G. Koren. 1997. Pharmacokinetic changes during
pregnancy and their clinical relevance. Clin Pharmacokinet 33:328-43.
13. Mirochnick, M. 2000. Antiretroviral pharmacology in pregnant women and their newborns. Ann N Y Acad Sci 918:287-97.
14. Parry, E., R. Shields, and A. C. Turnbull. 1970. Transit time in the small intestine in pregnancy. J Obstet Gynaecol Br Commonw 77:900-1.
15. Ramanathan, S., G. Shen, A. Cheng, and B. P. Kearney. 2007. Pharmacokinetics of emtricitabine, tenofovir, and GS-9137 following coadministration of emtricitabine/tenofovir disoproxil fumarate and ritonavir-boosted GS-9137. J Acquir Immune Defic Syndr 45:274-9.
16. Rodman, J. H., P. M. Flynn, B. Robbins, E. Jimenez, A. D. Bardeguez, J. F. Rodriguez, S. Blanchard, and A. Fridland. 1999. Systemic pharmacokinetics and
cellular pharmacology of zidovudine in human immunodeficiency virus type 1-infected women and newborn infants. J Infect Dis 180:1844-50.
17. Wang, L. H., A. A. Wiznia, M. H. Rathore, G. E. Chittick, S. S. Bakshi, P. J. Emmanuel, and P. M. Flynn. 2004. Pharmacokinetics and safety of single oral doses of emtricitabine in human immunodeficiency virus-infected children. Antimicrob Agents Chemother 48:183-91.
18. Zong, J., G. E. Chittick, L. H. Wang, J. Hui, J. A. Begley, and M. R. Blum. 2007. Pharmacokinetic evaluation of emtricitabine in combination with other nucleoside antivirals in healthy volunteers. J Clin Pharmacol 47:877-89.
Figures
Figure 1
Population pharmacokinetic model for the simultaneous prediction of emtricitabine concentrations in the mother, the cord (top) and the neonate (bottom). A 2-compartment model with first-order absorption and elimination best described maternal data. For cord concentrations, an “effect” compartment is modeled as a virtual compartment linked to the maternal plasma compartment by a first-order process. After delivery, the fetal compartment is disconnected and the neonate has his own elimination. F denotes for bioavailability, D the emtricitabine maternal dose, ka the absorption rate constant, CL the maternal elimination
clearance from the central compartment, V1 the volume of the central maternal compartment,
Q2 the maternal intercompartmental clearance, V2 the volume of the peripheral maternal
compartment, k1F maternal-to-fetal rate constant, kF1 the fetal-to-maternal rate constant, kFO
neonate elimination rate constant, VF the fetal volume of distribution, BWM the maternal
bodyweight and BWFPA the sum of neonatal bodyweight, placenta and amniotic fluid weight.
Figure 2
Left: Observed (points) and population predicted (lines) maternal emtricitabine concentrations versus time. Right: Observed (points) and population predicted (lines) emtricitabine concentrations in cord blood (up) and neonatal plasma (bottom) versus time.
Figure 3
Evaluation of the final model: comparison between the 5th (dash line), 50th (full line) and 95th
(dash line) percentile obtained from 1000 simulations and the observed data (points) for emtricitabine concentrations in mother (left), cord blood (middle) and neonate (right).
Figure 4
Up: Population predicted emtricitabine concentrations in the mother (full line) and her neonate (dashed line; cord equation before delivery and neonatal equation after) versus time: for a 2 hours (left), 6 hours (middle) or 12 hours (right) delay between drug administration and delivery time. Down: Neonatal-to-maternal emtricitabine AUC ratio as a function of the delay between drug administration and delivery time.
Table 1. Characteristics of the HIV-infected pregnant women (N=38) enrolled in the pharmacokinetic study of the TEmAA ANRS 12109 trial, Step 1
Covariates Median (Min-Max)
Maternal bodyweight at delivery (kg) 58.3 (46.5 – 88.1)
Gestationnel age (weeks) 39 (33 – 42)
Delivery : vaginal, caesarian section (n) 24 , 14
Maternal creatinine clearance at enrolment (µmol/L) 42.2 (26 – 88)
Neonatal bodyweight at birth (kg) 2.7 (2.3 – 3.6)
Neonatal height at birth (cm) 48.5 (46 – 53)
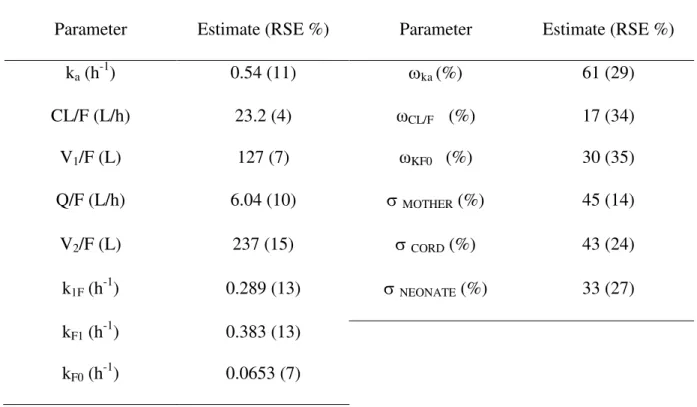
Table 2. Population pharmacokinetic parameters of emtricitabine from the final model
for HIV-infected pregnant women (N=38) after receiving 400 mg of emtricitabine at the start of the labour and for their neonates (N=32) enrolled in the TEmAA ANRS 12109 trial, Step 1
Structural model Statistical model
Parameter Estimate (RSE %) Parameter Estimate (RSE %)
ka (h-1) 0.54 (11) ωka (%) 61 (29) CL/F (L/h) 23.2 (4) ωCL/F (%) 17 (34) V1/F (L) 127 (7) ωKF0 (%) 30 (35) Q/F (L/h) 6.04 (10) σ MOTHER (%) 45 (14) V2/F (L) 237 (15) σ CORD (%) 43 (24) k1F (h-1) 0.289 (13) σ NEONATE (%) 33 (27) kF1 (h-1) 0.383 (13) kF0 (h-1) 0.0653 (7)
Key: RSE%, relative standard error (standard error of estimate / estimate*100); ka absorption rate constant, CL/F maternal apparent elimination clearance from the central compartment, V1/F apparent volume of distribution of the central maternal compartment, Q2/F apparent
maternal intercompartmental clearance, V2/F apparent volume of distribution of the peripheral
maternal compartment, k1F maternal-to-fetal rate constant, kF1 fetal-to-maternal rate constant
and kF0 neonate elimination rate constant. σ residual variability estimates (CV of residual
Table 3. Maternal minimal, maximal concentrations (Cmin and Cmax) and area under de curves (AUC), derived from women’s individual pharmacokinetic estimates, aftera 400 mg FTC dose to the HIV-infected pregnant women (N=38) enrolled in the TEmAA ANRS 12109 trial, Step 1, compared to median adults values after a 200 mg FTC dose at steady state. Median TEMAA Pregnant, 400 mg Zhong et al. (18) Adults, 200 mg Blum et al. (4) Adults, 200 mg Ramanathan et al. (15) Adults, 200 mg AUC (mg/L.h) 14.3 (11.0 – 19.0) 10.7 10.7 9.8 Cmin (mg/L) 0.076 (0.039 – 0.174) 0.071 0.075 0.085 Cmax (mg/L) 1.68 (0.82 – 2.13) 2.18 1.69 1.68
Table 4. Neonatal parameters estimated for an administration 0, 1, 2 and 3 mg/kg 1 hour after birth and 2 mg/kg 12 hours after birth, TEmAA ANRS 12109 trial, Step 1
Median 0 mg/kg 1 mg/kg at 1h 2 mg/kg at 1h 3 mg/kg at 1h 2 mg/kg at 12 h AUC0→24 (mg/L.h) 8.2 10.1 11.9 13.4 10.5 Cmin (mg/L) 0.67 0.67 0.67 0.31 T (C>0.077) (h) 36.6 40.2 42.8 33.9
GUT MOTHER central FETUS ka k1F V2 Q2 CL kF1 MOTHER peripheral V1
ANTEPARTUM AND INTRAPARTUM
GUT MOTHER central NEONATE ka V2 Q2 CL MOTHER peripheral V1 POSTPARTUM kF0
(
)
M F 2 1 F BW BW V V V = ( + )× M FPA 2 1 F BW BW V V V = + ×0 5 10 15 20 0 .0 0 .5 1 .0 1 .5 2 .0 time (h) u m b il ic a l F T C c o n c e n tr a ti o n s ( m g /L ) 0 10 20 30 40 50 0 .0 0 .5 1 .0 1 .5 2 .0 time (h) n e o n a ta l F T C c o n c e n tr a ti o n s ( m g /L ) 0 20 40 60 80 0 1 2 3 4 5 time (h) m a te rn a l F T C c o n c e n tr a ti o n s ( m g /L )
0 5 10 15 20 25 0 1 2 3 4 time (h) [ CMT 2 ] F T C c o n c e n tr a ti o n s ( m g /L ) 5 10 15 0 .0 0 .5 1 .0 1 .5 time (h) [ CMT 3 ] 10 20 30 40 50 0 .0 0 .2 0 .4 0 .6 0 .8 time (h) [ CMT 4 ]
MOTHER
CORD
NEONATE
0 5 10 15 20 0 .0 0 .5 1 .0 1 .5 2 .0 0 5 10 15 20 0 .0 0 .5 1 .0 1 .5 2 .0 0 5 10 15 20 0 .0 0 .5 1 .0 1 .5 2 .0 0 5 10 15 20 25 0 2 0 4 0 6 0 8 0 1 0 0 n e o n a ta l A U C / m a te rn a l A U C Time (h) M a te rn a l (f u ll l in e) a n d n eo n a ta l (d a sh ed l in e) F T C c o n ce n tr a ti o n s (m g /L )
Delay between maternal drug uptake and delivery (h) Delay between maternal drug uptake and delivery (h)