HAL Id: hal-01476479
https://hal.archives-ouvertes.fr/hal-01476479
Submitted on 2 Mar 2017HAL is a multi-disciplinary open access
archive for the deposit and dissemination of sci-entific research documents, whether they are pub-lished or not. The documents may come from teaching and research institutions in France or abroad, or from public or private research centers.
L’archive ouverte pluridisciplinaire HAL, est destinée au dépôt et à la diffusion de documents scientifiques de niveau recherche, publiés ou non, émanant des établissements d’enseignement et de recherche français ou étrangers, des laboratoires publics ou privés.
Atomic scale modeling of iron-doped biphasic calcium
phosphate bioceramics
Sandrine Gomes, Amandeep Kaur, Jean-Marc Greneche, Jean-Marie Nedelec,
Guillaume Renaudin
To cite this version:
Sandrine Gomes, Amandeep Kaur, Jean-Marc Greneche, Jean-Marie Nedelec, Guillaume Renaudin. Atomic scale modeling of iron-doped biphasic calcium phosphate bioceramics. Acta Biomaterialia, Elsevier, 2017, 50, pp.78-88. �10.1016/j.actbio.2016.12.011�. �hal-01476479�
Atomic scale modeling of iron-doped biphasic calcium
phosphate bioceramics
Sandrine Gomes,1,2 Amandeep Kaur,1,2, Jean-Marc Grenèche,3 Jean-Marie Nedelec1,2 and Guillaume Renaudin1,2,*
1
Université Clermont Auvergne, SIGMA Clermont, Institut de Chimie de Clermont-Ferrand, BP 10448, F-63000 Clermont-Ferrand, France.
2
CNRS, UMR 6296, ICCF, F-63178 Aubière, France. 3
Institut des Molécules et Matériaux du Mans, UMR CNRS 6283, Université du Maine, 72085 Le Mans Cedex, France
Abstract:
Biphasic Calcium Phosphates (BCP) are bioceramics composed of hydroxyapatite (HAp, Ca10(PO4)6(OH)2) and beta-Tricalcium Phosphate (-TCP, Ca3(PO4)2). Because their chemical and mineral composition closely resembles that of the mineral component of bone, they are potentially interesting candidates for bone repair surgery, and doping can advantageously be used to improve their biological behavior. However, it is important to describe the doping mechanism of BCP thoroughly in order to be able to master its synthesis and then to fully appraise the benefit of the doping process. In the present paper we describe the ferric doping mechanism: the crystallographic description of our samples, sintered at between 500°C and 1100°C, was provided by Rietveld analyses on X-ray powder diffraction, and the results were confirmed using X-ray absorption spectroscopy and 57Fe Mössbauer spectrometry. The mechanism is temperature-dependent, like the previously reported zinc doping mechanism. Doping was performed on the HAp phase, at high temperature only, by an insertion mechanism. The Fe3+ interstitial site is located in the HAp hexagonal channel, shifted from its centre to form a triangular three-fold coordination. At lower temperatures, the Fe3+ are located at the centre of the channel, forming linear two-fold coordinated O-Fe-O entities. The knowledge of the doping mechanism is a prerequisite for a correct synthesis of the targeted bioceramic with the adapted (Ca=Fe)/P ratio, and so to be able to correctly predict its potential iron release or magnetic properties.
Keywords: Iron doping, Hydroxyapatite bioceramics, Rietveld refinement, X-ray Absorption
Contact: Pr Guillaume Renaudin, guillaume.renaudin@sigma-clermont.fr
present address: VIT University, Vellore, Tamil Nadu 632014, India.
1- Introduction
The mineral mass of bone is dominated by nanocrystalline non-stoichiometric hydroxyapatite (HAp, chemical formula Ca10(PO4)6(OH)2, Ca/P ratio of 1.67) [1-4]. Non-stoichiometry is mainly assumed by few weight percent of carbonate substitution and also calcium deficiency, nevertheless many trace elements participate to the non-stoichiometry. Tricalcium phosphate (-TCP, chemical composition Ca3(PO4)2, Ca/P ratio of 1.5) has a Ca/P ratio close to that of HAp and presents higher solubility under biological conditions [5-6]. HAp and BCP (biphasic calcium phosphates composed of a mixture of HAp and -TCP) have been investigated for biomedical applications in reconstructive surgery (hard tissue replacement implants and bone prosthesis coating) due to their excellent bioactivities, biocompatibility and osteoconductivity [5-10]. In addition, the doping effect can advantageously be used, among other levers, to improve the biomedical properties of HAp-based ceramics [11]. Nanocrystalline bone mineral contains numerous essential trace elements [4,9]. The role of many of these ionic species in hard tissues is not fully understood, because of the difficulties encountered in monitoring and quantifying their proportions, which vary according to dietary alteration and to physiological and to pathological causes. However, it is commonly accepted that these various ions play a major role in the biochemistry of bones, enamel and dentine by a substitution process [12]. Our previous results on Zn-doped BCP samples highlighted that a fine description of the incorporation mechanism of the doping element remains a significantfactorin correctly interpreting biological behavior, namely due to the different solubility of the two HAp and -TCPphases [13-15]. The incorporation of the doping element in one or the other phases will deeply modify its potential release in biological fluid. The HAp structure is known to accept
various ionic substitutions, as has been demonstrated for carbonate [16,17], silicate [18-21], borate [22,23] and alkaline earth cations Mg2+ [24-26] and Sr2+ [27,28]. Nevertheless our recent results on the Zn-doping mechanism demonstrated that substitution is not the only mechanism to be considered: insertion into an interstitial site [13], as also described for bevolite (the Sr equivalent with composition Sr10(PO4)6(OH)2) [29], has been established. This doping mechanism is temperature-dependent [14]. Zn-doping elements can be locatedin drastically different local environments. The transfer fromthe six-fold coordinated calcium site substitution in -TCPat moderate temperature to the two-fold coordinated insertion in HAp at higher temperature is a significant phenomenon.
Following our Zn-doping insertion mechanism studies we undertook a systematic study of BCP doping by the 3d-metal cation series from manganese to zinc. The present paper is devoted to the specific case of ferric cations. Iron is an essential trace element in bones and teeth, is a micronutrient essential for various biological processes and is an important component of several metalloproteins. Iron represents approximately 35 and 45 mg/kg of body weight in adult women and men, respectively. In the intestinal lumen, iron exists in the form of ferrous and ferric salts, although most dietary inorganic iron is in the form of ferric salts [30]. Recent studies have shown that the presence of Fe3+ affects the crystallinity and solubility of HAp [31-34], while small amounts of iron were found to have a positiveimpact on the biomedical properties of HAp [35-37]. The blood compatibility, and more generally the biocompatibility and non-cytotoxicity, of Fe3+-doped HAp has recently been demonstrated, withimproved bactericidal and mineralizing properties compared to undoped HAp [38-40]. Biomagnetic calcium phosphate ceramics, incorporating magnetic ions and exhibiting ferromagnetic properties, play an important role in medicine. DopedmagneticHAp could be useful for biological applications such as magnetic resonance imaging (MRI), cell separation, drug delivery and heat mediation for the hyperthermia treatment of cancers [39,41].
Despite the recently-described insertion mechanism for Zn2+ [13-15] and despite the cationic size difference between Fe3+ (0.64 Å, CN6) and Ca2+ (1.00 Å, CN 6) [42], a substitution mechanism at calcium crystallographic sites is commonly considered in the literatureas for all cations. In the present study, a detailed structural description of Fe-doped HAp is investigated to clarify the situation. Series of BCP samples (HAp being the main phase) are synthesized using the sol-gel method with different iron doping levels and with thermal treatments between 500°C and 1100°C. In addition to a long-range order investigation performed using Rietveld refinement on X-ray powder diffraction patterns, the local order is finely described thanks to X-ray absorption spectroscopy and 57Fe Mössbauer spectrometry.
2- Materials and methods
2.1 Sol-gel elaboration of Fe-substituted BCP samples
The sol-gel method previously proposed by the authors was used to synthesize one undoped and four Fe-doped series of BCP samples [14]. Briefly, to produce 2 g of undoped BCP powder, 4.7 g of Ca(NO3)2.4H2O (Aldrich) and 0.84 g of P2O5 (Avocado Research chemicals) were dissolved in ethanol (anhydrous, > 99.5 %, Aldrich) under stirring and refluxed at 85°C for 24 hours. Thesolution was maintained at 55°C for 24 hours to obtain a as for all cations consistent gel, and then further heated to 80°C for 10 hours to obtain a white powder. Finally, the powder was sintered for 15 hours. Heat treatments were performed at 500°C, 600°C, 700°C, 800°C, 900°C, 1000°C and 1100°C (series of seven samples with the same chemical composition). To prepare the Fe-doped samples, the required amount of Fe(NO3)3.9H2O Aldrich) was added to the solution, simultaneously with Ca(NO3)2.4H2O (Sigma-Aldrich). Nominal compositions were calculated assuming the insertion of Fe3+ cationsat the interstitial crystallographic site of hydroxyapatite; i.e. constant Ca/P = 1.67. In the following, samples are labeled ‘xFe-T’ with x = 00, 15, 25, 50 and 75 for samples with respectively the
targeted nominal Ca10(PO4)6(OH)2, Ca10Fe0.15(PO4)6(OH)1.55O0.45, Ca10Fe0.25(PO4)6(OH)1.25O0.75, Ca10Fe0.50(PO4)6(OH)0.50O1.50 and Ca9.875Fe0.75(PO4)6O2 compositions. Deprotonation of hydroxyl anions was first assumed to counterbalance the excess interstitial Fe3+ positive charges (i.e. three H+ protons substitution by one Fe3+), followed by calcium deficiency for the higher iron amount in the 75Fe-T series. A total of 35 samples, distributed in five series according to chemical compositions, were synthesized and analyzed. Elemental analyses of the samples using ICP-AES confirmed that iron added in the solutions were well incorporated in the precipitates.
Sample color were sintering temperature-dependent. Powders obtained after the sol-gel process were white. Heat treatment at 500°C produced light grey samples, which became orange when the temperature increases and attained a rust color at 1000°C (the greater the iron content, the more pronounced the coloration is). Finally, heat treatment at 1100°C resulted in light purple powders.
2.2 X-Ray Powder diffraction (XRPD) and Rietveld analyses
XRPD patterns were recorded on a X’Pert Pro Philips diffractometer, with θ-θ geometry, equipped with a solid X-Celerator detector and using Cu K radiation ( = 1.54184 Å). XRPD patterns were recorded at room temperature in the interval 3° < 2θ < 120°, with a step size of 2θ = 0.0167° and a counting time of 200 s for each data value. A total counting time of about 200 min was used for each sample (some raw data are showing in Figure SI1a from supplementary information). A XRPD pattern was collected from pure NIST standard LaB6using the same experimental conditions in order to extract the instrumental resolution function to improve peak profile fitting during Rietveld refinements.
Rietveld refinements of X-ray powder patterns were performed for each sample usingFullProf.2k software [43]. The procedure used (both data-collection and refinement
strategy) corresponds to the general guidelines for structure refinement using the Rietveld (whole-profile) method formulated by the International Union of Crystallography Commission on Powder Diffraction [44-46]. The Rietveld refinement strategy was detailed in previous related work [14]. Examples of Rietveld plots are showing in Figure SI1b.
2.3 X-ray Absorption Spectroscopy (XAS)
Fe K-edge Extended X-ray Absorption Fine Structure (EXAFS) spectra, simultaneously with the X-ray Absorption Near Edge Structure (XANES) part of the spectra, were acquired from the Fe-doped samples and two reference compounds (-Fe2O3 and Fe3O4) using the SuperXAS beamline at Swiss Light Source (SLS, Villigen, Switzerland) in order to determine the electronic state as well as to accurately describe the coordination spheres of Fe atoms. The SLS synchrotron was running under standard ring conditions (2.4 GeV with an average current of 400 mA). For energy collection, a Si(111) double-crystal monochromator – which offers an energy resolution of ΔE/E = 2.0 x 10⁻⁴
necessary to resolve the XANES structure – was used. The experiments were calibrated using a metallic iron reference foil (K-edge 7709 eV). Experiments were performed at room temperature and atmospheric pressure. Spectra were collected in an energy range between 7000 and 8000 eV, with the energy step varying from 0.5 eV (XANES part) to 2.0 eV (end of the EXAFS part) and 1s dwell time per point. XAS spectra were obtained in fluorescence mode using a 13-element Ge solid-state detector. The size of the beam was determined by a set of slits (200 μm x 500 μm).
Data processing was performed using the Athena and Artemis programs from the IFFEFIT software package [47] by merging 6 successively-recorded absorption spectra. Single scattering theory was used here. Following Lengeler-Eisenberg normalization, EXAFS oscillations were Fourier Transformed (FT) using a Hanning window between 3.0 and 9.0 Å-1. The χ(k) function was Fourier transformed using k3
was done in R-space. Theoretical backscattering paths were calculated using successively ATOMS [48] and FEFF6 [49]. This data processing strategy was detailed in the Zn-doping study [15].
2.4 57Fe Mössbauer spectrometry
The Fe-containing samples were analyzed by means of Mössbauer spectrometry using a conventional constant acceleration transmission device with a 57Co(Rh) source. The samples, consisting of thin layers of powder with about 15 mg of Fe/cm2, were located on the transducer for 300K and in a bath cryostat for 77K measurements. The hyperfine parameters were refined by means of MOSFIT (unpublished program) by considering a suitable number of quadrupolar and/or magnetic components with lorentzian lines to describe the Mössbauer spectra. The isomer shift values quoted are those of -Fe at 300K while the proportions of each species were estimated from the relative absorption area of their respective components, assuming the same recoilless Lamb-Mössbauer factor values.
3- Results:
3.1 Rietveld analyses
3.1.1 Mineralogical analysis of the samples
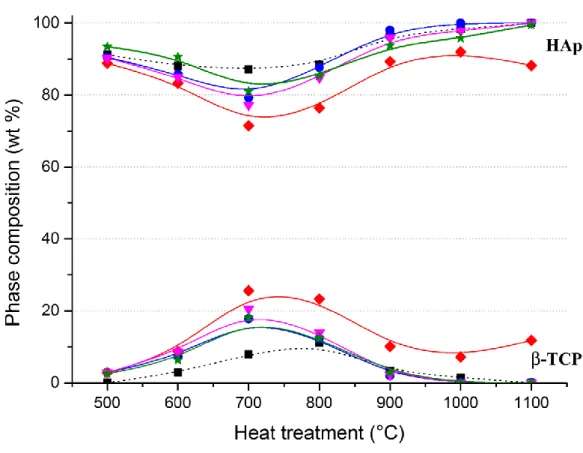
To correctly interpret the behavior of our samples, their mineral compositions were estimated from the Rietveld refinements performed on Laboratory X-ray diffraction patterns. Mineral compositions for the five series of samples are indicated in Table 1, and the weight percent (wt %) of the two main phases, HAp and β-TCP, are represented in Figure SI2 from supplementary information. In agreement with the targeted composition Ca10Fex(PO4)6(OH) 2-3xO3x, the samples which were heat treated at 500°C and 1100°C were mainly composed of
Ca/P ratio of 1.67. The β-TCP phase was stabilized both by iron doping and by intermediate temperatures with the maximum amount observed at 700°C. The maximum amount of β-TCP was observed at 800°C for the undoped series. Nevertheless, general changes in the HAp/ -TCP weight ratio for undoped and Fe-doped series are similar. Except for the 25Fe-T series, all xFe-T series show extremely similar temperature behaviors with single phase samples for heat treatments from 1000°C. Combined with the two expected HAp and β-TCP phases, α-CDP (with composition Ca2P2O7), CaCO3, CaO and -Fe2O3 (hematite) are temperature dependent impurities. For the Fe-doped series, CaO is never formed, CaCO3 is present up to 600°C, α-CDP is present up to 700°C and α-Fe2O3 is series-dependent with a maximum amount observed at 1000°C (followed by a sharp decrease at 1100°C). The destabilization of
-Fe2O3 between 1000°C and 1100°C indicates that Fe atoms only really incorporate the HAp structure at 1100°C.
3.1.2 Lattice parameters of HAp and β-TCP
The variations in the lattice parameters of HAp and β-TCP give initial indications about the mechanism of iron incorporation into their structures. Table SI1 presents refined lattice parameters for the HAp phase, while Figures1a and 1b reports their variationswith respect to sintering temperature. Variations in the HAp lattice parameters can be decomposed into two steps: from 500°C to 1000°C only weak variations are observed (lattice parameters from the Fe-doped series are close to those of the undoped series) whereas drastic and anisotropic variations occur between 1000°C and 1100°C. The sharp expansion of thec lattice parameter combined with the contraction of thea lattice parameter evince an interstitial mechanism of insertion of iron atoms into the HAp structure, as already described for the Zn-doping mechanism [14]. The increase in unit cell volume (Figure 1c) between 1000°C and 1100°C is not consistent with a substitution mechanism (as the Fe3+ cation is smaller than Ca2+). The
drastic variations in the lattice parameters and unit cell volume are also directly dependent on the Fe quantity. We can note, for lower sintering temperatures, the slight decrease in the basal
a lattice parameter for the Fe-doped series, which could be attributed to a calcium substitution
mechanism at 500°C and 600°C.
The case of β-TCP is different. Table SI2 shows the refined lattice parameters of β-TCP as a function of the iron amount introduced for sintering temperatures which stabilize the β-TCP phase (800°C for the undoped series and 700°C for the iron-containing series). The values of both the a and c lattice parameters (and consequently that of unit cell volume) diminish with the increase in the iron doping level, in agreement with a calcium substitution mechanism. Substitution is first performedat the Ca4 site, and then is carried to the Ca5 site; i.e. calcium substitution from the low density column habitually encountered with this β-TCP phase [13-15, 24, 27, 28].
3.1.3 Location of Fe3+in the HAp structure
During Rietveld refinements the occupancy factors of all calcium and phosphorus crystallographic sites were systematically tested. Whatever the temperature and the Fe-doping level, no vacancies were evinced up to 1000°C (Table SI3), unlike iron-containing samples which had been heat treated at 1100°C (Table 2). For Fe-doped samples heat treated at 1100°C, vacancies at the Ca2 site were refined for the 25Fe-T, 50Fe-T and 75Fe-T series leading to calcium-deficient hydroxyapatite. The vacancy amount increases with the Fe-doping level, indicating that calcium vacancies participate in the charge compensation mechanism to counterbalance the positive charge brought by Fe3+ insertion.
Up to 1000°C, Rietveld refinements, in agreement with mineralogical analysis and HAp lattice parameter variations, confirmed the insertion of Fe3+ cations at the interstitial 2b Wyckoff site. Alimited quantity of iron cationswere located in the hexagonal channel at the
(0,0,0) position; corresponding to the refined Ca10Fe0.10(1)(PO4)6(OH)1.70O0.30 composition. Alimited amount of iron was still refined at this 2b site for a sintering temperature of 1100°C; nevertheless refined isotropic thermal factors for iron atoms located at the 2bsite became extremely large, and Fourier difference maps showed the presence of diffused electronic density around this 2b site. A shift of the Fe atomic position from (0,0,0) to the split 12i (x,0,0) position improved the Rietveld agreement factors and enableda considerable increase in the refined iron occupancy amount (reaching the Ca9.77(1)Fe0.48(1)(PO4)6(OH)1.02O0.98composition for 75Fe-1100 samples:Table 2and Table SI1). The large increase in the refined quantity of incorporated iron correlates with the sharp variations in HAp lattice parameters between 1000°C and 1100°C (Figure 1 and Table SI1). Such splitting around the special 2b site in apatite-type structures has already been described for Co-doped belovite Co:Sr10(PO4)6(OH)2 [29]. Figure 1d shows the refined quantity of iron atoms inserted into the hexagonal channel of the apatite structure and Figure 2 illustrates variations in the Fe3+ local cation environment when going from the 2b Wyckoff site to the shifted (0.12, 0, 0) position. Variationsin Fe amount exactly follow the previously-described lattice parameters (or unit cell volume) variations. Iron is really incorporated into the HAp phase above 1000°C. Refined compositions for 15Fe-1100 and 25Fe-1100 samples are close to the targeted composition: Ca10Fe0.18(1)(PO4)6(OH)1.46O0.54 and Ca9.92(1)Fe0.26(1)(PO4)6(OH)1.38O0.62 for the targeted Ca10Fe0.15(PO4)6(OH)1.55O0.45 and Ca10Fe0.25(PO4)6(OH)1.25O0.75 compositions, respectively. Electroneutrality of the refined compositions was assumed by the deprotonation of hydroxyl anions, in combination with refined calcium vacancies when observed. For the other two samples, 50Fe-1100 and 75Fe-1100, the deviations from the targeted Ca10Fe0.50(PO4)6(OH)0.50O1.50 and Ca9.875Fe0.75(PO4)6O2 are greater, Ca9.84(1)Fe0.37(1)(PO4)6(OH)1.21O0.79 and Ca9.77(1)Fe0.48(1)(PO4)6(OH)1.02O0.98, respectively. Here the maximum amount of iron incorporation into the HAp structure seems
to form the Ca9.75Fe0.50(PO4)6(OH)1.00O1.00 compound: the shifted 2b site is 25% occupied by Fe3+ cations. In this proposed chemical formula, the charge balance is assumed to be for two thirds by hydroxyl deprotonation and for one third by calcium vacancies at the Ca2 site. The local environment of the iron cations is strongly affected by the splitting observed between 1000°C and 1100°C. Up to 1000°C, Fe3+ cations are located at the 2b Wyckoff site, coordinates (0,0,0), with a linear two-fold O-Fe-O coordination with two Fe-O4 distances around 1.7 Å. Iron shift in the 12i Wyckoff position observed at 1100°C lead to a new threefold coordination with three distances about 1.85 Å. Iron interatomic distances are reported in Table SI4 for both 1000°C and 1100°C sintering temperatures, and detail of the iron local environment are given in Comment SI1 from the supplementary information document.
3.2XAS analyses
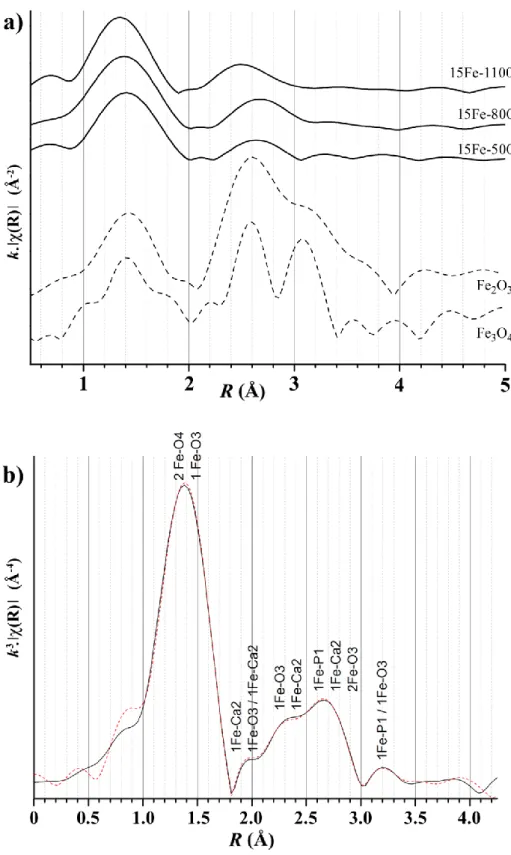
Three samples of the 15Fe-T series (15Fe-500, 15Fe-800 and 15Fe-1100 samples), as well as two reference samples (-Fe2O3 and Fe3O4), were investigated by XAS spectroscopy in fluorescence mode. The 15Fe-T series was chosen because of the single phase feature of the last 15Fe-1100 sample (Table1 and Figure SI2) and because of the absence of the-Fe2O3 phase for all the samples of the series. Reference materials were used to illustrate the well-known tetrahedral and octahedral coordination for iron cations (considering Fe2+ and Fe3+).
3.2.1 Temperature dependency of the spectra
Raw data are reported in Figure SI3 showing the normalized EXAFS spectra, with the XANES part of the spectra and the EXAFS modulations for the 15Fe-T series and for the reference compounds. The temperature variation of the Fourier transformed amplitudes (not corrected for phase shift) is represented in Figure 3a in the R-space. The first peak in the
radial distribution is observed at an R value of 1.4 Å for samples 15Fe-500 and 15Fe-800 (same value for Fe3O4 with iron in tetrahedral and octahedral coordination, compared to 1.45 for -Fe2O3 with iron in octahedral coordination only). This first peak then shifts closer to R = 1.35 Å for sample 15Fe-1100, when a large amount of iron is inserted into the HAp network. In agreement with the XRPD long-range order analysis, local order considerations indicate a temperature-dependent iron incorporation mechanism in our BCP samples with low coordination at 1100°C.
3.2.2 Fe3+ insertion into HAp at 1100°C
EXAFS spectra from the single phase 15Fe-1100 sample were used to explore the local Fe3+environment determined by Rietveld refinement: insertion into a 12i crystallographic site shifted from the 2b site of the HAp structure (i.e. eccentric to the centre of the hexagonal column) leading to the three-fold coordination. The k3-weighted fitted Fe K-edge EXAFS data of 15Fe-1100 is illustrated in Figure 3b (Fitting was performed using Artemis software in the range 1 Å <R< 3.8 Å, not corrected for phase shifts), and fit results are listed in Table 3 (phase shift corrected values).Due to the low symmetry of the iron position in the shifted 2b site, 25 direct paths were considered in this R range. The number of neighbors for each shell was fixed to their crystallographic values (to minimize the number of refined parameters) in the first step. During the final runs, the number of first nearest-neighbors was free in order to confirm the three-fold coordination of iron at 1100°C. The results obtained unambiguously confirm the insertion of Fe3+ cations eccentrically from the 2b Wyckoff site of the HAp structure with a three-fold coordination. The first amplitude observed for a short R distance agrees with a plane triangular FeO3 entity. The refined Fe-O distances are 1.841 (2) Å for two Fe-O4 paths and 1.941 (7) Å for one Fe-O3 path. The refined number of closed oxygen neighbors was exactly 3.0, with 1.6(0.4) O4 + 1.4(0.3) O3. Local environment of iron is well
described by EXAFS analysis, and the ‘shift’ column in Table 3 indicates that the long-range order crystallographic model used for Rietveld refinement is coherent.
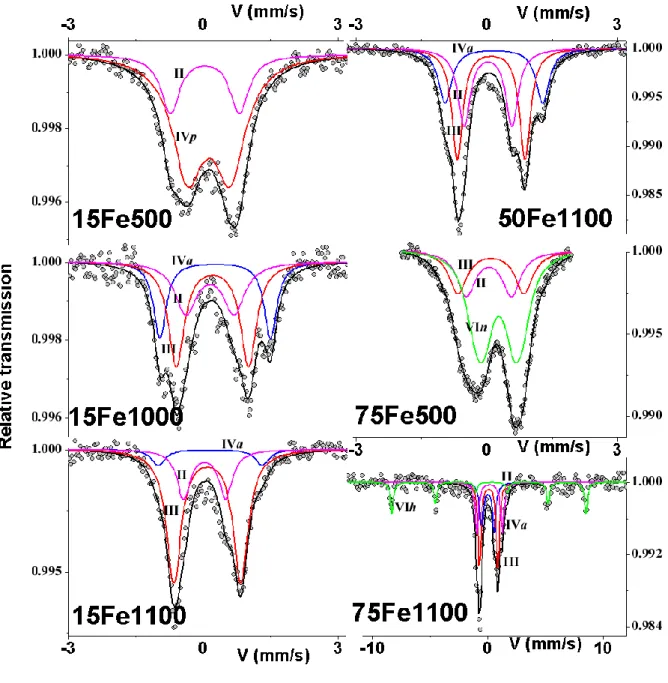
3.3Results: 57Fe Mössbauer spectrometry
Spectra obtained at 300K with quadrupolar hyperfine structure resulting from asymmetrical and non-lorentzian profile lines are illustrated in Figure 4. The fitting procedure (details are given in Comment SI2) allows us to propose a fitting model involving 2, 3 or 4 quadrupolar components (the fourth for the hematite impurity) with lorentzian lines without constraints on the linewidths (correlated to the site distribution: an increase in linewidth indicates a large local environment distribution). The refined values of hyperfine parameters are listed in Table 4. This model clearly enables 4 Fe species to be distinguished, essentially from the isomer shift values, which can be related to the coordination number. Indeed, the larger the isomer shift value, the higher the coordination number.
The first quadrupolar component associated to an isomer shift value in the 0.15-0.17 mm/s range is attributed to the two-fold coordinated Fe inserted into the center of the hexagonal channel of the HAp structure, while the second one, characterized by an isomer shift in the 0.21-0.23 range, is assigned to the three-fold coordinated Fe in the six-fold split position (as illustrated in Figure 2, left and right, respectively). Contrarily to frozen and definite crystallographic visualization of the samples indicating that the 1.1 Å shift of the Fe3+ cation from the center of the hexagonal channel occurs from 1000°C only, 57Fe Mössbauer local probe spectrometry brought a more realistic description of the samples, with a continuous variation on heating from the two-fold to the three-fold coordination for Fe3+ inserted into HAp: 100 % two-fold for 15Fe-500 (500°C sintering temperature), 40 % two-fold versus 60 % three-fold for 15Fe-1000 (1000°C sintering temperature) and 25 % two-fold versus 75 % three-fold for 15Fe-1100 (1100°C sintering temperature), as indicated in Table 4. The
evolution for series containing greater amounts of iron is described in Comment SI2. The quadrupolar splitting values for both the two-fold and the three-fold HApinserted Fe3+ remain quite similar: about 1.0 mm/s for the two-fold Fe3+ and about 1.5 for the three-fold Fe3+ (sample 15Fe-500 only diverges slowly from these QS values). The third quadrupolar component (isomer shift 0.24-0.30 mm/s) is typical of Fe species located in a tetrahedral environment, while the last one and also the magnetic sextet (isomer shift ~ 0.40 mm/s) corresponds to Fe located in an octahedral site. We can note the variation in the tetrahedral Fe3+ signal with heating: IS = 0.24 mm/s and QS = 0.9 mm/s for 15Fe-500 sintered at 500°C against IS = 0.28-0.30 mm/s and QS = 2.1-2.3 mm/s for samples sintered at 1000°C and 1100°C.
The proportions of each Fe species (Table 4) are estimated from the relative absorption area, assuming the same Lamb-Mössbauer recoilless f-factorvalues: it is important to note that the proportions are also extremely dependent on the line width. It is also noteworthy that some of them are quite large, suggesting some distorted structures or, in the case of sample 75Fe-500, the presence of superparamagnetic hematite nanoparticles, which transform into magnetic blocked hematite particles, the size of which is much larger, giving rise to a broadened quadrupolar doublet and a magnetic sextet, respectively. Consequently the results obtained from the 75Fe-500 spectra are less precise; this can explain the absence of a tetrahedral signal and the overestimation of the three-fold component. Finally,all the observed components were attributed to ferric cations, in agreement with the XANES pre-edge position, indicating no oxidation state modification, whatever the sintering temperature.
4- Discussion
4.1 Temperature dependency of the BCP composition
The present characterization of the Fe3+-doping mechanism of BCP bioceramics is highly similar to that previously described in detail for Zn2+ [13-15]. With lower sintering temperatures, BCP samples are mainly composed of the undoped HAp phase. Figure SI4 shows temperature dependency of the total refined iron content in the samples for the four Fe-containing series when considering Fe inserted into the two main calcium phosphates (HAp and -TCP) and iron from hematite. The lack of metal transition for lower temperatures was already observed in our previous Zn-BCP doping study [14]. EXAFS characterization of the Zn-BCP samples showed that the amount of metal transition, undetectable up to 800°C by XRPD long-rang order characterization, is certainly due to cation physisorption on the HAp surface. Present EXAFS results on iron doping indicate that Fe3+cations undetectable by long-range order technic are in tetrahedral coordination. In comparison with Fourier transformed amplitudes of Fe3O4 (first peak at R = 1.4 Å), we can assume that part of the iron is in tetrahedral coordination for heat treatments performed at 500°C and 800°C (Figure 3a). Variation of the assigned tetrahedral signal from Mössbauer spectroscopy (Table 4 with the two tetra phys. and tetra amorph. assignments) highlighted the evolution of the location ofthese fourfold coordinated Fe3+ cations from a physisorbed state at the HAp surface for the lower sintering temperature toa gradually incorporated state (by diffusion) into the Fe-doped HAp amorphous, or poorly crystallized,shell. These observations corroborate already published results. HAp surface tetrahedral ferric cations have been observed using iron Mössbauer spectroscopy by previous researchers [50,51] with the same distinguishable assignments for physisorbed surface Fe3+cations and Fe3+cations located in an amorphous part of the sample (respectively with IS = 0.28 and 0.30 by Jiang et al. [51]; versus respectively IS = 0.24 and 0.28-0.30 in the present work).
For intermediate sintering temperatures, the Fe-doped -TCP phase is stabilized (~20 wt % of BCP) in presence of the undoped (or weakly doped) HAp main phase. And for higher sintering temperatures (above 1000°C), BCP samples are quite exclusively composed of Fe-doped HAp. At 700°C-800°C, iron substitution in the stabilized Fe:-TCP phase is demonstrated by an increase in the total amount of refined iron (Figure SI4), and by the Rietveld refinement of the -TCP structure (Table SI2) with a maximum doping level Ca2.6Fe0.4(PO4)2.
The iron incorporated targeted values are reached at 1100° for the 15Fe-1100 and 25Fe-1100 samples (Figure SI4). For the other two series, the samples at 1100°C still exhibit a deficit in total refined iron content, indicating that either the Fe occupancies in the shifted 2b site are underestimated during Rietveld refinement (due to the great disorder around this 2b position) or a small amount of nanosized iron-containing oxide is present. On the other hand the temperature dependency of the EXAFS spectra, in agreement with the crystallographic description, illustrates that the main change in the iron local environment is realized at 1100°C. 15Fe-500, 15Fe-800 and 15Fe-1100 spectra reveal the same pre-edge signal at 7114 eV, characteristic of ferric cations [52], and EXAFS modulations show more definite contributions in the 15Fe-1100 spectra with a shoulder before the Fe K-edge close to 7120 eV (not present in the other samples of the series or in the reference materials). Figure 3 reveals low iron coordination with short interatomic Fe-O distances at 1100°C at about 1.9 Å (Table 3).
4.2 Iron location into the HAp structure
The iron doping mechanism is dependent on sintering temperature, with an interstitial mechanism for iron insertion into the HAp structure that is realized for the higher temperature. An important specific characteristic of this iron-doping mechanism, compared to
the previously reported zinc doping studies [13-15], is the splitting of the ferric cation out of the centre of the hexagonal channel. It clearly appears that iron insertion in the shifted 2b site at 1100°C (Table 2), correlated to the sharp variation of the HAp lattice parameters (Figure 1), enabled a considerable increase of the iron quantity in the hexagonal HAp channel (from about 0.5 wt % up to 1000°C to a value higher than 2.5 wt % at 1100°C).
The low IS signals,from Mössbauer spectroscopy, we have attributed to Fe3+ inserted into the HAp structure – corresponding to the linear HAp and triang. HAp assignments in Table 4 – have never been observed previously. This should be correlated with the synthesis process; samples were simply heated at 100°C in the study of Jiang et al. [50], and calcinations were performed under nitrogen in the study of Low et al. [51]. It is surprising to observe so great a difference between our samples sintered under air, showing one or two components with IS < 0.2, which was not the case when heating under nitrogen,where the smallest IS valuewas 0.27 [50]. XAS and Mössbauer spectroscopycorroborates the refutation ofa modification of the oxidation state of ferric cations during the sintering process; the whole population of iron cations is trivalent Fe3+ whatever our doped samples. Previously reported studies on iron-doped hydroxyapatites highlight the importance of the synthesis approach. Chandra et al. [38] prepared Fe-doped HAp using a combination of hydrothermal and microwave techniques, and observed a decrease in both the a and chexagonal lattice parameters of HAp with an increase in Fe doping. This does not correspond with our results (anisotropic variation, particularly at a high sintering temperature), and seems to reflect a calcium substitution mechanism. It should be noted that for thelower sintering temperature we also observe a decrease in the basal a lattice parameter combined with an absence of variation in the hexagonal c lattice parameter (Table SI1 and Figure 1). Thus a weak calcium substitution cannot be excluded, even if the Rietveld refinements did not enable us to detect it. The X-ray electronic contrast between Fe3+ and Ca2+ is not very marked, and a possible combination of iron to calcium substitution with a
calcium site deficiency (as reported for the 75Fe-series in Table 2) could mask such a calcium substitution mechanism for the lower sintering temperatures. This hypothesis should be excluded for higher sintering temperatures, as indicated by 1/ lattice parameter variation, 2/ presence of electronic density at the interstitial site and 3/ the low coordination revealed by XAS and Mössbauer spectroscopy for iron. In the same way, the freeze-drying process used by Tampieri et al. [39] led to the preparation of Fe-doped HAP samples without the inserted iron atoms, as illustrated by their EXAFS study. They obtained a first contribution in the uncorrected radial distribution at about 1.5 Å,which was similar to the measured magnetite and maghemite reference materials. The corresponding Fe-O distance is typical of a ferric cation (about 1.95 Å), larger than our refined 1.84 Å value (Table 3) obtained with a first contribution in the uncorrected radial distribution at about 1.35 Å (Figure 3b).
The shift from the 2b Wyckoff site to the 12i Wyckoff site (x ~ 0.12) allows three-fold coordination for the Fe3+ cation (compared to the permanent linear two-fold coordination for Zn2+) and enables an increase in the inserted doping quantity in Ca10Mx(PO4)6(OH)2-yOy, with
xmax ~ 0.25 for Zn2+versus 0.50 for Fe3+. This crystallographic feature has already been
described for apatite-type materials. The insertion of Co2+ into the belovite phase (the strontium analogue of hydroxyapatite Sr10(PO4)6(OH)2) has been studied by Kazin et al. [29] on single crystals prepared at 1300°C. X-ray single crystal diffraction unambiguously indicates that Co2+ cations are located along the hexagonal channel by an insertion mechanism, and are shifted from its centre. The same 12i Wyckoff site was used by the authors to describe Co-doped belovite. The only difference with our Fe-doped HAp description is in the shift amplitude: 0.6 Å for Sr10Co0.4(PO4)6(OH)0.8O against 1.1 Å in our Ca9.75Fe0.50(PO4)6(OH)O compound. Our greater eccentric shift has the advantage of clearly indicating the passage from the two-fold to the three-fold coordination for the shifted inserted cation (Figure 2 and Table 3).
5- Conclusion
The temperature-dependent BCP iron doping mechanism is very close to the previously described zinc doping case. Three different BCP compositions were observed,depending on the sintering temperature: 1/ for temperatures below 600°C, the undoped HAp is nearly the only crystalline phase in BCP, and iron doping cations are physisorbed at its surface; 2/ for intermediate temperatures, BCP samples are composed of about 80 wt % of undoped HAp and about 20 wt % of iron-doped -TCP with ferric cations located at the poorly crystallized shells; and 3/ for temperatures higher than 1000°C, BCP are quite exclusively composed of iron-doped HAp,again with some of the ferric cations located at a poorly crystallized surface. Ferric incorporation into the -TCP structure to form Fe-doped -TCP with composition Ca2.6Fe0.4(PO4)2 is performed using a calcium substitution mechanism at the Ca4 and Ca5 crystallographic sites (i.e. the low density column of the -TCP structure). On the other hand, ferric incorporation into the HAp structure to form Fe-doped HAp with composition Ca9.75Fe0.50(PO4)6(OH)O is performed using an insertion mechanism with Fe3+ cations located in the HAp hexagonal channel. The main difference with the Zn2+ case is the thermal evolutionof this interstitial location. Whereas the Zn2+ cation is permanently located in the centre of the hexagonal channel at the 2b crystallographic site (P63/m space group) at whatever sintering temperature between 500°C and 1100°C, Fe3+ cations move away from the channel center to the eccentric six-fold split 12i crystallographic site for sintering temperatures above 1000°C. This shifted position enables the passage from a two-fold to a three-fold coordination for Fe3+. To the best of the authors’ knowledge, these two low coordination numbers for iron (linear and triangular) have been observed and described for the first time in this paper. All the long-range order crystallographic descriptions of Fe3+ -doped HAp obtained from Rietveld analyses of XRPD have been strengthened by XAS
(XANES and EXAFS) and 57Fe Mössbauer spectroscopies. These techniques show that the passage from the two-fold to the three-fold coordination of Fe3+ in the hexagonal channel does not occur spontaneously at 1000°C (as long-range order investigation seemed to indicate) but is gradually achieved and enhanced with temperature.
These results on the iron doping of BCP samples should be considered, taken into account the applied sintering temperature, when preparing such bioceramics with the controlled (Ca+Fe)/P ratio by keeping constant the Ca/P ratio at 1.67. Indeed it strongly impacts the final mineral composition of the synthesized samples. And, ultimately, it will impact the iron potential release in the body (as β-TCP and HAp have strongly different solubilities)or their eventual magnetic properties.
Acknowledgements
This work was supported by ANR under project NANOSHAP (ANR-09-BLAN-0120-03). We acknowledge SLS for provision of synchrotron radiation facilities and we would like to thank Maarten Nachtegaal for assistance in using beamline SuperXas.
References
[1] S.G. Dahl, P. Allain, P.J. Marie, Y. Mauras, G. Boivin, P. Ammann, Y. Tsouderos, P.D. Delmas, C. Christiansen, Incorporation and distribution of strontium in bone, Bone, 28 (2001) 446–453.
[2] R. Lagier, C.A. Baud, Magnesium whitlockite, a calcium phosphate crystal of special interest in pathology, Pathol. Res. Pract. 199 (2003) 329–335.
[3] R.S. Lee, M.V. Kayser, S.Y. Ali, Calcium phosphate microcrystal deposition in the human intervertebral disc, J. Anat. 208 (2006) 13–19.
[4] C. Rey, C. Combes, C. Drouet, M.J. Glimcher, Bone mineral: update on chemical composition and structure, Osteoporosis Int. 20 (2009) 1013-1021.
[5] S.V. Dorozhkin, Calcium orthophosphates: applications in nature, biology, and medicine, Pan Stanford, Singapore, 2012, 854 pp.
[6] J.C. Elliot, in Structure and chemistry of the apatites and other calcium orthophosphates, Amsterdam: Elsevier; 1994.
[7] W. Suchanek, M. Yoshimura, Processing and properties of hydroxyapatite-based biomaterials for use as hard tissue replacement implants, J. Mater. Res. 13 (1998) 94-117. [8] S.V. Dorozhkin, Biphasic, triphasic and multiphasic calcium orthophosphates, Acta Biomaterialia, 8 (2012) 963–977.
[9] S.V. Dorozhkin, Medical Application of Calcium Orthophosphate Bioceramics, BIO, 1 (2011) 1-51.
[10] S.M. Zakaria, S.H.S. Zein, M.R. Othman, F. Yang, J.A. Jansen, Nanophase hydroxyapatite as a biomaterial in advanced hard tissue engineering: a review, Tissue Eng. B: Reviews 19 (2013) 431-441.
[11] M. Bohner, L. Galea, N. Doebelin, Calcium phosphate bone graft substitutes: Failures and hopes, Journal of the European Ceramic Society, 32 (2012) 2663–2671
[12] A. Bigi, G. Cojazzi, S. Panzavolta, A. Ripamonti, N. Roveri, M. Romanello, K. Noris Suarez, L. Moro, Chemical and structural characterization of the mineral phase from cortical and trabecular bone, J. Inorg. Biochem. 68 (1997) 45–51.
[13] S. Gomes, J.-M. Nedelec, E. Jallot, D. Sheptyakov, G. Renaudin, Unexpected mechanism of Zn2+ insertion in calcium phosphate bioceramics, Chem. Mat. 23 (2011) 3072-3085.
[14] S. Gomes, J.-M. Nedelec, G. Renaudin, On the effect of temperature on the insertion of zinc into hydroxyapatite,Acta Biomaterialia 2012 (8) 1180-1189.
[15] S. Gomes, A. Kaur, J.-M. Nedelec, G. Renaudin, X-ray absorption spectroscopy shining (synchrotron) light onto the insertion of Zn2+ in calcium phosphate ceramics and its influence on their behaviour under biological conditions, J. Mater. Chem. B, 2014, 2, 536-545.
[16] F. Babonneau, C. Bonhomme, S. Hayakawa and A. Osaka (2006). Solid State NMR Characterization of Nano-crystalline hydroxy-carbonate Apatite Using 1H-31P-13C Triple Resonance Experiments. MRS Proceedings, 984, 0984-MM06-05 doi:10.1557/PROC-984-0984-MM06-05.
[17] K.A. Hing, J.C. Merry, I.R. Gibson, L. Di-Silvio, S.M. Best, W. Bonfield, Effect of carbonate content on the response of human osteoblast like cells to carbonate substituted hydroxyapatite, Bioceramics, 12 (1999) 195–198.
[18] M. Palard, E. Champion, S. Foucaud, Synthesis of silicate hydroxyapatite Ca10(PO4)6−x(SiO4)x(OH)2−x, J Solid State Chem, 181 (2008) 1950–1960.
[19] S. Gomes, G. Renaudin, A. Mesbah, E. Jallot, C. Bonhomme, F. Babonneau, J.-M. Nedelec, Thorough analysis of silicon substitution in biphasic calcium phosphate bioceramics: a multi-technique study, Acta Biomater, 6 (2010) 3264–3274.
[20] G. Gasqueres, C. Bonhomme, J. Maquet, F. Babonneau, S. Hayakawa, T. Kanaya and A. Osaka, Revisiting silicate substituted hydroxyapatite by solid state NMR, Magn Reson Chem, 46 (2008) 342–346.
[21] S. Gomes, J.-M. Nedelec, E. Jallot, D. Sheptyakov and G. Renaudin, Silicon location in silicate-substituted calcium phosphate ceramics determined by neutron diffraction, Crystal Growth and Design, 11 (2011) 4017-4026.
[22] S. Hayakawa, A. Sakai, K. Tsuru, A. Osaka, E. Fujii, K. Kawabata, C. Jaeger, Preparation and characterization of boron-containing hydroxyapatite, Key Eng Mater, 361– 363 (2008)191–194.
[23] S. Barheine, S. Hayakawa, C. Jäger, Y. Shorosaki, A. Osaka, Effect of disordered structure of boron-containing calcium phosphates on their in vitro biodegradability, J Am Ceram Soc, 94 (2011) 2656–2662.
[24] S. Gomes, G. Renaudin, E. Jallot and J.-M. Nedelec, Structural characterization and biological fluid interaction of sol-gel derived Mg-substituted biphasic calcium phosphate ceramics, Applied Materials and Interfaces, 01 (2009) 505-513.
[25] SarahDiallo-Garcia, DanielleLaurencin, Jean-MarcKrafft, SandraCasale, Mark E.Smith, HélèneLauron-Pernot, and GuylèneCostentin, Influence of Magnesium Substitution on the Basic Properties of Hydroxyapatites, The Journal of Physical Chemistry C, 115 (2011) 24317-24327.
[26] D.Laurencin, C.Gervais, H.Stork, S.Krämer, D.Massiot, and F.Fayon , 25Mg Solid-State NMR of Magnesium Phosphates: High Magnetic Field Experiments and Density Functional Theory Calculations, The Journal of Physical Chemistry C, 116 (2012) 19984-19995.
[27] G. Renaudin, P. Laquerrière, Y. Filinchuk, E. Jallot and J.-M. Nedelec, Structural characterization of sol-gel derived Sr-substituted calcium phosphates with anti-osteoporotic and anti-inflammatory properties, Journal of Materials Chemistry, 18 (2008) 3593-3600. [28] G. Renaudin, E. Jallot and J.-M. Nedelec, Effect of strontium substitution on the composition and microstructure of sol-gel derived calcium phosphate, Journal of Sol Gel Science and Technology, 51 (2009) 287-294.
[29] P.E. Kazin, O.R. Gazizova, A.S. Karpov, M. Jansen, Y.D. Tretyakov, Incorporation of 3d-metal ions in the hexagonal channels of the Sr5(PO4)3OH apatite, Solid State Sciences, 9(2007) 82-87.
[30] P.T. Lieu, M. Heiskala, P.A. Peterson, Y. Yang, The roles of iron in health and disease, Mol. Aspects Med., 22 (2001) 1−87.
[31] W. Pon-On, N. Charoenphandhu, J. Teeraporpuntakit, J. Thongbunchoo, N. Krishnamra, I.M. Tang, Physicochemical and biochemical properties of iron-loaded silicon substituted hydroxyapatite (FeSiHAp), Mater. Chem. Phys., 141 (2013) 850-860.
[32] Q. Chang, D.L. Chen, H.Q. Ru, X.Y. Yue, L. Yu, C.P. Zhang, Toughening mechanism in iron-containing hydroxyapatite/titanium composite, Biomaterials, 31 (2010) 1493-1501. [33] W. Pon-On, S. Meejoo, I.M. Tang, Substitution of manganese and iron into hydroxyapatite: core/shell nanoparticles, Mater. Res. Bull., 43 (2008) 2137-2144.
[34] O. Kaygili, S.V. Dorozhkin, T. Ates, A.A. Al-Ghamdi, F. Yakuphanoglu, Dielectric properties of Fe doped hydroxyapatite prepared by sol gel method, Ceramics International, 40 (2016) 9395-9402.
[35] S. Panseri, C. Cunha, T. D’Alessandro, M. Sandri, G. Giavaresi, M. Marcacci, C.T. Hung, A. Tampieri, Intrinsically superparamagnetic Fe-hydroxyapatite nanoparticles positively influence osteoblast-like behaviour, J. Nanobiotechnology, 10 (2012) 32.
[36] Y. Li, J. Widodo, S. Lim, C.P. Ooi, Synthesis and cytocompatibility of manganese (II) and iron (III) substituted hydroxyapatite nanoparticles, J. Mater. Sci., 47 (2012) 754-763. [37] M. Iafisco, M. Sandri, S. Panseri, J.M. Delgado-Lopez, J. Gomez-Morales, A. Tampieri, Magnetic bioactive and biodegradable hollow Fe-doped hydroxyapatite coated poly(L-lactic) acid micro-nanospheres, Chem. Mater., 25 (2013) 2610-2617.
[38] V. S. Chandra, G. Baskar, R.V. Suganthi, K. Elayaraja, M.I.A. Joshy, W.S. Beaula, R. Mythili, G. Venkatraman, S.N. Kalkura, Blood compatibility of iron-doped nanosize hydroxyapatite and its drug release, Appl. Mat. Interfaces, 4 (2012) 1200-1210.
[39] A. Tampieri, T.a D’Alessandro, M. Sandri, S. Sprio, E. Landi, L. Bertinetti, S. Panseri, G. Pepponi, J. Goettlicher, M. Bañobre-López, J. Rivas, Intrinsic magnetism and hyperthermia in bioactive Fe-doped hydroxyapatite, Acta Biomaterialia 8 (2012) 843–851.
[40] H.C. Wu, T.W. Wang, J.S. Sun, W.H. Wang, F.H. Lin, A novel biomagnetic nanoparticle based on hydroxyapatite, Nanotechnology, 18 (2007) 165601−165619.
[41] Z. Stojanovic, L. Veselinovic, S. Markovic, N. Ignjatovic, D. Uskokovic, Hydrothermal synthesis of nanosized pure and cobalt-exchanged hydroxyapatite, Mater. Manuf. Process., 24 (2009) 1096−1103.
[42] R.D. Shannon, Revised effective ionic radii and systematic studies of interatomic distances in halides and chalcogenides, Acta Crystallogr. A32 (1976) 751–767.
[43] J. Rodriguez-Carvajal, PROGRAM FullProf.2k – version 3.20; Laboratoire Léon Brillouin (CEA-CNRS): Saclay, France, 2005; FullProf.2k manual available on http://www-llb.cea.fr/fullweb/fp2k/fp2k_divers.htm.
[44] L.B. Mc Cusker, R.B. Von Dreele, D.E. Cox, D. Louër, P. Scardi, Rietveld refinement guidelines. J Appl Cryst. 32 (1999) 36-50.
[45] R.J. Hill, Rietveld refinement round-robin. 1. Analysis of standard x-ray and neutron data for PbSO4. J Appl Cryst. 25 (1992) 589-610.
[46] N.V.Y. Scarlett, I.C. Madsen, L.M.D. Cranswick, T. Lwin, E. Groleau, G. Stephenson, M. Aylmore, N. Agron-Olshina, Outcomes of the International Union of Crystallography Commission on Powder Diffraction Round Robin on Quantitative Phase Analysis: Samples 2, 3, 4, synthetic bauxite, natural granodiorite and pharmaceuticals. J Appl Cryst. 35 (2002) 383-400.
[47] N. Newville IFFEFIT : interactive EXAFS analysis and FEFF fitting. J Synchrotron Rad. 8 (2001) 322-324.
[48] B. Ravel ATOMS: crystallography for X-ray absorption spectroscopist. J Synchrotron Rad. 8 (2001) 314-316.
[49] J.J. Rehr, J. Mustre de Leon, S.I. Zabinsky, R.C. Albers, Theoretical X-ray absorption fine structure standards, J Am Chem Soc 113 (1991) 5135-5140.
[50]M. Jiang, J. Terra, A.M. Rossi, M.A. Morales, E.M. Baggio Saitovitch, D.E. Ellis, Fe2+/Fe3+ substitution in hydroxyapatite: Theory and experiment, Phys. Rev. B 66 (2002) 224107.
[51] H.R. Low, N. Phonthammachai, A. Maignan, G.A. Stewart, T.J. Bastow, L.L. Ma, T.J. White, The Crystal Chemistry of Ferric Oxyhydroxyapatite, Inorg. Chem.,47 (2008) 11774-11782.
[52] E. Cottrell, K.A. Kelley, A. Lanzirotti, R.A. Fischer, High-precision determination of iron oxidation state in silicate glasses using XANES, Chemical Geology, 268 (2009) 167– 179.
Figure 1. Thermal evolutions of the HAp lattice parameters: (a) lattice parameters a, (b)
lattice parameter c, (c)the HAp unit cell volume, and (d)the Fe occupancyfactor attributed to the 2b Wyckoff site (0,0,0) (i.e. the adjacent 12igeneral position (x~0.12,y=0,z=0)for samples heat treated at 1100°C). The undoped series00T (black squares, dotted lines), and the Fe-doped series 15Fe-T (blue circles, solid lines), 25Fe-T (red diamonds, solid lines),50Fe-T (pink triangles, solid lines) and 75Fe-T (green stars, solid lines) are represented.
Figure 2.Structural details in the hexagonal channel of the HAp structure showing the
passage from the two-fold coordination for Fe3+ observed up to 1000°C (left) to the three-fold coordination reached at 1100°C (right); i.e. shift from the 2b Wycoff site located at (0,0,0) to the (0.12,0,0) position. Tetrahedra represent phosphate anions, large blue spheres represent calcium cation, green spheres represent hydroxyl site from HAp structure and orange spheres represent inserted iron cations. Small grey spheres illustrate the six equivalent (0.12,0,0) positions for Fe3+ cation around the 2b Wyckoff site. Dotted blue segment shows the short Fe3+-Ca2+ distance (2.23 Å) according to crystallographic description.
Figure 3.a)k-weighted amplitude of the Fourier transform uncorrected for phase shift for
samples from the 15Fe-T series (solid lines) and the two reference compounds (Fe3O4 and Fe2O3, dashed lines).b)fit in the R-space of the k3-weighted amplitude of the Fourier transform uncorrected for phase shift for sample 15Fe-1100.
Figure 4.57Fe Mössbauer spectra obtained at 300K and their decomposition after modelling, labels II, III, IVp, IVa, VIn and VIh are reported in Table 4.
Table 1. Results of the quantitative analyses (wt %) extracted from Rietveld refinements for
the undoped BCP series and the four Fe-doped BCP series. Standard deviations ( values from Rietveld treatments) are indicated in parentheses.
Samples Mineralogical composition (wt %)
HAp β-TCP α-CDP CaCO3 CaO α-Fe2O3 00Fe-500 91.2 (9) - 4.4 (3) 3.70 (15) 0.79 (9) - 00Fe-600 88.1 (9) 2.9 (3) 7.2 (3) 0.86 (9) 0.96 (6) - 00Fe-700 87.1 (9) 7.9 (3) 3.9 (3) 0.46 (3) 0.64 (3) - 00Fe-800 88.4 (9) 11.1 (3) - - 0.47 (3) - 00Fe-900 96.6 (6) 3.2 (3) - - 0.19 (3) - 00Fe-1000 98.4 (9) 1.5 (3) - - 0.11 (3) - 00Fe-1100 100 (-) - - - - - 15Fe-500 90.5 (4) 2.9 (1) 4.0 (1) 2.64 (6) - - 15Fe-600 85.7 (4) 7.3 (1) 7.0 (1) - - - 15Fe-700 79.2 (3) 17.8 (1) 3.0 (1) - - - 15Fe-800 87.7 (3) 12.3 (1) - - - - 15Fe-900 98.0 (3) 2.0 (1) - - - - 15Fe-1000 100 (-) - - - - - 15Fe-1100 100 (-) - - - - - 25Fe-500 88.8 (5) 2.8 (1) 4.6 (1) 3.7 (1) - 0.19 (5) 25Fe-600 83.3 (4) 8.7 (2) 8.0 (1) - - - 25Fe-700 71.5 (3) 25.6 (2) 2.9 (1) - - - 25Fe-800 76.4 (3) 23.3 (1) - - - 0.33 (4) 25Fe-900 89.3 (3) 10.1 (1) - - - 0.58 (3) 25Fe-1000 92.0 (3) 7.15 (9) - - - 0.85 (3) 25Fe-1100 88.2 (3) 11.8 (2) - - - - 50Fe-500 90.3 (5) 2.9 (2) 3.6 (2) 2.93 (7) - 0.28 (5) 50Fe-600 85.0 (4) 8.6 (1) 4.9 (1) 1.13 (7) - 0.32 (5) 50Fe-700 77.2 (3) 20.5 (1) 1.7 (1) - - 0.70 (5) 50Fe-800 84.8 (3) 13.9 (1) - - - 1.27 (4) 50Fe-900 95.9 (3) 2.24 (8) - - - 1.84 (4) 50Fe-1000 97.8 (4) - - - - 2.22 (4) 50Fe-1100 100 (-) - - - - - 75Fe-500 93.4 (5) 2.6 (2) 1.9 (2) 1.81 (7) - 0.22 (4) 75Fe-600 90.6 (5) 6.3 (2) 1.9 (2) 0.82 (8) - 0.42 (5) 75Fe-700 81.0 (4) 18.1 (2) - - - 0.94 (6) 75Fe-800 85.4 (3) 12.5 (1) - - - 2.08 (4) 75Fe-900 93.7 (4) 2.8 (1) - - - 3.51 (4) 75Fe-1000 95.5 (4) - - - - 4.50 (5) 75Fe-1100 99.3 (5) - - - - 0.71 (4)
Table 2. Rietveld refinement results on Fe:HAp phases for xFe-1100 samples. Standard
deviations ( values from Rietveld treatments) are indicated in parentheses.
Atom Site x y z Biso Occupancy
15Fe-1100
P63/m, Ca10Fe0.18(1)(PO4)6(OH)1.46O0.54, Z=1
a = 9.41749(3) Å, c = 6.88983(3) Å, V = 529.187(3) Å3 RBragg = 0.042, Rp = 0.034, Rwp = 0.045
Ca1 4f 1/3 2/3 0.0017(3) 0.77(2) 1(-) Ca2 6h 0.2461(1) 0.9927(2) 1/4 =Biso(Ca1) 1(-) P1 6h 0.3977(2) 0.3676(2) 1/4 0.64(3) 1(-) O1 6h 0.3272(3) 0.4834(4) 1/4 0.69(4) 1(-) O2 6h 0.5859(4) 0.4655(4) 1/4 =Biso(O1) 1(-) O3 12i 0.3411(3) 0.2561(3) 0.0698(3) =Biso(O1) 1(-) O4 4e 0 0 0.206(1) =Biso(O1) ½(-) Fe1 12i 0.099(3) 0(-) 0(-) =Biso(Ca1) 0.015(1)
25Fe-1100
P63/m, Ca9.92(1)Fe0.26(1)(PO4)6(OH)1.38O0.62, Z=1
a = 9.41499(4) Å, c = 6.89666(3) Å, V = 529.430(4) Å3 RBragg = 0.034, Rp = 0.030, Rwp = 0.040
Ca1 4f 1/3 2/3 0.0021(3) 0.91(2) 1(-) Ca2 6h 0.2466(2) 0.9930(2) 1/4 =Biso(Ca1) 0.986(2) P1 6h 0.3977(2) 0.3679(2) 1/4 0.70(3) 1(-) O1 6h 0.3268(4) 0.4824(4) 1/4 1.01(4) 1(-) O2 6h 0.5860(4) 0.4648(4) 1/4 =Biso(O1) 1(-) O3 12i 0.3401(3) 0.2551(3) 0.0697(3) =Biso(O1) 1(-) O4 4e 0 0 0.206(1) =Biso(O1) ½(-) Fe1 12i 0.117(2) 0(-) 0(-) =Biso(Ca1) 0.022(1)
50Fe-1100 P63/m, Ca9.84(1)Fe0.37(1)(PO4)6(OH)1.21O0.79, Z=1 a = 9.41395(4) Å, c = 6.90634(4) Å, V = 530.057(4) Å3 RBragg = 0.041, Rp = 0.030, Rwp = 0.040 Ca1 4f 1/3 2/3 0.0021(3) 0.99(2) 1(-) Ca2 6h 0.2468(2) 0.9928(2) 1/4 =Biso(Ca1) 0.974(2) P1 6h 0.3972(2) 0.3678(2) 1/4 0.81(4) 1(-) O1 6h 0.3258(4) 0.4822(4) 1/4 0.92(5) 1(-) O2 6h 0.5855(5) 0.4646(5) 1/4 =Biso(O1) 1(-) O3 12i 0.3398(3) 0.2541(3) 0.0703(2) =Biso(O1) 1(-) O4 4e 0 0 0.209(1) =Biso(O1) ½(-) Fe1 12i 0.118(2) 0(-) 0(-) =Biso(Ca1) 0.031(1)
75Fe-1100
P63/m, Ca9.77(1)Fe0.48(1)(PO4)6(OH)1.02O0.98, Z=1
RBragg = 0.039, Rp = 0.027, Rwp = 0.037 Ca1 4f 1/3 2/3 0.0023(3) 1.13(2) 1(-) Ca2 6h 0.2471(2) 0.9929(2) 1/4 =Biso(Ca1) 0.962(2) P1 6h 0.3966(2) 0.3672(2) 1/4 1.00(5) 1(-) O1 6h 0.3255(4) 0.4818(4) 1/4 1.02(5) 1(-) O2 6h 0.5846(5) 0.4639(5) 1/4 =Biso(O1) 1(-) O3 12i 0.3389(3) 0.2536(4) 0.0700(3) =Biso(O1) 1(-) O4 4e 0 0 0.210(1) =Biso(O1) ½(-) Fe1 12i 0.121(2) 0(-) 0(-) =Biso(Ca1) 0.040(1)
Table 3. Comparison of the Fe-local environment determined by XRPD Rietveld analysis
and fit of the k3-weighted EXAFS raw data for 15Fe-1100.
Fe shells XRPD Rietveld EXAFS fit Shift
Fe-X CN DFe-X (Å) DFe-X (Å) σ2 (Å2) Δ(dFe-X) (Å) Fe-O4 2 1.70 (2) 1.841 (2) 0.0035(3) +0.14 Fe-O3 (*) 1 1 1 1 1 1 2.05 (3) 2.39 (1) 2.826 (3) 3.32 (2) 3.57 (2) 3.64 (2) 1.941 (7) 2.45 (1) 2.90 (2) 3.60 (2) 3.6 (2) 4.0 (2) σ2 (PO4) = 0.0071(6) σ2 (PO4) σ2 (PO4) σ2 (PO4) σ2 (PO4) σ2 (PO4) -0.11 +0.06 +0.07 +0.28 +0.0 +0.4 Fe-Ca2 1 1 1 1 1 1 2.23 (2) 2.660 (3) 2.696 (2) 3.39 (2) 3.42 (2) 3.72 (3) 2.27 (1) 2.466 (6) 3.11 (3) 3.50(7) 3.65(2) 4.2(4) σ2 (Ca) = 0.0183(6) σ2 (Ca) σ2 (Ca) σ2 (Ca) σ2 (Ca) σ2 (Ca) +0.04 -0.20 +0.41 +0.11 +0.23 +0.5 Fe-P1 1 3.18 (2) 3.621 (8) 3.729 (5) 3.17(1) 3.6(1) 3.98(2) = σ2 (PO4) = σ2 (PO4) = σ2 (PO4) -0.01 +0.0 +0.25 (
Table 4. Refinement results on the iron hyperfine parameters extracted from the Mössbauer spectra. Sample IS (mm/s) ±0.02 (mm/s) ±0.02 QS/2 (mm/s) ±0.03 Bhf (T) ±.5 Populations % ±5 X-fold Fe coord. Assignment * Label in Figure 4 15Fe500 0.15 0.24 0.50 0.84 1.51 0.91 - - 23 77 2 4 linear HAp tetra phys. II IVp 15Fe1000 0.17 0.22 0.28 0.33 0.42 0.55 1.01 1.52 2.35 - - - 29 45 26 2 3 4 linear HAp triang. HAp tetra amorph. II III IVa 15Fe1100 0.15 0.21 0.27 0.36 0.40 0.36 0.90 1.46 2.28 - - - 23 70 7 2 3 4 linear HAp triang. HAp tetra amorph. II III IVa 50Fe1100 0.15 0.22 0.28 0.34 0.30 0.37 1.07 1.52 2.20 - - - 33 42 25 2 3 4 linear HAp triang. HAp tetra amorph. II III IVa 75Fe500 0.17 0.22 0.40 0.50 0.50 0.62 1.02 1.50 0.87 - - - 21 19 60 2 3 6 linear HAp triang. HAp octa nano-H II III VIn 75Fe1100 0.16 0.23 0.30 0.39 0.37 0.31 0.35 0.30 1.00 1.50 2.10 -0.23 - - - 51.9 22 33 22 23 2 3 4 6 linear HAp triang. HAp tetra amorph. octa hematite II III IVa VIh * - linear HAp corresponds the two-fold coordinated Fe3+ cation inserted in HAp.
- triang. HAp corresponds the three-fold coordinated Fe3+ cation inserted in HAp.
- tetra phys. corresponds the four-fold coordinated Fe3+ cation physisorbed at the HAp surface.
- tetra amorph. corresponds the four-fold coordinated Fe3+ cation located in the poorly crystalline HAp surface. - octa nano-H corresponds the six-fold coordinated Fe3+ from nanosized Fe2O3.
Figure SI1a. Exemples of XRPD raw data ( = 1.54184 Å, zoom showing the in the interval 15° < 2θ < 80° only) showing the iron content effect (top) and the temperature effect (bottom).
Figure SI1b.Exemples of Rietveld plots for 15Fe500 (top) and 75Fe1100 (bottom) samples( = 1.54184 Å) showing the experimental points (red crosses), the calculated patterns (black lines), the difference curves (blue lines) and the Bragg peak positions with phase’s indication (colored sticks).
Figure SI2. Mineral composition of the two main phases (HAp and β-TCP) as function of the sintering temperature for the five series: undoped
(black squares, dotted lines), 15Fe-T (blue circles, solid lines), 25Fe-T (red diamonds, solid lines), 50Fe-T (pink triangles, solid lines) and 75Fe-T (green stars, solid lines). Solid lines are guides for the eyes only, and standard deviations, reported in Table 1, are too weak to be visualized.
Figure SI3. Top: normalized EXAFS spectra at the Fe K edge (E0 = 7109 eV) for samples from the 15Fe-T series (solid lines) and reference compounds (Fe3O4 and Fe2O3, dashed lines). Bottom left: XANES part of the spectra. Bottom right: the extracted k-weighted EXAFS modulations.
Figure SI4. Total refined Fe content in the samples considering iron insertion into both HAp and -TCP phases and the Fe2O3 iron oxide for the four Fe-containing series (red circles, blue triangles, pink diamond and red stars for respectively the 15Fe-T, 25Fe-T, 50Fe-T and the 75Fe-T series. Dotted lines correspond to the targeted values.
Table SI1. Structural parameters of the HAp phase obtained by Rietveld refinements. Standard deviations ( values from Rietveld treatments) are indicated in parentheses.
Samples HAp structural parameters
a (Å) c (Å) V (Å3) Fe Occ (*) Refined composition 00Fe-500 9.4196 (1) 6.88419 (10) 528.94 (1) - Ca10(PO4)6(OH)2 00Fe-600 9.4197 (1) 6.88410 (9) 528.97 (1) - Ca10(PO4)6(OH)2 00Fe-700 9.41874 (9) 6.88356 (8) 528.846 (9) - Ca10(PO4)6(OH)2 00Fe -800 9.41954 (5) 6.88241 (4) 528.848 (5) - Ca10(PO4)6(OH)2 00Fe -900 9.42007 (3) 6.88100 (3) 528.799 (3) - Ca10(PO4)6(OH)2 00Fe -1000 9.42025 (2) 6.88127 (2) 528.840 (2) - Ca10(PO4)6(OH)2 00Fe -1100 9.42037 (2) 6.88176 (2) 528.891 (2) - Ca10(PO4)6(OH)2
15Fe -500 9,4168 (2) 6,8851 (1) 528,74 (2) 3.3 (3) Ca10Fe0.07(1)(PO4)6(OH)1.79O0.21 15Fe -600 9.4150 (2) 6.8855 (1) 528.58 (2) 3.5 (3) Ca10Fe0.07(1)(PO4)6(OH)1.79O0.21 15Fe-700 9,4170 (1) 6.8863 (1) 528,87 (1) 3.0 (3) Ca10Fe0.06(1)(PO4)6(OH)1.82O0.18 15Fe -800 9,41765 (7) 6,88338 (6) 528,71 (7) 4.1 (3) Ca10Fe0.08(1)(PO4)6(OH)1.76O0.24 15Fe -900 9,41951 (4) 6,88249 (4) 528,85 (4) 4.0 (3) Ca10Fe0.08(1)(PO4)6(OH)1.76O0.24 15Fe -1000 9,41886 (3) 6,88474 (3) 528,874 (4) 4.4 (3) Ca10Fe0.09(1)(PO4)6(OH)1.73O0.27 15Fe -1100 9,41749 (3) 6,88983 (3) 529,187 (3) 9.3 (3) (**) Ca10Fe0.18(1)(PO4)6(OH)1.46O0.54
25Fe -500 9.4146 (2) 6.8875 (2) 528.68 (2) 3.7 (3) Ca10Fe0.07(1)(PO4)6(OH)1.79O0.21 25Fe -600 9.4152 (2) 6.8882 (1) 528.81 (2) 3.3 (3) Ca10Fe0.07(1)(PO4)6(OH)1.79O0.21 25Fe-700 9,41704(1) 6.8876 (1) 528,97 (1) 2.8 (3) Ca10Fe0.06(1)(PO4)6(OH)1.82O0.18 25Fe -800 9,41914(8) 6.88451 (7) 528.964 (8) 4.1 (3) Ca10Fe0.08(1)(PO4)6(OH)1.76O0.24 25Fe -900 9.41969 (5) 6.88346 (4) 528.945 (5) 4.3 (3) Ca10Fe0.09(1)(PO4)6(OH)1.73O0.27 25Fe -1000 9.41703 (3) 6.88573 (3) 528.804 (4) 4.4 (3) Ca10Fe0.10(1)(PO4)6(OH)1.70O0.30 25Fe -1100(***) 9.41499 (4) 6.89666 (3) 529.430 (4) 13.1 (3) (**) Ca9.92(1)Fe0.26(1)(PO4)6(OH)1.38O0.62 50Fe-500 9.4171 (2) 6.8866 (2) 528.9 (2) 4.5 (3) Ca10Fe0.09(1)(PO4)6(OH)1.73O0.27 50Fe-600 9.4160 (2) 6.8868 (2) 528.8 (2) 3.3 (3) Ca10Fe0.07(1)(PO4)6(OH)1.79O0.21 50Fe-700 9.4167 (1) 6.8853 (1) 528.8 (1) 2.9 (3) Ca10Fe0.06(1)(PO4)6(OH)1.82O0.18 50Fe -800 9.41963 (8) 6.88463 (7) 529.028 (9) 4.8 (3) Ca10Fe0.10(1)(PO4)6(OH)1.70O0.30 50Fe -900 9.41946 (4) 6.88268 (4) 528.86 (5) 4.8 (3) Ca10Fe0.10(1)(PO4)6(OH)1.70O0.30 50Fe -1000 9.41866 (4) 6.88476 (3) 528.930 (4) 4.8 (3) Ca10Fe0.10(1)(PO4)6(OH)1.70O0.30 50Fe -1100(***) 9.41395 (3) 6.90634 (3) 530.057 (4) 18.5(3) (**) Ca9.84(1)Fe0.37(1)(PO4)6(OH)1.21O0.79 75Fe -500 9.4194 (2) 6.8854 (2) 529.06 (2) 4.9 (3) Ca10Fe0.10(1)(PO4)6(OH)1.70O0.30 75Fe -600 9.4180 (2) 6.8857 (2) 528.90 (2) 5.1 (3) Ca10Fe0.10(1)(PO4)6(OH)1.70O0.30 75Fe-700 9.4179 (2) 6.8849 (1) 528.86 (2) 5.0 (3) Ca10Fe0.10(1)(PO4)6(OH)1.70O0.30 75Fe -800 9.4199 (1) 6.88376 (8) 529.00 (1) 5.0 (3) Ca10Fe0.10(1)(PO4)6(OH)1.70O0.30 75Fe -900 9.41975 (5) 6.8828 (4) 528.901 (5) 5.1 (3) Ca10Fe0.10(1)(PO4)6(OH)1.70O0.30 75Fe -1000 9.41819 (4) 6.88516 (4) 528.907 (5) 4.6 (3) Ca10Fe0.09(1)(PO4)6(OH)1.73O0.27
75Fe -1100(***) 9.41099 (5) 6.91722 (5) 530.558 (5) 23.9 (3) (**) Ca9.77(1)Fe0.48(1)(PO4)6(OH)1.02O0.98 * Fe occupancy in the interstitial 2b Wyckoff site.
** occupancywith Fe atoms shifted from the 2b Wyckoff site (0,0,0) to the adjacent 12i general position (x~0.12,y=0,z=0)
*** calcium deficient hydroxyapatite were considered for Rietveld refinement performed on samples heat treated at 1100°C. Calcium vacancies have been observed into the Ca2 crystallographic site for 25Fe -1100, 50Fe -1100 and 75Fe -1100 samples.