HAL Id: hal-01291797
https://hal.archives-ouvertes.fr/hal-01291797v2
Submitted on 30 Mar 2016
HAL is a multi-disciplinary open access
archive for the deposit and dissemination of
sci-entific research documents, whether they are
pub-lished or not. The documents may come from
teaching and research institutions in France or
abroad, or from public or private research centers.
L’archive ouverte pluridisciplinaire HAL, est
destinée au dépôt et à la diffusion de documents
scientifiques de niveau recherche, publiés ou non,
émanant des établissements d’enseignement et de
recherche français ou étrangers, des laboratoires
publics ou privés.
Lesions in Regular Colonoscopy
Pablo Mesejo, Daniel Pizarro, Armand Abergel, Olivier Rouquette, Sylvain
Beorchia, Laurent Poincloux, Adrien Bartoli
To cite this version:
Pablo Mesejo, Daniel Pizarro, Armand Abergel, Olivier Rouquette, Sylvain Beorchia, et al..
Computer-Aided Classification of Gastrointestinal Lesions in Regular Colonoscopy. IEEE
Transactions on Medical Imaging, Institute of Electrical and Electronics Engineers, 2016, 35 (9), pp.2051
-2063. �10.1109/TMI.2016.2547947�. �hal-01291797v2�
Computer-Aided Classification of Gastrointestinal
Lesions in Regular Colonoscopy
Pablo Mesejo, Daniel Pizarro, Armand Abergel, Olivier Rouquette, Sylvain Beorchia, Laurent Poincloux
and Adrien Bartoli
Abstract—We have developed a technique to study how good computers can be at diagnosing gastrointestinal lesions from regular (white light and narrow banded) colonoscopic videos compared to two levels of clinical knowledge (expert and begin-ner). Our technique includes a novel tissue classification approach which may save clinician’s time by avoiding chromoendoscopy, a time-consuming staining procedure using indigo carmine. Our technique also discriminates the severity of individual lesions in patients with many polyps, so that the gastroenterologist can directly focus on those requiring polypectomy. Technically, we have designed and developed a framework combining machine learning and computer vision algorithms, which performs a virtual biopsy of hyperplastic lesions, serrated adenomas and adenomas. Serrated adenomas are very difficult to classify due to their mixed/hybrid nature and recent studies indicate that they can lead to colorectal cancer through the alternate serrated pathway. Our approach is the first step to avoid systematic biopsy for suspected hyperplastic tissues. We also propose a database of colonoscopic videos showing gastrointestinal lesions with ground truth collected from both expert image inspection and histology. We not only compare our system with the expert predictions, but we also study if the use of 3D shape features improves classification accuracy, and compare our technique’s performance with three competitor methods.
Index Terms—Virtual Biopsy; Tissue Classification; Colonos-copy; Ensemble Classifiers; Structure-from-Motion; Computer-aided Decision Support System; Colorectal Cancer.
I. INTRODUCTION
C
ANCER is a leading cause of death worldwide,ac-counting for 8.2 million deaths in 2012. In particular, colorectal cancer is concerned with the large intestine (colon), the lower part of the digestive system, and the rectum (the last inches of the colon), and it is one of the most commonly diag-nosed malignant neoplasms across genders (around 10% of all cases) [1]. Even if colonoscopy is widely used for colorectal cancer detection and prevention, and it is considered nowadays as the gold standard for colon screening [2], [3], there are still open challenges to overcome, such as the reduction of the missing rate [4], [5]. A polyp is an abnormal growth of tissue projecting from a mucous membrane, and some types of polyps (e.g. adenoma) are premalignant conditions for colorectal cancer. Endoscopic resection during colonoscopy can prevent colorectal cancer development.
P. Mesejo, D. Pizarro and A. Bartoli are with ISIT-UMR 6284 CNRS, Universit´e d’Auvergne, Clermont-Ferrand, France. P. Mesejo is also with INRIA Grenoble Rhˆone-Alpes, LJK, Grenoble, France e-mail: [email protected]. D. Pizarro is also at Department of Electronics, Universidad de Alcal´a, Alcal´a de Henares, Spain
S. Beorchia is gastroenterologist in the Clinique de la Sauvegarde, Lyon, France.
L. Poincloux, O. Rouquette and A. Abergel are with the Department of Gastroenterology, CHU Estaing, Clermont-Ferrand, France.
The main motivation for designing a computer-aided de-cision support system in colonoscopy is to assist a medical expert in improving the accuracy or promptness of medical diagnosis. It may also be used as an educational resource, speeding up the learning curve of medical students. The method we developed may provide a valuable tool to fulfill the main recommendations included in the guideline of the European Society of Gastrointestinal Endoscopy (ESGE) [6], especially the ones related to assist in real-time the optical diagnosis of colorectal polyps to replace histopathological diagnosis.
In addition, one of the aims of developing a (semi)automatic classification system is to distinguish lesions which should be biopsied from those which should be directly removed during colonoscopy. A tool to perform virtual biopsy could be of great help to select lesions that must be directly resected (instead of performing biopsy), and thus avoid waiting for the histopathology to decide the therapeutic strategy. Furthermore, in a real clinical environment, virtual biopsy could help one to discriminate the severity of individual lesions in patients with many polyps, and the gastroenterologist could then focus on those requiring polypectomy.
The clinicians, in order to perform an initial diagnosis of a neoplastic lesion in real-time, usually follow three major clas-sification systems: i) Paris [7], ii) Kudo [8] and iii) Sano [7] classification systems. They vary in terms of number of classes and the cues used for classification, such as morphology, mucosa texture patterns or size. Kudo classification requires chromoendoscopy to stain the mucosa, being expensive in terms of both cost, time and requiring colonoscopes with magnification. As reference, one vial of indigo carmine costs approximately 28e and is used for a single lesion (four vials are necessary to stain the whole colon). The Sano classification makes use of Narrow Band Imaging (NBI), a virtual chromoendoscopy approach. NBI is a very well-established technique that uses light of specific blue and green wavelengths. Because the peak light absorption of hemoglobin occurs at these wavelengths, blood vessels will appear dark.
ESGE suggests that virtual chromoendoscopy (NBI,
FICE [9], i-SCAN [10]) and conventional chromoendoscopy can be used under strictly controlled conditions for real-time optical diagnosis of diminutive (smaller than 5mm) colorectal polyps to replace histopathological diagnosis.
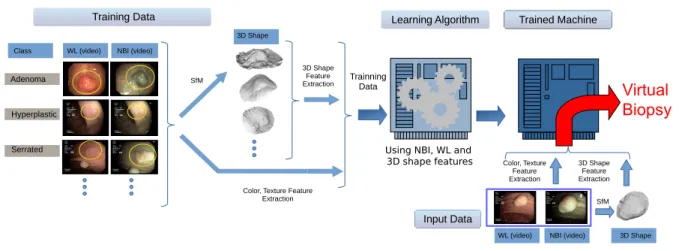
We propose a novel framework for virtual biopsy that classifies gastrointestinal lesions of any size (see Figure 1) using cues extracted from endoscopic images, mainly color, texture and morphology (3D shape) of the lesion. We extract 3D shape using Structure-from-Motion (SfM) [11], [12] that
Training Data
WL (video) NBI (video)
3D Shape
Adenoma Hyperplastic Serrated
Learning Algorithm Trained Machine
SfM
SfM WL (video) NBI (video) 3D Shape
Input Data
Virtual
Biopsy
Class
Using NBI, WL and 3D shape features
Color, Texture Feature Extraction Trainning Data 3D Shape Feature Extraction 3D Shape Feature Extraction Color, Texture Feature Extraction
Fig. 1. General diagram of our system to perform virtual biopsy. The training data containing different videos from each class is used by the learning algorithm to generate a trained machine. This trained machine will be able to classify previously unseen colonoscopic videos. The framework receives as input two videos, one using narrow band imaging (NBI) and another using white light (WL). For both we extract color and texture features that, together with the 3D shape reconstructed using Structure-from-Motion (SfM), allow us to classify the lesions.
takes as input a small video sequence where the lesion is seen from different points of view. Our approach uses white light (WL) and NBI to enhance texture, as needed in SfM [13]. This novel approach is based on the following clinical and scientific assumptions. First, we avoid the use of both magnification and staining with indigo carmine. On the one hand, magnification is not available in all current colonoscopes. On the other hand, chromoendoscopy is time consuming and inconvenient, as it needs an experienced endoscopist to interpret the images during the procedure. It also requires preparation time and it causes collateral distortion of the adjacent mucosal field [14], [15]. Second, the colonoscopy modalities we use are WL and NBI in conventional flexible endoscopes. Both are very common and cheaper than any other techniques. So, advances obtained using these modalities can have a higher impact on the quality of service offered to patients worldwide. We have based all our decisions on both the Paris and Sano classifi-cations, since NBI or FICE are most frequently integrated in the current endoscopes. In fact, virtual chromoendoscopy with NBI, FICE and i-Scan seem to have a diagnostic performance comparable to conventional chromoendoscopy for characteriz-ing sporadic adenomas and cancer [16]
The main purpose of this research is to differentiate between serrated adenomas, hyperplastic polyps and adenomas, and, very importantly from the clinical point of view, to differenti-ate between lesions that need resection (adenoma and serrdifferenti-ated adenoma) and those that generally do not (hyperplastic) [17]. It is actually very difficult to recognize the mixed polyps called serrated adenomas [18]. They are difficult to classify, and are probably missed by many endoscopists, since they present hybrid characteristics of adenoma and hyperplastic. Also, the hypothesis of a serrated carcinogenetic pathway has been increasingly accepted [19]. Based on this hypothesis, approximately 8-15% of all colorectal cancers may have orig-inated from serrated adenomas [20]. Therefore, it is important to accurately identify these lesions and differentiate them from those lesions with less malignant potential, such as
hyperplastic polyps. Serrated polyps represent more than a third of colorectal polyps. According to Bosman et al. [21], serrated polyps include three types of lesions: hyperplastic polyps (which never present dysplasia), sessile serrated ade-noma/polyps and traditional serrated adenomas. The main dif-ference between these three subgroups resides in the location of the proliferation zone within ectopic crypts [22]. Although it is thought that the main route for developing colorectal cancers is the adenoma-carcinoma sequence, the serrated pathway is an important alternative pathway to the development of colorectal cancers involving different molecular mechanisms of those involved in traditional adenomas. Sessile serrated polyps and traditional serrated adenomas are commonly recognized as precancerous lesions that could explain the occurrence of inter-val cancers, whereas hyperplastic polyps are not. The serrated pathway involves progression from sessile serrated polyps and traditional serrated adenomas, which are morphologically and pathologically similar to hyperplastic polyps. In this paper the category “serrated adenoma” includes both sessile serrated polyps and traditional serrated adenoma, while hyperplastic polyps are considered as an independent class. In Figure 2 we show several examples of the three categories of lesions used in this paper. A de no m a H yp er pl as tic S er ra te d
Fig. 2. Examples of images captured with NBI for the classes adenoma, hyperplastic and serrated.
Although there exist publicly available image databases containing medical images or videos from the gastrointestinal tract (such as http://polyp.grand-challenge.org/), almost every research group performs their experiments on their own image database. Consequently, many works cannot be compared directly, and it becomes nearly impossible to verify the results obtained or to assess the quality of the images used. Another problem, which limits the usability of these databases, is the fact that none of them provides a detailed ground truth for the respective images and videos, and a quite limited number of images is used in some approaches. This is a severe problem, since results based on few images must be considered to have a limited significance [23]. In this paper, we also introduce and share with the scientific community the dataset used in our experiments. To trigger further research in computer-aided gastrointestinal lesions classification, colonoscopy videos with ground truth of this study are publicly available at http: //www.depeca.uah.es/colonoscopy dataset/. This carefully col-lected dataset is composed of colonoscopy videos (recorded with both NBI and WL), the histology (classification ground truth), the endoscopist’s opinion (to allow the comparison of the output of a particular system with the opinion of a human specialist including two levels of knowledge: 4 experts and 3 beginners), and the camera calibration (necessary for performing the 3D reconstruction of the lesions if required).
The main contributions of this research paper are:
• A novel virtual biopsy framework that performs the clas-sification of gastrointestinal lesions. Our method avoids changing neither the medical protocol nor the hardware. The only requirement is to have NBI lighting, which is now a standard feature in colonoscopes. The pro-posed framework combines advanced methods in ma-chine learning and computer vision.
• Together with the result of virtual biopsy, the output of our system includes the 3D shape reconstruction of the lesion that can further help the doctor in the diagnosis, in the same way that 3D visual information is successfully used in other areas of medical research [24], [25], [26].
• Collection and publication of a colonoscopic video database, where researchers from different fields (com-puter scientists, biomedical engineers) can test their meth-ods, and where medical students can evaluate their ability to recognize gastrointestinal lesions. The dataset contains colonoscopic videos recorded using WL and NBI, the ground truth (from both endoscopist image inspection and histology), and camera calibration.
The paper is structured as follows. First, in Section II, we introduce the theoretical background necessary to understand our research, together with the related works that can allow one to contextualize the state-of-the-art. After that, in Section III, we present the dataset used in our experiments, as well as the protocol followed to collect it and its inherent characteristics. Section IV describes the proposed method to classify the lesions and to perform their 3D reconstruction. Finally, Section V presents the experimental results followed in Section VI by the conclusions and future work.
II. THEORETICALBACKGROUND ANDRELATEDWORK
A. Ensembles of Classifiers
This research work is concerned with the development of al-gorithms that allow computers to learn and to classify colono-scopic videos (see Figure 1). Classifier combination is an active area of research in machine learning and pattern recog-nition. Many studies show the advantages of the combination of several classifiers over individual classifier models [27]. Ensemble Classifiers (ECs) use multiple classification methods trained on different data subsets or feature subsets. ECs are currently among the state-of-the-art classifier systems [28]. They were found to increase the classification margin, hence reduce the chances of a classification mistake [29], exploit diversity to recover from individual classifiers’ mistakes [30], [31] and reduce both the bias and the variance of a single classifier model [32], [33]. There are two main types of en-sembles: bootstrap aggregating, often abbreviated as bagging, and boosting. The former involves having each model in the ensemble using a randomly drawn subset of the training set, while the latter involves incrementally building an ensemble by training each new model instance to emphasize the training instances that previous models mis-classified.
B. Structure-from-Motion
Images represent the 2D projection of 3D objects. A fundamental problem in computer vision is to recover 3D information from images. During the last three decades sci-entists have developed a solid framework for understanding and modeling the multiple-view geometry of rigid objects. One of the main results is the SfM method [11], [12], where the scene’s geometry is recovered from images taken by a moving camera and assuming the scene’s geometry remains rigid. SfM is now considered a mature technology, and is included in commercial applications, such as large scale 3D mapping and augmented reality. In addition to the rigidity assumption, existing SfM techniques require the scene to contain rich texture information. Texture allows the algorithms to automatically match image features across different views. Several off-the-shelf SfM implementations are available [34], [35], allowing one to reconstruct a dense mesh of an object in less than a minute.
C. Previous Related Work
It has been known that polyp classification using color offers an improvement over classification based solely on gray-level texture [36], and that a lesion classification process that uses depth and color image features has a higher classification rate than the same process using only color features in skin lesion problems [37]. However, there are no works that use the 3D re-constructed shape of the lesion to analyze conventional flexible colonoscopy video sequences (strangely, because it would be a quite natural trend attending to the fact that human operators also use 3D cues to perform their diagnosis): the assessment of the malignant potential of polyps is still commonly performed on the exclusive basis of texture features [23]. The majority of the works dealing with shape are essentially 2D [38], [39],
[40], [41] or, when 3D, are focused on CT colonography [42], [43], [44]. However, CT colonography or virtual colonoscopy is not especially attractive since a colonoscopy is anyway necessary if polyps are found and, secondly, texture plays an important role in detecting polyps/cancer and this does not show up in virtual colonoscopy. Furthermore, in most cases the machine learning methods used to perform the lesion classification are not state-of-the-art, relegating more sophisticated approaches to a very small number of scientific works [23]. Importantly, there are no previous works interested in the automatic classification of serrated adenomas. Finally, many novel colonoscopy image analysis applications rely on hardware changes that can complicate their use and reduce their applicability [45], [46], [47].
III. DATASET
The dataset we have built contains 76 colonoscopy videos recorded following a very simple protocol (identical to the usual protocol followed by the clinicians in their daily prac-tice): the clinician has to record the lesion from different viewpoints using both NBI and WL. The length of the video does not need to be larger than 30 seconds. The main idea is to orbit around the lesion, recording it from different angles in order to allow us to apply the SfM algorithm. Every video is associated with ground truth from histopathology, the human operators’ opinion (including 4 experts and 3 beginners), and the calibration of every recording system (Olympus Exera-CV180 and Olympus Exera-CV190) necessary for the 3D shape reconstruction. The dataset includes 15 serrated ade-nomas, 21 hyperplastic lesions and 40 adenoma.
The distribution of lesions in our dataset could be consid-ered as a good approximation to the actual distribution of the different types of polyps [48]. However, it is important to notice that serrated adenomas are a recently described entity, and their prevalence is not well established. In fact, historical classical series (postmortem examination) only deal with hyperplastic polyps and adenomas.
Following the usual ethics protocol, all the patient-related information in our dataset has been suitably removed, includ-ing intervention dates and clinicians names, both in the video frames and the file properties. Accordingly, the procedures of the study received ethics approval on the 27th of June 2014 from the relevant regional institutional ethics committee (IRB00008526), providing the following reference number: 2014 / CE41.
In order to compare the performance of a machine learning approach with human operators, the knowledge of two types of human operators (beginner and expert) was also included in our database. We define a beginner operator as a gas-troenterologist with 4 or less years of experience performing colonoscopy, while an expert is a gastroenterologist with 8 or more years of experience performing colonoscopy. Our dataset has been evaluated by 4 expert and 3 beginner operators. It is very important to highlight that the difficulty of correctly classifying the lesions for a human operator is larger in our case than in a real scenario. In the latter, the clinician can freely move around the lesion and has knowledge about the
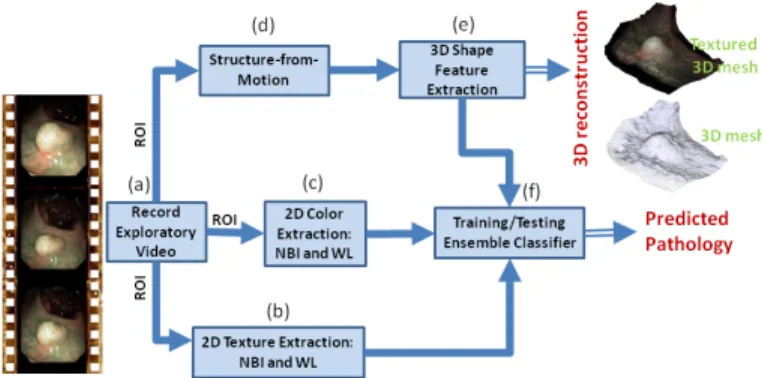
Fig. 3. Main pipeline of our method for classification of lesions. (a) is the input of our method which consists of a sequence of images showing the target lesion from different angles. From (a), in (b) and (c) we extract color and texture image features respectively. In (d) we use SfM to reconstruct in 3D the lesion and with (e) we extract 3D shape features. All image cues are introduced in a machine learning classifier (f) that predicts the pathology to which the lesion belongs. ROI stands for Region-Of-Interest.
location of the lesion within the colon. Of course, classification accuracy could be improved by introducing extra information like the position of the lesion (for instance, sessile serrated adenomas are usually located in right colon, while hyperplastic polyps are mainly found in left colon) [49], [50], but this was not the main point of this research project and we wanted to give the same information to both the machine learning system and the human operators. The videos were recorded using NBI and WL, and do not include chromoendoscopy. The whole dataset will be shared through the webpage of our research lab: http://www.depeca.uah.es/colonoscopy dataset/
IV. A COMPUTER-AIDEDCLASSIFICATIONSYSTEM OF
GASTROINTESTINALLESIONS
The block diagram of Figure 3 displays the main building blocks of our system. Every building block will be explained in detail in the following sections.
A. Record Exploratory Video
The only input to the system is an exploratory video recorded by the clinician. This exploratory video lasts approx-imately between 30 seconds and 1 minute, and records the lesions from different points of view, orbiting slowly around them, using both NBI and WL. This video does not imply any change in the usual medical protocol, since it is very similar to the one used in daily practice. Every second recorded using the colonoscope consists of 30 frames of 768 × 576 pixels. However, any other video format may be used.
B. 2D Texture Extraction
For texture feature extraction just a single region of interest from a frame where the lesion is visible is necessary. This region of interest does not need to be very accurate and we de-fined it manually as a simple polygonal region. There also exist automatic segmentation methods such as [40], [44], which may potentially be more accurate than a manual definition of the region of interest. The level of accuracy that these methods may provide was not needed in our approach. Also,
and more importantly, an extremely easy protocol could be defined to remove the need of an automatic polyp segmentation method, such as asking the doctor to move the endoscope until the polyp is inside a predefined region in the image (like, approximately, the center of the image). Maybe, the latter would be the best option since completely automatic polyp segmentation is an open problem and it is especially difficult when multiple polyps are present.
We use Invariant Local Binary Patterns (ILBP) [51] and Invariant Gabor Texture Descriptors (AHT) [52] as texture descriptors. Both have been selected due to their robustness to monotonic gray-scale changes caused, for example, by illumination variations, and due to their rotational invariance. Furthermore, the second method has already been successfully used in the classification of gastroenterology images [52]. Gray-level co-occurrence matrix (GLCM) or Histograms of Oriented Gradients (HOG) descriptors are not used because those features, in their standard and commonly used version, are not invariant to rotation or scale changes in the texture [53], [54].
Regarding specularity removal, Mallick’s and Yoon’s meth-ods [55] obtained clearly unsatisfactory results due to an extremely smoothed output. Finally, we left specularities in the texture and color extraction, since they are directly related to the shape and texture of the lesion: a different morphology will be associated with a different specular pattern. The relationship between shape and specularities when camera and light properties are known has been extensively studied in the literature [56], [57], [58]. The light source in endoscopy is very close to the center of projection of the camera, so a pixel classified as a specularity implies that the surface normal at that point is collinear with the optical beam. Therefore, lesions with shape irregularities produce different specular patterns.
C. 2D Color Extraction
For color feature extraction, again, just a single frame is necessary. Four state-of-the-art color descriptors have been used to perform the classification: Color Naming [59], Dis-criminative Color Descriptors [60], Hue [61] and Opponent [61]. Also, color GLCM has been included due to its good performance in the classification of colorectal polyps [62], and GLCM has been successfully applied to other biomed-ical image modalities [63], [64]. Color Naming [59] applies an adapted version of probabilistic latent semantic analysis to find color name distributions, and it has shown to be one successful approach for the automatic learning of visual attributes. Discriminative color descriptors optimize the dis-criminative power with respect to a classification problem by minimizing the drop of mutual information. According to [60] they outperform existing photometric invariants and combined with shape descriptors obtain excellent results in recognition tasks. Opponent and Hue [61] are color histograms robust to photometric and geometrical changes, and to im-age quality loss (Hue descriptor is recommended for scenes with saturated colors, while the Opponent angle descriptor is mainly recommended for scenes with less saturated colors and especially in the presence of diffuse lighting). Finally, the
colorGLCM method produces, for each channel of the patch, eleven statistical measures: seven first order measures (mean, standard deviation, skewness, kurtosis, entropy, coefficient of variation and energy) and four second order measures (contrast, correlation, energy and homogeneity) using an offset of 315◦ as GLCM spatial relationship.
The reason to treat separately color and texture descriptors can be found in [65], where the classification performance of color indexing methods is compared to gray-scale and color texture methods, and to combined color and texture methods, in static and varying illumination conditions. Based on those results, the authors argued that color and texture are separate phenomena that can, and should, be treated individually. D. 2D Shape Features
2D shape features have been previously used for endoscopy image analysis [66], [67], mainly the edge orientation his-tograms and the region-based shape descriptors proposed in the MPEG-7 standard. These 2D descriptors do not require the segmentation of the polyp’s shape in the image, and they are computed from the image patch containing the polyp. Therefore, they mainly include textural information, which is already captured in previous features. In fact, these 2D shape descriptors have not been introduced in our pipeline since preliminary tests showed that classification results tend to be worse when adding them.
E. Dense 3D Reconstruction of the Polyp
We rely on SfM [12] to compute a dense 3D model of the polyp and the surrounding tissue (see Figure 3), from the exploratory video. To find accurate and stable reconstructions, current SfM methods need the geometry to be rigid, the scene to be highly textured and the internal camera parameters to be calibrated. We give insights about how we tackle these issues in our application: i) Rigid Geometry: Even if colon tissues deform naturally (due to e.g. peristalsis or external compression of the patient’s abdomen), we assume that during the exploratory video deformations are small near the target polyp and the rigidity assumption is accurate enough. The presence of deformations can be detected in SfM through several indicators, such as high re-projection errors between the model and the measurements or low rate of inliers. In a clinical scenario this can be used to ask the specialist to repeat reconstruction, keeping the polyp to span as much as possible the inside of a predefined area of the image while moving the camera. This protocol prevents deforming parts of the intestine to be included in SfM. This protocol was not active during registration of our dataset so a rough polyp segmentation was performed manually. Segmentation due to deformations was necessary only in less than 8% of the lesions. ii) Textured Surfaces: Colon tissue is not strongly textured in general which affects the quality of 3D reconstruction. With NBI lighting, near to surface vessel patterns are highlighted which in general improves textural contents. NBI is proved to help considerably SfM to find a better reconstruction [13]. iii) Camera Calibration: Knowing in advance camera calibration parameters improves the accuracy and stability of SfM. We
model the colonoscope camera with the pin-hole camera model including distortion parameters (tangential and radial) as de-fined in [68]. The calibration procedure consists of showing the camera a checkerboard pattern from several positions and orientations [69]. The calibration parameters are obtained by registering the images and using iterative optimization [70]. The two models of colonoscope used in the paper were calibrated before the intervention using this procedure.
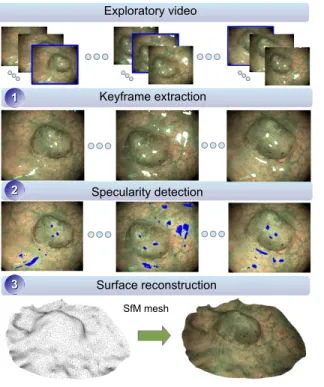
For SfM we use the PhotoScan software [34], that au-tomatically reconstructs a dense textured 3D mesh of the polyp from a collection of images. Figure 4 shows the steps we propose to reconstruct a lesion with SfM: 1) Keyframe extraction.we divide the exploratory video in N intervals and we extract a frame from each interval. We assume the endo-scope continuously moves around the lesion showing different viewpoints. We select for each interval the frame with the least amount of motion blur. This is done by filtering the images using a 7×7 Laplacian filter and selecting the frame with the highest variance of all pixels after filtering. Specularity detection.Specular areas saturate the image and change their position and shape on the surface when the camera moves. This produces undesirable artifacts in dense SfM methods. We segment the regions using a simple threshold min(µ+2σ, 255) where µ and σ are the mean and standard deviation of the image intensity and 255 is the maximum intensity level in the image. 3) Surface reconstruction. We apply PhotoScan to the set of key-frames, where the specular regions and additional screen text were segmented out. As a result we obtain a textured surface that is decimated to around 104 faces using
quadric edge collapse decimation [71]. The surface is cleaned to remove isolated pieces and we apply one round of Laplacian smoothing to reduce high frequency deformations caused by image noise and compression artifacts.
It is important to highlight that SfM reconstruction is up to scale and thus the original size of the lesion cannot be recovered.
F. 3D Shape Features Extraction
We characterize every polyp with a numerical fingerprint or signature, obtained from its reconstructed 3D structure. In this context, shape signatures need to be invariant to scale, rotation and translation of the polyp’s 3D shape. This requirement is important as SfM gives an up-to-scale reconstruction of the surface and, when comparing two polyps, we do not need them to be registered. We propose two methods to describe a polyp’s shape.
1) Surface Signatures with Shape-DNA: Thanks to dense SfM, we have a description of the polyp’s 3D surface, using a triangular mesh. This allows one to compute surface mag-nitudes, such as normals or curvatures. In particular we use Shape-DNA [72] features, based on the spectra of the Laplace-Beltrami [73] operator on a surface. Shape-DNA is invariant to scale, rotation and translation and it can easily be computed from triangulated meshes.
2) 3D Cloud Signatures with Kernel-PCA: In some cases, mainly due to the lack of texture, SfM gives a reconstruction with a poor mesh resolution. In those cases Shape-DNA might
Keyframe extraction Specularity detection Exploratory video Surface reconstruction SfM mesh 1 1 2 2 3 3
Fig. 4. Steps required for 3D reconstruction using SfM. The first row shows all frames in the exploratory video divided in several intervals. Inside each interval we highlight in blue the selected keyframe which corresponds to the sharpest frame in the interval.
not be accurate enough. We use a signature that describes the shape of a cloud of 3D points, without relying on a mesh triangulation. Recent studies have proposed the so-called Kernel-PCA [74] signature for the recognition of shapes using depth sensors [75]. Given a set of 3D points one computes the so-called kernel matrix, generally using a Gaussian kernel. Then the Kernel-PCA descriptor is composed of the L largest eigenvalues of the kernel matrix. Kernel-PCA eigenvalues are invariant to rotation and translation. To gain scale invariance one has to normalize the eigenvalues by their average.
We concatenate both Shape-DNA and Kernel-PCA to create a single 3D shape descriptor that we use for classification. All features, together with their corresponding dimensionality, are displayed in Table I.
Descriptor Dimensionality 2D TEXTURE AHT (Invariant Gabor Texture) 166
Rotational Invariant LBP 256 2D COLOR Color Naming 16
Discriminative Color 13 Hue 7 Opponent 7 color GLCM 33 3D SHAPE Shape-DNA 100 Kernel-PCA 100 TABLE I
SUMMARY TABLE INCLUDING ALL FEATURE DESCRIPTORS AND THEIR
G. Training/Testing using Ensemble Classifiers
1) Classifier Design: In our research we take advantage from ECs, an active area of research in Machine Learning and Pattern Recognition but barely used in real-world clinical applications. Two different ECs have been used and compared in this paper: i) Random Forests (RF) [76] and ii) Random Subspaces (RS) [77].
We have chosen these two ECs because they are able to handle a very large number of input variables without over-fitting (we have considered a large-scale version of RS [78]), they are usually fast and easy to implement, and they produce highly accurate predictions. RF and RS are among the most accurate general-purpose learners available (ranked within the 5 best classifiers in recent comparisons [28]). These two ap-proaches have seldom been used in colonic polyp classification or virtual biopsy in gastroenterology [23]. We show in this paper that they are powerful tools that allow us to obtain superior classification performance than existing state-of-the-art and human experts.
We have also included a classical SVM classification method in the experiments to have a standard comparative reference with EC’s. We use linear kernel SVMs, L1 soft-margin SVM classifier to find the separating hyperplane, 0.5 as regularization parameter and a one-vs-all strategy to perform the multiclassification.
2) Validation Model: The validation technique used in this paper has been Leave-One-Lesion-Out owing to our dataset’s medium size. According to this validation technique, every model is trained using all data patterns but one, and is tested using the pattern that was previously isolated. However, since more than 80% of the lesions belong to completely different patients, we are implicitly applying a Leave-One-Patient-Out strategy. This is quite realistic in clinical practice as previous images of the patient are rarely used during examination [79]. The final output of the whole system is, on the one hand, the class to which the tissue belongs and, on the other hand, the result of the 3D reconstruction from SfM.
Neither normalization nor dimensionality reduction were used during experimentation. On the one hand, a previous empirical study showed that the best results were consistently obtained by avoiding data normalization and dimensionality reduction (feature extraction using PCA) in both RF and RS. On the other hand, theoretical studies support this decision since, for instance, RF is invariant to monotonic transfor-mations of individual features (RF is not sensitive to any dimension-wise normalization) and RS has been successfully applied to classification problems in which the number of features is much larger than the number of training objects, such as fMRI [28] or gene expression data [80]. Both RF and RS present variability and usually they require several runs to improve stability. However in this paper we use a large number of individual ensembles (1000 in RF and 200 in RS). This drastically reduces the variability, with a standard deviation of the accuracy for 1000 trees of approximately 0.005. We thus only execute one run per method.
V. EXPERIMENTALRESULTS
In this section we use the following common terminology. Every data source is composed of a type of 2D features (F ), a type of light over which the 2D features have been computed (L), and the inclusion, or not, of 3D shape features (S). Every data source is described according to the following proto-col: [F, L, S], where F ∈ {C, T, CT }, L ∈ {N, W, N W }, S ∈ {∅, 3D}, C refers to 2D color features, T to 2D texture features, CT to the combination of color and texture features, N refers to the use of NBI, W refers to the use of WL, and N W refers to the use of both NBI and WL.
A. Best Classifier System
In the first set of experiments we compared 57
dif-ferent models. Those 57 models were the result of
testing all the combinations among the following
pa-rameters: 3 classifiers (RF, RS and SVM), and 19
data sources ([C, W, ∅], [C, N, ∅], [C, N W, ∅], [T, W, ∅], [T, N, ∅], [T, N W, ∅], [CT, W, ∅], [CT, N, ∅], [CT, N W, ∅], [C, W, 3D], [C, N, 3D], [C, N W, 3D], [T, W, 3D], [T, N, 3D], [T, N W, 3D], [CT, W, 3D], [CT, N, 3D], [CT, N W, 3D], [∅, ∅, 3D]).
To evaluate the performance of the different models 3 metrics per class were taken into account: Sensitivity (Sen), Specificity (Spe), and Accuracy (Acc). Sen refers to the true positive rate, measuring the proportion of actual positives which are correctly identified as such. Spe is the true negative rate and gives the proportion of negatives which are correctly identified as such. Acc is defined as the total number of true and false positives divided by the total number of cases examined (true positives, false positives, true negatives, and false negatives). These metrics are computed for each class independently.
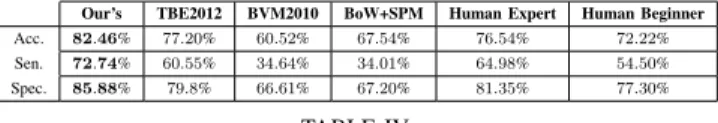
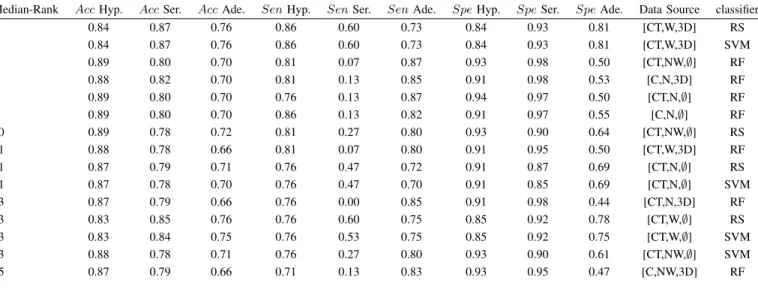
Nine different performance metrics were used (Sen, Spe, and Acc for each one of the 3 classes under study). After that, every model was ranked with respect to each particular metric, and the median rank was computed. Different trade-offs were studied in order to select the best model: average rank, median rank, penalization of the models with zero sensitivity in one class, consideration of the global percentage of correctly classified lesions only. Finally, a sensible criterion to select the best models was the median rank due to its robustness and demonstrated effectiveness in the task. The 15 best ranked models are shown in Table II. In particular, the best model has been the one using RS or SVM considering WL, 3D shape, color and textural features. The final confusion matrices can be seen in Table III and the average Sen, Spe, and Acc scores across the three different classes are shown in Table IV.
Our’s TBE2012 BVM2010 BoW+SPM Human Expert Human Beginner Acc. 82.46% 77.20% 60.52% 67.54% 76.54% 72.22% Sen. 72.74% 60.55% 34.64% 34.01% 64.98% 54.50% Spec. 85.88% 79.8% 66.61% 67.20% 81.35% 77.30%
TABLE IV
AVERAGE ACCURACY,SENSITIVITY AND SPECIFICITY VALUES FOR OUR
METHOD, TBE2012, BVM2010ANDBOW+SPM,AND HUMAN EXPERTS
Median-Rank Acc Hyp. Acc Ser. Acc Ade. Sen Hyp. Sen Ser. Sen Ade. Spe Hyp. Spe Ser. Spe Ade. Data Source classifier 3 0.84 0.87 0.76 0.86 0.60 0.73 0.84 0.93 0.81 [CT,W,3D] RS 3 0.84 0.87 0.76 0.86 0.60 0.73 0.84 0.93 0.81 [CT,W,3D] SVM 4 0.89 0.80 0.70 0.81 0.07 0.87 0.93 0.98 0.50 [CT,NW,∅] RF 5 0.88 0.82 0.70 0.81 0.13 0.85 0.91 0.98 0.53 [C,N,3D] RF 7 0.89 0.80 0.70 0.76 0.13 0.87 0.94 0.97 0.50 [CT,N,∅] RF 8 0.89 0.80 0.70 0.86 0.13 0.82 0.91 0.97 0.55 [C,N,∅] RF 10 0.89 0.78 0.72 0.81 0.27 0.80 0.93 0.90 0.64 [CT,NW,∅] RS 11 0.88 0.78 0.66 0.81 0.07 0.80 0.91 0.95 0.50 [CT,W,3D] RF 11 0.87 0.79 0.71 0.76 0.47 0.72 0.91 0.87 0.69 [CT,N,∅] RS 11 0.87 0.78 0.70 0.76 0.47 0.70 0.91 0.85 0.69 [CT,N,∅] SVM 13 0.87 0.79 0.66 0.76 0.00 0.85 0.91 0.98 0.44 [CT,N,3D] RF 13 0.83 0.85 0.76 0.76 0.60 0.75 0.85 0.92 0.78 [CT,W,∅] RS 13 0.83 0.84 0.75 0.76 0.53 0.75 0.85 0.92 0.75 [CT,W,∅] SVM 13 0.88 0.78 0.71 0.76 0.27 0.80 0.93 0.90 0.61 [CT,NW,∅] SVM 15 0.87 0.79 0.66 0.71 0.13 0.83 0.93 0.95 0.47 [C,NW,3D] RF TABLE II
15 BESTMODELS. THE CONFUSION MATRIX OF THE BEST MODEL(FIRST ROW)IS DISPLAYED INTABLEIII.
Our’s TBE2012 BVM2010 BoW+SPM Human Expert Human Beginner
Hyp. Ser. Ade. Hyp. Ser. Ade. Hyp. Ser. Ade. Hyp. Ser. Ade. Hyp. Ser. Ade. Hyp. Ser. Ade.
Hyp. 18 0 3 14 0 7 8 3 10 2 0 19 14.2 (2.6) 1.7 (1.3) 5.0 (1.8) 11.0 (2.6) 2.7 (1.5) 7.3 (3.8)
Ser. 2 9 4 1 6 8 2 2 11 1 0 14 1.2 (2.5) 9.5 (2.1) 4.2 (1.5) 2.3 (2.1) 6.7 (3.1) 6.0 (3.6)
Ade. 7 4 29 4 6 30 12 7 21 0 3 37 7.5 (2.4) 7.0 (0.8) 25.5 (2.4) 3.3 (4.2) 10.0 (5.2) 26.7 (8.6)
TABLE III
FROM LEFT TO RIGHT WE SHOW THE CONFUSION MATRICES FOR THE MODEL WITH THE BEST MEDIAN RANK([CT,W,3D]WITHRSCLASSIFIER),
STATE-OF-THE-ART METHODSTBE2012, BVM2010ANDBOW+SPM,AND THE AVERAGE CONFUSION MATRICES FOR HUMAN EXPERTS AND
BEGINNERS. WE USE BRACKETS FOR THE STANDARD DEVIATION OF EACH ELEMENT IN THE CONFUSION MATRIX FOR BOTH HUMAN EXPERTS AND
BEGINNERS.
Our’s TBE2012 BVM2010 BoW+SPM Human Expert Human Beginner
Resec. No-Resec. Resec. No-Resec Resec. No-Resec Resec. No-Resec Resec. No-Resec Resec. No-Resec
Resection 52 3 50 5 41 14 54 1 46.2 (1.9) 8.7 (1.9) 49.3 (6.0) 5.7 (6.0)
No-Resection 5 16 7 14 13 8 19 2 6.7 (2.6) 14.2 (2.6) 10.0 (2.6) 11.0 (2.6)
TABLE V
CONFUSION MATRICES FOR THE BINARY(RESECTION,NO RESECTION)CLASSIFICATION PROBLEM. BRACKETS DISPLAY STANDARD DEVIATIONS.
From our rankings we can state that the majority of the top ranking models includes NBI (10 out of 15 of the best results were obtained by N BI or N BI and W L). Importantly, NBI performs effectively not only regarding the 2D features but also with respect to the 3D shape descriptors, since they are computed from frames recorded using NBI. Color and texture features, when used together, obtained the best results in 12 cases. Also, 11 out of the 15 best models are ensemble classifiers (in opposition to SVM, which is ranked only 4 times). Even if many of the best ranked models include 3D shape features (3 out the 5 best models), other methods without 3D shape also obtained high scores in our ranking.
The type of lesions which are more commonly misclassified are serrated adenomas (usually classified as adenomas). In all our experiments, on average, when using the leave-one-out strategy, each serrated adenoma was incorrectly classified 39.73% of the times, while for adenoma and hyperplastic it was 20.2% and 12.13%, respectively. In fact, 2 out of 15 serrated adenomas were consistently misclassified by all the 57 machine learning models tested.
The worst ranked models were the ones using only 3D
RF RS SVM
Avg Acc 0.78 (4.38, 0) 0.49 (3.51, −0.88) 0.29 (2.63, −1.75) Avg Sen 1.44 (6.31, −0.75) 0.83 (5.36, −2.34) −0.04 (3.14, −4.56) Avg Spe 0.72 (3.61, −0.38) 0.45 (2.62, −0.87) 0.12 (1.70, −1.79)
TABLE VI
AVERAGE IMPROVEMENT PERCENTAGE OBTAINED WHEN INTRODUCING
3DFEATURES TO A MACHINE LEARNING MODEL EXCLUSIVELY BASED ON
2DFEATURES. THE MAXIMUM AND MINIMUM IMPROVEMENT FOUND IN
OUR TESTS,RESPECTIVELY,ARE INCLUDED IN BRACKETS. ACCORDING
TO THESE RESULTS,A SYSTEM INCLUDING3DSHAPE FEATURES IS
BETTER ON AVERAGE THAN ONE PURELY BASED ON2DDESCRIPTORS.
shape, which provides clear evidence that 3D shape features, by themselves, do not provide enough information to identify the different types of lesions. This supports the idea that virtual colonoscopy might not be adequate for polyp’s classification. However, combining 3D and 2D features seems to be the best option. Table VI shows the quantitative improvement obtained when using 3D features.
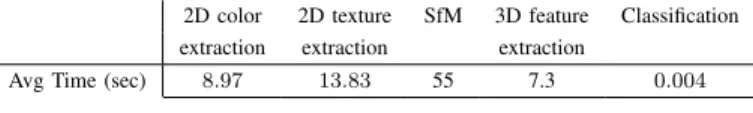
Also, due to its clinical importance (to assist the clinician to perform a polypectomy during a live colonoscopic procedure),
2D color 2D texture SfM 3D feature Classification extraction extraction extraction
Avg Time (sec) 8.97 13.83 55 7.3 0.004
TABLE VII
AVERAGE TIME REQUIRED BY EACH OF THE MAIN CONSTITUENT BLOCKS
USINGMATLAB R2012A CODE RUNNING ON ANINTEL(R) CORE(TM)2
EXTREMECPU Q6850 @ 3.00GHZ8GB RAM.
we studied the binary classification between resection (serrated adenoma and adenoma) vs non-resection (hyperplastic). The results obtained by the best ranked method are shown in Table V: it corresponds to RF considering NBI, color, 3D shape and textural features.
The quality of the input video has an impact in the final result. Issues like the non-rigidity of the scene, the absence of enough viewpoints of the polyp, or the existence of self-occlusions due to the location of the polyp within the walls of the intestines, could have a negative impact in the SfM algorithm, reducing the quality of the 3D reconstruction. Also, motion blur, due to a very fast movement with the colonoscope, can complicate the selection of a suitable frame to perform the color and feature extraction, or the presence of different substances (e.g. blood, feces) can hinder the correct visualization of the lesion. However, all these drawbacks are alleviated by the fact that the results exclusively using 2D features are reasonably good (9 out of the 15 best results where achieved by models without 3D). On the other hand, the problems associated with SfM can be solved very quickly by recording a new exploratory video, which takes about 30 seconds: if the 3D reconstruction is not satisfactory, it would be enough to record the lesion again from different viewpoints but moving a little more slowly the endoscope.
The importance of the exploratory video also relies on the fact that two of its frames will be used to perform texture and color extraction, one using WL and another using NBI. Ac-cording to preliminary experiments using five different frames from the same video (all of them in a range of ±2 seconds with respect to the central frame, the one actually used in the experiments included in the paper), the standard deviation of the average accuracy was 2.87%, the standard deviation of the average sensitivity was 5.10%, and the standard deviation of the average specificity was 2.63%. Therefore, we can state that the system performance is not dramatically affected by the frame selected. Importantly, the only desirable requisite is to select frames where the polyp can be clearly perceived and without motion blur.
Table VII provides some reference about the computational time of the proposed approach. One interesting conclusion that can be extracted from the aforementioned table is that, if necessary, one could remove the part related to the 3D shape characterization since without these descriptors the results are still competitive, as already explained, and it would permit to avoid the automation of several difficult steps (frames selection, segmentation, three-dimensional shape reconstruc-tion, extraction of 3D shape descriptors, training/testing with patterns of higher dimension). The results of our experiments support the idea that 3D shape together with 2D features
provide overall the best results, but only 2D features could be good enough.
B. Comparison with Other Methods
The comparison with other approaches has been extremely difficult for several reasons. First, the vast majority of related research papers try to solve a different problem: polyp detec-tion [40], [44], [41], [81] usually using CT colonography, or 2D tissue classification using magnification and/or chromoen-doscopy [82], [79]. Second, even if those methods would have solved the same problem, there is an almost absolute absence of publicly available codes.
We compare three recent methods focused on the classifi-cation of gastrointestinal lesions in colonoscopy: the Invariant Gabor Texture Descriptors using NBI and SVM as classifier introduced in TBE2012 [83]; the color GLCM using WL and k-NN as classifier that was the best performing method in BVM2010 [62]; and the combination of Bag of Words (BoW) descriptors with Spatial Pyramid matching (SPM), that were successfully used in gastroenterology in the past [38], [84], [85], concatenated with our texture and color descriptors using SVM as classifier. BoW histograms are obtained from SIFT features computed from a regular grid inside the polyp’s ROI, resized to fit in a reference image of 500 × 500 pixels. This accounts for differences in size, for each polyp’s ROI. The GLCM used in [62] consists of windows of 32×32 pixels, 4 angles×3 channels×6 features (energy, correlation, IDM, entropy, cluster shade, cluster prominence leading). The results obtained by these two methods are displayed in Tables III and IV. In both cases, our novel approach outperforms the results obtained so far, especially the ones achieved by BVM2010. The same behaviour is seen in the binary classification problem, as seen in Table V. The very bad results obtained by BoW+SPM can be explained by the curse of dimensionality since we have a training set of 76 lesions but the dimensionality of the problem has been dramatically increased up to almost 9000 dimensions.
C. Comparison with Human Experts
We also wanted to compare the performance of our ap-proach with the diagnostic efficacy of two kinds of clini-cian knowledge: Beginner and Expert. We consider a human operator to be a beginner when their experience performing colonoscopies is equal or less than 4 years. In turn, a human operator belongs to the expert category when he/she has been performing colonoscopies during, at least, the last 8 years. Within the expert category, the range of years of experience goes from 8 to 40. The comparison between the average and standard deviation of the confusion matrices of expert and beginner human operators can be seen in Table III and the average performance is shown in Table IV. The confusion tables, including average and standard deviations are shown in Table V. Human experts are in general more accurate and their metrics are higher by an average of 9% comparing to human beginners.
In terms of agreement between the different human opera-tors and the best machine learning approach, just in 2 cases all
A-16 H-14
Fig. 5. Lesions wrongly classified by all humans and the best model.
A-2 A-16 H-14
Fig. 6. Lesions wrongly classified by all humans.
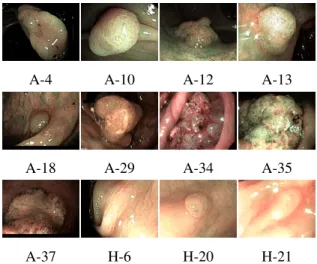
human operators and the best machine learning model failed in the classification (Figure 5). The number of lesions wrongly classified by all the evaluators (even if not all of them agreed in the same diagnosis) was 3 (Figure 6). The lesions correctly classified by all humans and the best machine learning model, the ones wrongly classified by the best model and correctly classified by all humans, and the lesions correctly classified by the best model and wrongly classified by all humans are displayed in Figures 7, 8 and 9, respectively. The text included in the figures shows the lesion name (‘H’, ‘A’ and ‘S’ refer to hyperplastic, adenoma and serrated, respectively). We also provide in Table VIII the number of human operators that wrongly classified each lesion, so it is possible to identify the lesions whose classification is harder.
We can conclude that our system is human-competitive: for every type of lesion, and every type of virtual biopsy problem (binary or multiclass), our system performs usually better than human operators (including experts). Our approach correctly classifies more serrated adenomas and adenomas, while keep-ing similar accuracy in terms of hyperplastic lesions.
VI. CONCLUSIONS ANDFUTUREWORK
In this paper we have designed, implemented and tested a virtual biopsy method for gastrointestinal lesions, focused on the classification of colonoscopy videos in three clinically very
A-4 A-10 A-12 A-13
A-18 A-29 A-34 A-35
A-37 H-6 H-20 H-21
Fig. 7. Lesions correctly classified by all humans and the best model.
A-3 A-25 H-1
Fig. 8. Lesions wrongly classified by the best model and correctly classified by all humans.
A-2
Fig. 9. Lesions correctly classified by the best model and wrongly by all humans.
relevant classes: adenoma, hyperplastic and serrated adenoma. Our method completely avoids changing the standard medical protocol, as well as using specific and costly material in the channel of the endoscope.
Our main research contributions in this work are:
• The proposal of a publicly available database (composed of videos, ground truth from both endoscopist image inspection and histology, and camera calibration) that makes possible the replication of our experiments and the comparison with other machine learning/computer vision algorithms.
• To study the possibility of classifying tissues correctly without using chromoendoscopy. In this case, we save time to the clinicians by avoiding the staining procedure using indigo carmine.
• To investigate if we are able to help clinicians in the
virtual biopsy of hyperplastic, serrated adenoma and adenoma. Serrated adenomas are very difficult to classify, and we can save time again avoiding biopsy of hyperplas-tic tissues. To do so, we compare the performance of our machine learning classification system with the one of six clinicians: 3 beginner and 4 expert clinicians.
• To study if the introduction of shape features improves classification accuracy. In other words, to which extent shape information improves the classification ability of our approach.
Classification accuracy could be improved by means of the introduction of extra information like the position of the lesion (for instance, sessile serrated adenomas are usually located in the right colon, while hyperplastic polyps are mainly found in the left colon) or the lesion size. Although we do not use the scale in the classification task (and our performance is clearly better than state-of-the-art methods and human operators), the size of a polyp is usually considered an important cue for deciding if a polyp needs to be removed [86], [87], [88]. Furthermore, there are some references that diminish the importance of size in colorectal cancer diagnosis and highlight the malignant potential of small lesions [89], [90]. Since the dataset is unbalanced, class weighting with SVM could be a potentially interesting candidate to avoid the bias towards the class which has the largest number of data instances.
Lesion A-1 A-2 A-3 A-4 A-5 A-6 A-7 A-8 A-9 A-10 A-11 A-12 A-13 A-14 A-15 A-16 A-17 A-18 A-19 A-20 Fails 1 7 0 0 5 1 1 6 5 0 1 0 0 4 1 7 2 0 5 4 Lesion A-21 A-22 A-23 A-24 A-25 A-26 A-27 A-28 A-29 A-30 A-31 A-32 A-33 A-34 A-35 A-36 A-37 A-38 A-39 A-40
Fails 2 2 4 6 0 6 1 6 0 2 5 1 1 0 0 2 0 2 2 5 Lesion H-1 H-2 H-3 H-4 H-5 H-6 H-7 H-8 H-9 H-10 H-11 H-12 H-13 H-14 H-15 H-16 H-17 H-18 H-19 H-20 Fails 0 3 1 2 1 0 6 6 2 4 2 3 6 7 1 5 4 2 0 0 Lesion H-21 S-1 S-2 S-3 S-4 S-5 S-6 S-7 S-8 S-9 S-10 S-11 S-12 S-13 S-14 S-15 Fails 0 4 6 3 5 4 2 3 4 2 1 2 3 3 2 3 TABLE VIII
NUMBER OF HUMAN OPERATORS WHO WRONGLY CLASSIFY EACH LESION.
A potential next step would be to validate the new con-cept proposed in this paper with a larger number of studied polyps, and to select in an automatic fashion the frames and ROIs to perform SfM and texture/color extraction. It would also be interesting to study the overall system performance when applying existing methods for specularity removal in colonoscopy videos [91], [92].
Our method, although providing very promising results, usu-ally offers a better performance when using NBI (which is also employed to reconstruct the 3D shape of the polyp through SfM). This fact limits its use to Olympus environments. Even if in practice this is the most common scenario, a possible future work could be to study how to avoid this limitation and make our framework even more general and independent of a particular technology.
If the scale is needed, a simple solution consists on placing an object of known shape next to the polyp so that it is captured by the camera. There are tools that can be deployed with the colonoscope, such as the biopsy grip. However, this solution requires the doctors to introduce the grip every time a virtual biopsy is performed, which could affect timing. A different approach is taken in [93], that proposes a method able to recover the missing scale from a sequence of images. This method is based on detecting the infocus breakpoint of the camera while the colonoscope slowly approaches the lesion. This requires a very accurate photometric calibration of the camera and a specific video sequence which cannot be used for reconstruction as it keeps the same view of the polyp from different distances. Using this solution would then imply to extend the exploratory video to perform the required motion. Since a tool for 3D reconstruction and classification, as the one presented here, would be extremely useful for discussing, in real-time, the resection of an atypical polyp (for instance, concave-shaped and suspect of deep neoplastic invasion), the next step would be the optimization of the implementation. More sophisticated implementations, like general purpose GPU (GPGPU) programming, can be tested to speed-up the computation and allow real-time diagnosis.
Also, a tool like the one presented in this paper could be used for the automatic tracking of lateral margins when performing a mucosectomy, since the texture of the tissue to be resected is clearly different from the healthy one. Our 3D shape reconstruction process could also allow us to perform zoom on a particular region within the image (super-resolution). Finally, a very interesting experiment would consist in comparing the performance obtained by other virtual chromoendoscopy imaging modalities (like FICE from Fuji Corporation or i-Scan from Pentax Corporation).
VII. ACKNOWLEDGEMENTS
This work has been supported by the French National Research Agency through the Syseo Project (ANR-10-TECS-0005). Thanks to Andr´e Baetz, C´edric Duron, Camille Sautel and F´elix Goutorbe for their generous collaboration in the evaluation of lesions. Thanks to Christine Chambon-Augoyard and Thierry Ponchon for sharing with us their collection of serrated adenomas. Thanks to YANSYS M´edical for providing technical support to collect the operators’ feedback.
REFERENCES
[1] International Agency for Research in Cancer, World Health Organi-zation, “GLOBOCAN 2012. Estimated cancer Incidence, Mortality, Prevalence and Disability-adjusted life years (DALYs) Worldwide in 2012,” http://globocan.iarc.fr/Pages/fact sheets population.aspx, 2014. [2] C. Stock and H. Brenner, “Utilization of lower gastrointestinal
en-doscopy and fecal occult blood test in 11 European countries: evidence from the Survey of Health, Aging and Retirement in Europe (SHARE),” Endoscopy, vol. 42, no. 7, pp. 546–556, 2010.
[3] A. Sonnenberg, S. L. Amorosi, M. J. Lacey, and D. A. Lieberman, “Patterns of endoscopy in the United States: analysis of data from the Centers for Medicare and Medicaid Services and the National Endoscopic Database,” Gastrointest. Endosc., vol. 67, no. 3, pp. 489– 496, 2008.
[4] N. Segnan, J. Patnick, and L. v. Karsa, European guidelines for quality assurance in colorectal cancer screening and diagnosis, 1st ed. Pub-lications Office of the European Union Luxembourg, 2010.
[5] J. C. van Rijn, J. B. Reitsma, P. M. B. Jaap Stoker, S. J. van Deventer, and E. Dekker, “Polyp miss rate determined by tandem colonoscopy: a systematic review,” Am. J. Gastroenterol., vol. 101, no. 2, pp. 343 – 350, 2006.
[6] M. F. Kaminski, C. Hassan, R. Bisschops, J. Pohl, M. Pellise, E. Dekker, A. Ignjatovic-Wilson, A. Hoffman, G. Longcroft-Wheaton, D. Heres-bach, J. M. Dumonceau, and J. E. East, “Advanced imaging for detection and differentiation of colorectal neoplasia: European Society of Gastro-intestinal Endoscopy (ESGE) Guideline,” Endoscopy, vol. 46, no. 5, pp. 435 – 449, 2014.
[7] P. in the Paris Workshop, “The Paris endoscopic classification of super-ficial neoplastic lesions: esophagus, stomach and colon,” Gastrointest. Endosc., vol. 58, no. 6, pp. S3–S43, 2003.
[8] S. Kudo, S. Tamura, T. Nakajima, H. Yamano, H. Kusaka, and H. Watanabe, “Diagnosis of colorectal tumorous lesions by magnifying endoscopy,” Gastrointest. Endosc., vol. 44, no. 1, pp. 8–14, 1996. [9] A. Parra-Blanco, A. Jimenez, B. Rembacken, N. Gonzalez, D.
Nicolas-Perez, A. Z. Gimeno-Garcia, M. Carrillo-Palau, T. Matsuda, and E. Quintero, “Validation of Fujinon intelligent chromoendoscopy with high definition endoscopes in colonoscopy,” World J. Gastroenterol., vol. 15, no. 42, pp. 5266–5273, 2009.
[10] S. Kodashima and M. Fujishiro, “Novel image-enhanced endoscopy with i-scan technology,” World J. Gastroenterol., vol. 16, no. 9, pp. 1043– 1049, 2010.
[11] R. Szeliski, Computer Vision: Algorithms and Applications. Springer, 2010.
[12] R. Hartley and A. Zisserman, Multiple View Geometry in Computer Vision. Cambridge University Press, 2003.
[13] P. F. Alcantarilla, A. Bartoli, F. Chadebecq, C. Tilmant, and V. Lepilliez, “Enhanced imaging colonoscopy facilitates dense motion-based 3D reconstruction,” in Procs. of the Annual International Conference of the IEEE Engineering in Medicine and Biology Society (EMBC), 2013, pp. 7346 – 7349.
[14] S. A. Gross and M. B. Wallace, “Hold on Picasso, narrow band imaging is here,” Am. J. Gastroenterol., vol. 101, no. 12, pp. 2717–2718, 2006. [15] R. Pittayanon and R. Rerknimitr, “Role of digital chromoendoscopy and confocal laser endomicroscopy for gastric intestinal metaplasia and cancer surveillance,” World J. Gastrointest. Endosc., vol. 4, no. 10, pp. 472–478, 2012.
[16] A. Hoffman, F. Sar, M. Goetz, A. Tresch, J. Mudter, S. Biesterfeld, P. R. Galle, M. F. Neurath, and R. Kiesslich, “High definition colonoscopy combined with i-Scan is superior in the detection of colorectal neoplasias compared with standard video colonoscopy: a prospective randomized controlled trial.” Endoscopy, vol. 42, no. 10, pp. 827–833, 2010. [17] R. Lambert, S. E. Kudo, M. Vieth, J. I. Allen, H. Fujii, T. Fujii,
H. Kashida, T. Matsuda, M. Mori, H. Saito, T. Shimoda, S. Tanaka, H. Watanabe, J. J. Sung, A. D. Feld, J. M. Inadomi, M. J. O’Brien, D. A. Lieberman, D. F. Ransohoff, R. M. Soetikno, A. Zauber, C. R. Teixeira, J. F. Rey, E. Jaramillo, C. A. Rubio, A. Van Gossum, M. Jung, J. R. Jass, and G. Triadafilopoulos, “Pragmatic classification of superficial neoplastic colorectal lesions,” Gastrointest. Endosc., vol. 70, no. 6, pp. 1182–1199, 2009.
[18] S. Hasegawa, K. Mitsuyama, H. Kawano, K. Arita, Y. Maeyama, Y. Akagi, Y. Watanabe, Y. Okabe, O. Tsuruta, and M. Sata, “Endoscopic discrimination of sessile serrated adenomas from other serrated lesions,” Oncol. Lett., vol. 2, no. 5, pp. 785–789, 2011.
[19] A. B. Farris, J. Misdraji, A. Srivastava, A. Muzikansky, V. Deshpande, G. Y. Lauwers, and M. Mino-Kenudson, “Sessile serrated adenoma: challenging discrimination from other serrated colonic polyps,” Am. J. Surg. Pathol., vol. 32, no. 1, pp. 30–35, 2008.
[20] J. Young, M. Jenkins, S. Parry, B. Young, D. Nancarrow, D. English, G. Giles, and J. Jass, “Serrated pathway colorectal cancer in the population: genetic consideration,” Gut, vol. 56, no. 10, pp. 1453–1459, 2007.
[21] F. Bosman, WHO classification of tumours of the digestive system. International Agency for Research on Cancer Press, 2010.
[22] E. E. Torlakovic, J. D. Gomez, D. K. Driman, J. R. Parfitt, C. Wang, T. Benerjee, and D. C. Snover, “Sessile serrated adenoma (SSA) vs. traditional serrated adenoma (TSA),” Am. J. Surg. Pathol., vol. 32, no. 1, pp. 21–29, 2008.
[23] M. Liedlgruber and A. Uhl, “Computer-aided decision support systems for endoscopy in the gastrointestinal tract: A review,” IEEE Rev. Biomed. Eng., vol. 4, pp. 73–88, 2011.
[24] K. Takai, T. Kin, H. Oyama, A. Iijima, M. Shojima, H. Nishido, and N. Saito, “The use of 3D computer graphics in the diagnosis and treatment of spinal vascular malformations,” J. Neurosurg. Spine, vol. 15, no. 6, pp. 654–659, 2011.
[25] S. M. Friedewald, E. A. Rafferty, S. L. Rose, M. A. Durand, D. M. Plecha, J. S. Greenberg, M. K. Hayes, D. S. Copit, K. L. Carlson, T. M. Cink, L. D. Barke, L. N. Greer, D. P. Miller, and E. F. Conant, “Breast cancer screening using tomosynthesis in combination with digital mammography,” JAMA, vol. 311, no. 24, pp. 2499–2507, 2014. [26] N. Nanda, Comprehensive Textbook of Echocardiography (Vols 1 & 2).
Jaypee Brothers, Medical Publishers Pvt. Limited, 2013.
[27] L. I. Kuncheva, Combining Pattern Classifiers: Methods and Algorithms. Wiley, 2004.
[28] L. I. Kuncheva and J. J. Rodr´ıguez, “Classifier ensembles for fMRI data analysis: an experiment,” Magnetic Resonance Imaging, vol. 28, no. 4, pp. 583 – 593, 2010.
[29] E. L. Allwein, R. E. Schapire, and Y. Singer, “Reducing multiclass to binary: A unifying approach for margin classifiers,” J. Mach. Learn. Res., vol. 1, pp. 113–141, 2001.
[30] L. I. Kuncheva and C. J. Whitaker, “Measures of diversity in classifier ensembles and their relationship with the ensemble accuracy,” Mach. Learn., vol. 51, no. 2, pp. 181–207, 2003.
[31] L. I. Kuncheva, C. Whitaker, C. Shipp, and R. Duin, “Limits on the majority vote accuracy in classifier fusion,” Pattern Anal. Appl., vol. 6, no. 1, pp. 22–31, 2003.
[32] E. Bauer and R. Kohavi, “An empirical comparison of voting classifica-tion algorithms: Bagging, boosting, and variants,” Mach. Learn., vol. 36, no. 1-2, pp. 105–139, 1999.
[33] L. Breiman, “Bagging predictors,” Mach. Learn., vol. 24, no. 2, pp. 123–140, 1996.
[34] AgiSoft LLC, “PhotoScan,” http://www.agisoft.ru/products/photoscan, 2014.
[35] N. Snavely, “Bundler: Structure from motion for unordered image collections,” http://www.cs.cornell.edu/∼snavely/bundler/, 2010.
[36] J. Shuttleworth, A. Todman, R. N. G. Naguib, B. Newman, and M. Bennett, “Colour texture analysis using co-occurrence matrices for classification of colon cancer images,” in Procs. of the IEEE Canadian
Conference on Electrical and Computer Engineering (CCECE), vol. 2, 2002, pp. 1134–1139.
[37] S. Mcdonagh, R. B. Fisher, and J. Rees, “Using 3D information for classification of non-melanoma skin lesions,” in Proc. Medical Image Understanding and Analysis, 2008, pp. 164 – 168.
[38] S. Manivannan, R. Wang, E. Trucco, and A. Hood, “Automatic normal-abnormal video frame classification for colonoscopy,” in Procs. of International Symposium Biomedical Imaging (ISBI), 2013, pp. 644– 647.
[39] M. Hafner, M. Liedlgruber, A. Uhl, A. Vcsei, and F. Wrba, “Delau-nay triangulation-based pit density estimation for the classification of polyps in high-magnification chromo-colonoscopy,” Comput. Methods Programs Biomed., vol. 107, no. 3, pp. 565 – 581, 2012.
[40] J. Bernal, J. S´anchez, and F. Vilari˜no, “Towards automatic polyp detection with a polyp appearance model,” Pattern Recognition, vol. 45, no. 9, pp. 3166 – 3182, 2012.
[41] S. Hwang, J. Oh, W. Tavanapong, J. Wong, and P. de Groen, “Polyp detection in colonoscopy video using elliptical shape feature,” in Procs. of IEEE International Conference on Image Processing (ICIP), vol. 2, 2007, pp. 465 – 468.
[42] J. Yao, J. Li, and R. M. Summers, “Employing topographical height map in colonic polyp measurement and false positive reduction,” Pattern Recognition, vol. 42, no. 6, pp. 1029 – 1040, 2009.
[43] R. Shi, P. Schraedley-Desmond, S. Napel, E. W. Olcott, B. R. Jeffrey, J. Yee, M. E. Zalis, D. Margolis, D. S. Paik, A. J. Sherbondy, P. Sun-daram, and C. F. Beaulieu, “CT Colonography: Influence of 3D Viewing and Polyp Candidate Features on Interpretation with Computer-aided Detection,” Radiology, vol. 239, no. 3, pp. 768–776, 2006.
[44] T. A. Chowdhury, P. F. Whelan, and O. Ghita, “The use of 3D surface fitting for robust polyp detection and classification in CT colonography,” Comp. Med. Imag. and Graph., vol. 30, no. 8, pp. 427–436, 2006. [45] K. Wehrmann and P. Fruhmorgen, “Evaluation of a new
three-dimensional magnetic imaging system for use during colonoscopy,” Endoscopy, vol. 34, no. 11, pp. 905–908, 2002.
[46] V. Parot, D. Lim, G. Gonzalez, G. Traverso, N. S. Nishioka, B. J. Vakoc, and N. J. Durr, “Photometric stereo endoscopy,” J. Biomed. Opt., vol. 18, no. 7, p. 076017, 2013.
[47] K. Oka, T. Seki, T. Akatsu, T. Wakabayashi, K. Inui, and J. Yoshino, “Clinical study using novel endoscopic system for measuring size of gastrointestinal lesion,” World J. Gastroenterol., vol. 20, no. 14, pp. 4050–4058, 2014.
[48] A. N. Burnett-Hartman, M. N. Passarelli, S. V. Adams, M. P. Upton, L. C. Zhu, J. D. Potter, and P. A. Newcomb, “Differences in epidemio-logic risk factors for colorectal adenomas and serrated polyps by lesion severity and anatomical site,” Am. J. Epidemiol., vol. 177, no. 7, pp. 625–637, 2013.
[49] K. J. Spring, Z. Z. Zhao, R. Karamatic, M. D. Walsh, V. L. Whitehall, T. Pike, L. A. Simms, J. Young, M. James, G. W. Montgomery, M. Appleyard, D. Hewett, K. Togashi, J. R. Jass, and B. A. Leggett, “High prevalence of sessile serrated adenomas with BRAF mutations: a prospective study of patients undergoing colonoscopy,” Gastroenterol-ogy, vol. 131, no. 5, pp. 1400–1407, 2006.
[50] V. P. Bauer and H. T. Papaconstantinou, “Management of serrated adenomas and hyperplastic polyps,” Clin. Colon Rectal Surg., vol. 21, no. 4, pp. 273–279, 2008.
[51] R. Nava, G. Crist´obal, and B. Escalante-Ram´ırez, “Invariant texture analysis through local binary patterns,” CoRR, vol. abs/1111.7271, 2011. [52] F. Riaz, F. B. Silva, M. Dinis-Ribeiro, and M. T. Coimbra, “Invariant gabor texture descriptors for classification of gastroenterology images,” IEEE Trans. Biomed. Engineering, vol. 59, no. 10, pp. 2893–2904, 2012. [53] S. Stefanou and A. Argyros, “Efficient Scale and Rotation Invariant Object Detection Based on HOGs and Evolutionary Optimization Tech-niques,” in Advances in Visual Computing, ser. LNCS. Springer, 2012, vol. 7431, pp. 220–229.
[54] F. Bianconi and A. Fern´andez, “Rotation invariant co-occurrence fea-tures based on digital circles and discrete Fourier transform,” Pattern Recogn. Lett., vol. 48, pp. 34 – 41, 2014.
[55] A. Artusi, F. Banterle, and D. Chetverikov, “A survey of specularity removal methods,” Computer Graphics Forum, vol. 30, no. 8, pp. 2208– 2230, 2011.
[56] A. Blake and G. Brelstaff, “Geometry from specularities.” in Procs. of International Conference on Computer Vision (ICCV), 1988, pp. 394– 403.
[57] R. W. Fleming, A. Torralba, and E. H. Adelson, “Specular reflections and the perception of shape,” Journal of Vision, vol. 4, no. 9, p. 10, 2004.