HAL Id: hal-01871807
https://hal.archives-ouvertes.fr/hal-01871807
Submitted on 12 Mar 2020
HAL is a multi-disciplinary open access
archive for the deposit and dissemination of
sci-entific research documents, whether they are
pub-lished or not. The documents may come from
teaching and research institutions in France or
abroad, or from public or private research centers.
L’archive ouverte pluridisciplinaire HAL, est
destinée au dépôt et à la diffusion de documents
scientifiques de niveau recherche, publiés ou non,
émanant des établissements d’enseignement et de
recherche français ou étrangers, des laboratoires
publics ou privés.
VERITAS and Fermi-LAT Observations of TeV
Gamma-Ray Sources Discovered by HAWC in the
2HWC Catalog
A.U. Abeysekara, A. Archer, W. Benbow, R. Bird, R. Brose, M. Buchovecky,
J.H. Buckley, V. Bugaev, A.J. Chromey, M.P. Connolly, et al.
To cite this version:
A.U. Abeysekara, A. Archer, W. Benbow, R. Bird, R. Brose, et al.. VERITAS and Fermi-LAT
Observations of TeV Gamma-Ray Sources Discovered by HAWC in the 2HWC Catalog. Astrophys.J.,
2018, 866 (1), pp.24. �10.3847/1538-4357/aade4e�. �hal-01871807�
VERITAS and
Fermi-LAT Observations of TeV Gamma-Ray Sources Discovered by
HAWC in the 2HWC Catalog
A. U. Abeysekara1, A. Archer2, W. Benbow3 , R. Bird4 , R. Brose5,6, M. Buchovecky2, J. H. Buckley2, V. Bugaev2, A. J. Chromey7, M. P. Connolly8, W. Cui9,10 , M. K. Daniel3, A. Falcone11, Q. Feng12 , J. P. Finley9 , L. Fortson13, A. Furniss14 , M. Hütten6, D. Hanna12 , O. Hervet15, J. Holder16, G. Hughes3, T. B. Humensky17, C. A. Johnson15 , P. Kaaret18 , P. Kar1, M. Kertzman19, D. Kieda1 , M. Krause6, F. Krennrich7, S. Kumar16, M. J. Lang8 , T. T. Y. Lin12,
S. McArthur9, P. Moriarty8, R. Mukherjee20 , S. O’Brien21, R. A. Ong4, A. N. Otte22 , N. Park23,24 , A. Petrashyk17, M. Pohl5,6 , E. Pueschel6 , J. Quinn21, K. Ragan12, P. T. Reynolds25, G. T. Richards22 , E. Roache3, C. Rulten13, I. Sadeh6,
M. Santander26 , G. H. Sembroski9, K. Shahinyan13 , I. Sushch6, J. Tyler12, S. P. Wakely23, A. Weinstein7, R. M. Wells7, P. Wilcox18, A. Wilhelm5,6, D. A. Williams15, T. J Williamson16, B. Zitzer12
(The VERITAS Collaboration),
S. Abdollahi27, M. Ajello28 , L. Baldini29 , G. Barbiellini30,31, D. Bastieri32,33 , R. Bellazzini34 , B. Berenji35, E. Bissaldi36,37 , R. D. Blandford38, R. Bonino39,40, E. Bottacini38,41, T. J. Brandt42 , P. Bruel43, R. Buehler6, R. A. Cameron38,
R. Caputo44, P. A. Caraveo45, D. Castro42,46, E. Cavazzuti47, E. Charles38 , G. Chiaro45, S. Ciprini48,49, J. Cohen-Tanugi50 , D. Costantin33, S. Cutini48,49, F. D’Ammando51,52 , F. de Palma37,53, N. Di Lalla29, M. Di Mauro38, L. Di Venere36,37,
A. Domínguez54, C. Favuzzi36,37, S. J. Fegan43, A. Franckowiak55 , Y. Fukazawa27 , S. Funk56 , P. Fusco36,37 , F. Gargano37 , D. Gasparrini48,49 , N. Giglietto36,37 , F. Giordano36,37, M. Giroletti51 , D. Green42,57, I. A. Grenier58, L. Guillemot59,60, S. Guiriec42,61 , E. Hays42 , J. W. Hewitt62 , D. Horan43, G. Jóhannesson63,64, S. Kensei27, M. Kuss34 ,
S. Larsson65,66 , L. Latronico39, M. Lemoine-Goumard67 , J. Li68, F. Longo30,31 , F. Loparco36,37 , M. N. Lovellette69, P. Lubrano49 , J. D. Magill57 , S. Maldera39 , M. N. Mazziotta37 , J. E. McEnery42,57, P. F. Michelson38, W. Mitthumsiri70, T. Mizuno71 , M. E. Monzani38 , A. Morselli72 , I. V. Moskalenko38 , M. Negro39,40, E. Nuss50, R. Ojha42, N. Omodei38 ,
M. Orienti51, E. Orlando38, M. Palatiello30,31, V. S. Paliya28 , D. Paneque73, J. S. Perkins42 , M. Persic30,74, M. Pesce-Rollins34 , V. Petrosian38 , F. Piron50, T. A. Porter38 , G. Principe56, S. Rainò36,37, R. Rando32,33 , B. Rani42, M. Razzano34,109 , S. Razzaque75 , A. Reimer38,76, O. Reimer38,76 , T. Reposeur67, C. Sgrò34, E. J. Siskind77, G. Spandre34 ,
P. Spinelli36,37, D. J. Suson78 , H. Tajima38,79 , J. B. Thayer38, D. J. Thompson42 , D. F. Torres68,80 , G. Tosti49,81 , E. Troja42,57 , J. Valverde43, G. Vianello38 , M. Vogel35, K. Wood82, M. Yassine30,31
(The Fermi-LAT Collaboration), and
R. Alfaro83, C. Álvarez84, J. D. Álvarez85, R. Arceo84, J. C. Arteaga-Velázquez85, D. Avila Rojas83, H. A. Ayala Solares86, A. Becerril83, E. Belmont-Moreno83, S. Y. BenZvi87, A. Bernal88, J. Braun89, C. Brisbois90, K. S. Caballero-Mora84, T. Capistrán91, A. Carramiñana91, S. Casanova92,93, M. Castillo85, U. Cotti85, J. Cotzomi94, S. Coutiño de León91, C. De León94, E. De la Fuente95,
S. Dichiara88, B. L. Dingus96, M. A. DuVernois89, J. C. Díaz-Vélez95, K. Engel97, O. Enriquez-Rivera98, D. W. Fiorino97, H. Fleischhack90, N. Fraija88, J. A. García-González83, F. Garfias88, A. González Muñoz83, M. M. González88, J. A. Goodman97, Z. Hampel-Arias89, J. P. Harding96, S. Hernandez83, A. Hernandez-Almada83, B. Hona90, F. Hueyotl-Zahuantitla84, C. M. Hui99, P. Hüntemeyer90, A. Iriarte88, A. Jardin-Blicq93, V. Joshi93, S. Kaufmann84, A. Lara98, R. J. Lauer100, W. H. Lee88, D. Lennarz22,
H. León Vargas83, J. T. Linnemann101, A. L. Longinotti91, G. Luis-Raya102, R. Luna-García103, R. López-Coto93, K. Malone86, S. S. Marinelli101, O. Martinez94, I. Martinez-Castellanos97, J. Martínez-Castro103, H. Martínez-Huerta104, J. A. Matthews100,
P. Miranda-Romagnoli105, E. Moreno94, M. Mostafá86, A. Nayerhoda92, L. Nellen106, M. Newbold1, M. U. Nisa87, R. Noriega-Papaqui105, R. Pelayo103, J. Pretz86, E. G. Pérez-Pérez102, Z. Ren100, C. D. Rho87, C. Rivière97, D. Rosa-González91,
M. Rosenberg86, E. Ruiz-Velasco83, H. Salazar94, F. Salesa Greus92, A. Sandoval83, M. Schneider107, M. Seglar Arroyo86, G. Sinnis96, A. J. Smith97, R. W. Springer1, P. Surajbali93, I. Taboada22 , O. Tibolla84, K. Tollefson101, I. Torres91, T. N. Ukwatta96 , L. Villaseñor94, T. Weisgarber89, S. Westerhoff89 , I. G. Wisher89, J. Wood89, T. Yapici87 , G. Yodh108,
A. Zepeda84,104, and H. Zhou96 (The HAWC Collaboration)
1
Department of Physics and Astronomy, University of Utah, Salt Lake City, UT 84112, USA
2
Department of Physics, Washington University, St. Louis, MO 63130, USA
3
Fred Lawrence Whipple Observatory, Harvard-Smithsonian Center for Astrophysics, Amado, AZ 85645, USA
4
Department of Physics and Astronomy, University of California, Los Angeles, CA 90095, USA
5
Institute of Physics and Astronomy, University of Potsdam, D-14476 Potsdam-Golm, Germany
6
DESY, Platanenallee 6, D-15738 Zeuthen, Germany
7
Department of Physics and Astronomy, Iowa State University, Ames, IA 50011, USA
8
School of Physics, National University of Ireland Galway, University Road, Galway, Ireland
9Department of Physics and Astronomy, Purdue University, West Lafayette, IN 47907, USA 10
Department of Physics and Center for Astrophysics, Tsinghua University, Beijing 100084, People’s Republic of China
11
Department of Astronomy and Astrophysics, 525 Davey Lab, Pennsylvania State University, University Park, PA 16802, USA
12
Physics Department, McGill University, Montreal, QC H3A 2T8, Canada
13
School of Physics and Astronomy, University of Minnesota, Minneapolis, MN 55455, USA
14
Department of Physics, California State University—East Bay, Hayward, CA 94542, USA
15Santa Cruz Institute for Particle Physics and Department of Physics, University of California, Santa Cruz, CA 95064, USA 16
Department of Physics and Astronomy and the Bartol Research Institute, University of Delaware, Newark, DE 19716, USA
17
Physics Department, Columbia University, New York, NY 10027, USA
18
Department of Physics and Astronomy, University of Iowa, Van Allen Hall, Iowa City, IA 52242, USA
19
Department of Physics and Astronomy, DePauw University, Greencastle, IN 46135-0037, USA
20
Department of Physics and Astronomy, Barnard College, Columbia University, NY 10027, USA
21
School of Physics, University College Dublin, Belfield, Dublin 4, Ireland
22
School of Physics and Center for Relativistic Astrophysics, Georgia Institute of Technology, 837 State Street NW, Atlanta, GA 30332-0430, USA;itaboada@gatech.edu
23Enrico Fermi Institute, University of Chicago, Chicago, IL 60637, USA;npark7@wisc.edu 24
The Wisconsin IceCube Particle Astrophysics Center and Department of Physics, University of Wisconsin-Madison, Madison, WI, USA
25
Department of Physical Sciences, Cork Institute of Technology, Bishopstown, Cork, Ireland
26
Department of Physics and Astronomy, University of Alabama, Tuscaloosa, AL 35487, USA
27
Department of Physical Sciences, Hiroshima University, Higashi-Hiroshima, Hiroshima 739-8526, Japan
28
Department of Physics and Astronomy, Clemson University, Kinard Lab of Physics, Clemson, SC 29634-0978, USA
29
Università di Pisa and Istituto Nazionale di Fisica Nucleare, Sezione di Pisa I-56127 Pisa, Italy
30
Istituto Nazionale di Fisica Nucleare, Sezione di Trieste, I-34127 Trieste, Italy
31
Dipartimento di Fisica, Università di Trieste, I-34127 Trieste, Italy
32
Istituto Nazionale di Fisica Nucleare, Sezione di Padova, I-35131 Padova, Italy
33
Dipartimento di Fisica e Astronomia“G. Galilei,” Università di Padova, I-35131 Padova, Italy
34
Istituto Nazionale di Fisica Nucleare, Sezione di Pisa, I-56127 Pisa, Italy
35
California State University, Los Angeles, Department of Physics and Astronomy, Los Angeles, CA 90032, USA
36
Dipartimento di Fisica“M. Merlin” dell’Università e del Politecnico di Bari, I-70126 Bari, Italy
37
Istituto Nazionale di Fisica Nucleare, Sezione di Bari, I-70126 Bari, Italy
38
W.W. Hansen Experimental Physics Laboratory, Kavli Institute for Particle Astrophysics and Cosmology, Department of Physics and SLAC National Accelerator Laboratory, Stanford University, Stanford, CA 94305, USA
39
Istituto Nazionale di Fisica Nucleare, Sezione di Torino, I-10125 Torino, Italy
40
Dipartimento di Fisica, Università degli Studi di Torino, I-10125 Torino, Italy
41
Department of Physics and Astronomy, University of Padova, Vicolo Osservatorio 3, I-35122 Padova, Italy
42
NASA Goddard Space Flight Center, Greenbelt, MD 20771, USA
43
Laboratoire Leprince-Ringuet, École Polytechnique, CNRS/IN2P3, F-91128 Palaiseau, France
44
Center for Research and Exploration in Space Science and Technology(CRESST) and NASA Goddard Space Flight Center, Greenbelt, MD 20771, USA
45
INAF-Istituto di Astrofisica Spaziale e Fisica Cosmica Milano, via E. Bassini 15, I-20133 Milano, Italy
46
Harvard-Smithsonian Center for Astrophysics, Cambridge, MA 02138, USA
47
Italian Space Agency, Via del Politecnico snc, I-00133 Roma, Italy
48
Space Science Data Center—Agenzia Spaziale Italiana, Via del Politecnico, snc, I-00133, Roma, Italy
49
Istituto Nazionale di Fisica Nucleare, Sezione di Perugia, I-06123 Perugia, Italy
50
Laboratoire Univers et Particules de Montpellier, Université Montpellier, CNRS/IN2P3, F-34095 Montpellier, France
51INAF Istituto di Radioastronomia, I-40129 Bologna, Italy 52
Dipartimento di Astronomia, Università di Bologna, I-40127 Bologna, Italy
53
Università Telematica Pegaso, Piazza Trieste e Trento, 48, I-80132 Napoli, Italy
54
Grupo de Altas Energías, Universidad Complutense de Madrid, E-28040 Madrid, Spain
55
Deutsches Elektronen Synchrotron DESY, D-15738 Zeuthen, Germany
56
Friedrich-Alexander-Universität Erlangen-Nürnberg, Erlangen Centre for Astroparticle Physics, Erwin-Rommel-Str. 1, D-91058 Erlangen, Germany
57
Department of Astronomy, University of Maryland, College Park, MD 20742, USA
58Laboratoire AIM, CEA-IRFU/CNRS/Université Paris Diderot, Service d’Astrophysique, CEA Saclay, F-91191 Gif sur Yvette, France 59
Laboratoire de Physique et Chimie de l’Environnement et de l’Espace—Université d’Orléans/CNRS, F-45071 Orléans Cedex 02, France
60Station de Radioastronomie de Nançay, Observatoire de Paris, CNRS/INSU, F-18330 Nançay, France 61
The George Washington University, Department of Physics, 725 21st St., NW, Washington, DC 20052, USA
62
University of North Florida, Department of Physics, 1 UNF Drive, Jacksonville, FL 32224, USA;john.w.hewitt@unf.edu
63
Science Institute, University of Iceland, IS-107 Reykjavik, Iceland
64
KTH Royal Institute of Technology and Stockholm University, Roslagstullsbacken 23, SE-106 91 Stockholm, Sweden
65
Department of Physics, KTH Royal Institute of Technology, AlbaNova, SE-106 91 Stockholm, Sweden
66
The Oskar Klein Centre for Cosmoparticle Physics, AlbaNova, SE-106 91 Stockholm, Sweden
67Centre d’Études Nucléaires de Bordeaux Gradignan, IN2P3/CNRS, Université Bordeaux 1, BP120, F-33175 Gradignan Cedex, France 68
Institute of Space Sciences(CSICIEEC), Campus UAB, Carrer de Magrans s/n, E-08193 Barcelona, Spain
69
Space Science Division, Naval Research Laboratory, Washington, DC 20375-5352, USA
70
Department of Physics, Faculty of Science, Mahidol University, Bangkok 10400, Thailand
71Hiroshima Astrophysical Science Center, Hiroshima University, Higashi-Hiroshima, Hiroshima 739-8526, Japan 72
Istituto Nazionale di Fisica Nucleare, Sezione di Roma“Tor Vergata,” I-00133 Roma, Italy
73
Max-Planck-Institut für Physik, D-80805 München, Germany
74
Osservatorio Astronomico di Trieste, Istituto Nazionale di Astrofisica, I-34143 Trieste, Italy
75
Department of Physics, University of Johannesburg, P.O. Box 524, Auckland Park 2006, South Africa
76
Institut für Astro- und Teilchenphysik and Institut für Theoretische Physik, Leopold-Franzens-Universität Innsbruck, A-6020 Innsbruck, Austria
77
NYCB Real-Time Computing Inc., Lattingtown, NY 11560-1025, USA
78
Purdue University Northwest, Hammond, IN 46323, USA
79
Solar-Terrestrial Environment Laboratory, Nagoya University, Nagoya 464-8601, Japan
80Institució Catalana de Recerca i Estudis Avançats(ICREA), E-08010 Barcelona, Spain 81
Dipartimento di Fisica, Università degli Studi di Perugia, I-06123 Perugia, Italy
82
Praxis Inc., Alexandria, VA 22303, resident at Naval Research Laboratory, Washington, DC 20375, USA
83
Instituto de Física, Universidad Nacional Autónoma de México, Mexico City, Mexico
84
Universidad Autónoma de Chiapas, Tuxtla Gutiérrez, Chiapas, Mexico
85
Universidad Michoacana de San Nicolás de Hidalgo, Morelia, Mexico
86
87
Department of Physics & Astronomy, University of Rochester, Rochester, NY, USA
88Instituto de Astronomía, Universidad Nacional Autónoma de México, Mexico City, Mexico 89
Department of Physics, University of Wisconsin-Madison, Madison, WI, USA
90
Department of Physics, Michigan Technological University, Houghton, MI, USA
91
Instituto Nacional de Astrofísica, Óptica y Electrónica, Puebla, Mexico
92
Institute of Nuclear Physics Polish Academy of Sciences, PL-31342 IFJ-PAN, Krakow, Poland
93
Max-Planck Institute for Nuclear Physics, Heidelberg, Germany
94
Facultad de Ciencias Físico Matemáticas, Benemérita Universidad Autónoma de Puebla, Puebla, Mexico
95
Departamentos de Física(CUCEI) y de Ciencias Naturales y Exactas (CUVALLES), Universidad de Guadalajara, Guadalajara, Mexico
96
Physics Division, Los Alamos National Laboratory, Los Alamos, NM, USA
97Department of Physics, University of Maryland, College Park, MD, USA 98
Instituto de Geofísica, Universidad Nacional Autónoma de México, Mexico City, Mexico
99
NASA Marshall Space Flight Center, Astrophysics Office, Huntsville, AL, USA
100
Department of Physics and Astronomy, University of New Mexico, Albuquerque, NM, USA
101
Department of Physics and Astronomy, Michigan State University, East Lansing, MI, USA
102
Universidad Politecnica de Pachuca, Pachuca, Hidalgo, Mexico
103
Centro de Investigación en Computación, Instituto Politécnico Nacional, Mexico City, Mexico
104
Physics Department, Centro de Investigacion y de Estudios Avanzados del IPN, Mexico City, Mexico
105
Universidad Autónoma del Estado de Hidalgo, Pachuca, Mexico
106
Instituto de Ciencias Nucleares, Universidad Nacional Autónoma de México, Mexico City, Mexico
107
Santa Cruz Institute for Particle Physics, University of California, Santa Cruz, Santa Cruz, CA, USA
108
Department of Physics and Astronomy University of California, Irvine, CA, USA Received 2018 March 12; revised 2018 August 28; accepted 2018 August 29; published 2018 October 5
Abstract
The High Altitude Water Cherenkov (HAWC) collaboration recently published their 2HWC catalog, listing 39 very high energy (VHE; >100 GeV) gamma-ray sources based on 507 days of observation. Among these, 19 sources are not associated with previously known teraelectronvolt(TeV) gamma-ray sources. We have studied 14 of these sources without known counterparts with VERITAS and Fermi-LAT. VERITAS detected weak gamma-ray emission in the 1 TeV–30 TeV band in the region of DA 495, a pulsar wind nebula coinciding with 2HWC J1953+294, confirming the discovery of the source by HAWC. We did not find any counterpart for the selected 14 new HAWC sources from our analysis of Fermi-LAT data for energies higher than 10 GeV. During the search, we detected gigaelectronvolt(GeV) gamma-ray emission coincident with a known TeV pulsar wind nebula, SNR G54.1+0.3 (VER J1930+188), and a 2HWC source, 2HWC J1930+188. The fluxes for isolated, steady sources in the 2HWC catalog are generally in good agreement with those measured by imaging atmospheric Cherenkov telescopes. However, the VERITASfluxes for SNR G54.1+0.3, DA 495, and TeV J2032+4130 are lower than those measured by HAWC, and several new HAWC sources are not detected by VERITAS. This is likely due to a change in spectral shape, source extension, or the influence of diffuse emission in the source region. Key words: gamma rays: general
1. Introduction
Gamma-ray astronomy can be performed using a variety of techniques, each with different strengths and weaknesses. Direct detection of gamma rays is possible with satellite-based instrumentation, such as the Large Area Telescope (LAT) on board the Fermi Gamma-Ray Space Telescope(Atwood et al.
2009). This provides low-background observations over a wide
field of view, covering about 20% of the sky at any given time and scanning the whole sky every three hours. However, due to the physical size limitations imposed upon satellite-based instruments, the effective area is generally smaller than 1 m2, leading to a sensitivity that peaks at a few gigaelectronvolts (GeV). Above 100 GeV, ground-based observatories are best suited to studying the emission, thanks to their large effective collection area when compared to space experiments. Ground-based imaging atmospheric Cherenkov telescope(IACT) arrays, such as VERITAS(Weekes et al.2002), observe the Cherenkov
light generated by particle showers in the atmosphere, while air shower arrays, such as the High Altitude Water Cherenkov (HAWC) observatory(Abeysekara et al. 2013), sample the air
shower particles at ground level. IACTs offer the best instantaneous sensitivity thanks to their large effective collection
area (∼105m2) and excellent rejection of the cosmic-ray background. However, observations require clear, dark skies, limiting the duty cycle to20%, and gamma-ray sources must be contained within the field of view of the telescope, which is at present 5° diameter. Air shower arrays for gamma-ray observations provide lower instantaneous sensitivity than IACTs, but they can operate continuously with an instantaneousfield of view of the telescope covering ∼15% of the sky. Sensitive, unbiased surveys for a large portion of the sky can be conducted over the lifetime of air shower arrays.
The angular and energy resolution of each of the three techniques, which allow one to study and to understand astrophysical gamma-ray sources in detail, are complementary. For example, the good angular resolution of IACTs allows us to resolve the detailed morphology of spatially extended sources and to identify the counterparts of sources in complex regions. The limitedfield of view, however, restricts the size of the emission region that can be studied. Compared to this, satellite-based instruments and air shower arrays can provide good measurements of highly extended sources. Satellite-based instruments provide energy resolution better than 15% for gamma rays with energies above several hundreds of mega-electronvolts up to around 1 TeV. Above 1 TeV, IACTs provide the best energy resolution (generally about 20%). Combined with their large effective areas and sensitivities,
109
Funded by contract FIRB-2012-RBFR12PM1F from the Italian Ministry of Education, University and Research(MIUR).
IACTs thus can measure detailed features of the spectral energy distribution (SED) of sources. The energy resolution of air shower arrays is worse than that of IACTs. The large and relatively uniform exposure time of air shower array measure-ments, however, can provide good high-energy measurements above tens of teraelectronvolts(TeV) for a large portion of the sky, increasing the dynamic range of the measurements and allowing the study of spectral changes at the highest energies. The most powerful approach, therefore, is to combine observations from all three methods. Only a few examples of this exist(Aliu et al.2014a,2014b) due to limited overlapping
source catalogs.
In this paper, we describe the results of observations of newly discovered HAWC sources with the VERITAS IACT array and the LAT on board the Fermi Gamma-Ray Space Telescope. Fully completed in 2015 March, HAWC has recently released a catalog, 2HWC (Abeysekara et al.
2017a). Compared to the previous very high energy (VHE;
>100 GeV) surveys performed by Milagro (Abdo et al.2007)
and ARGO-YBJ(Bartoli et al.2013), HAWC provides more
than an order of magnitude better sensitivity (Abeysekara et al.2017b). The 2HWC catalog contains 39 sources, 20 of
which are associated with known astrophysical objects, including active galactic nuclei, pulsar wind nebulae (PWNs), and supernova remnants (SNRs). The remaining 19 sources in the catalog have not previously been identified as TeV gamma-ray emitters, providing promising new targets for follow-up observations with IACTs and space-based gamma-ray observatories.
2. Target Selection and Observations 2.1. HAWC and the 2HWC Catalog
HAWC is an air shower array in operation in central Mexico, consisting of 300 water-filled, light-tight tanks, each instru-mented with four photomultiplier tubes(PMTs). The PMTs in each tank detect the Cherenkov light emitted by particles from the air showers. Relative timing between PMTs allows the reconstruction of the direction of the shower plane, and hence of the primary particle. HAWC operates 24 hr per day with an instantaneous field of view of ∼2 sr. The Earth’s rotation enables HAWC to observe two-thirds of the sky every day. HAWC was inaugurated on 2015 March 20, but its modular design allowed partial operation before then. HAWC is sensitive to gamma rays from 100 GeV to 100 TeV, with a one-year survey sensitivity to detect sources with an average flux corresponding to 5%–10% of the flux of the Crab Nebula across most of the northern sky. The data presented here were collected between 2014 November 26 and 2016 June 2, amounting to a live time of 507 days.
Details of the HAWC analysis techniques, including a study of systematic uncertainties, are described in Abeysekara et al. (2017b). Data analysis is performed in bins, i, i=1K9,
which correspond to the fraction of PMTs, fhit, reporting a
signal for a given event. The energy of the primary gamma ray is correlated with fhit, so bin i is used as an energy proxy.
Gamma rays are discriminated from the cosmic-ray background using the variance of the charge distribution detected in each air shower, with cuts optimized for each bin . The angular resolution, defined as a radius that contains 68% of the flux from a point source, depends strongly on the analysis bin, from 1°.0 for 1to 0°.18 for 9. A maximum-likelihood method was
used to reconstruct the spectrum. It takes into account the point-spread function (PSF) for each i and compares the
expected number of events, given the experimentally measured background, to a given spectral hypothesis.
In the 507-day operation data set, sources were identified in four all-sky maps. One map was optimized for point sources, while the remaining three maps were optimized for extended sources of diameters 0°.5, 1°, and 2°. A top hat distribution with the given diameter was used to smooth the sky map for each extended-source search. For each map, a test statistic (TS) value was calculated based on the ratio of the likelihood with a single-source model and with a pure background model. The 2HWC analysis required the TS value of a source to be higher than 25. The expected number of false detections for this analysis is 0.5. The analysis for the 2HWC catalog was carried out for all of the sources based on a hypothesis of a simple power-law spectral distribution, dN dE=N E0 -g,
where N0is a normalization factor and γ is a spectral index.
Spectralfits were performed assuming a point-source morph-ology for all sources identified in the point-source all-sky map. For sources identified in the extended maps, a top hat morphology was assumed with a size matching the map in which the extended source or candidate was found to be most significant. Of the 39 HAWC sources, 19 are located more
than 0°.5 away from previously known TeV sources,
presenting a group of newly detected TeV sources. These sources generally have low TS values compared to other 2HWC sources that are associated with known TeV sources. The average value of the spectral indices is 2.6, with the spectral indices ranging from 1.5 to 3.3. We use Fermi-LAT and VERITAS data to look for the counterparts of these HAWC sources that do not have clear associations with previous detected TeV sources.110
2.2. Observations
We searched VERITAS archival data collected from 2007 to 2015 for the 19 2HWC sources without known counterparts and selected data taken with the pointing of the telescopes offset by less than 1°.5 from the locations of the HAWC sources. Of these 19 HAWC sources, 11 locations had been observed by VERITAS prior to 2015 with a total exposure time of 134 hr. In addition to the archival data, VERITAS observed a subset of the HAWC sources during the 2015–2016 and 2016–2017 seasons. Combining the archival and new data sets, VERITAS observed a total of 14 out of 19 new sources reported by HAWC. After data quality selections, a total of 218 hr of data was analyzed for the study. Detailed information about the sources is shown in Table1. For each source listed in this table, the 2HWC identifier is provided, along with the map in which it was identified (PS for point source, 0°.5 or 1° for extended source) and J2000 Right Ascension (R.A.) and declination(decl.). The 1σ statistical uncertainty of the source position is shown as “Unc.” Sources marked with an asterisk (*) were identified as local maxima in the TS maps but are not
as clearly separated from neighboring sources. The table also shows the power-law index and differential flux at 7 TeV, F7,
reported by HAWC. Theflux is reported at 7 TeV because this energy results in the least correlation between spectral index and flux. If the source was identified in an extended-source map, then thefit result with an integration radius used for the
110
extended-source search is shown. In addition to the catalog values, we present the minimum energy and maximum energy of the central interval that contributes 75% of the TS for a given source as E12.5and E87.5. The exact values of E12.5and E87.5
depend on both source declination and spectral index and are determined individually for each source. If E87.5 exceeds
100 TeV, we only report a lower bound, as the data analysis techniques used for the 2HWC catalog are unable to measure energies higher than approximately this value. The exposure time of VERITAS for each source varies from 1.3 to 72 hr, as shown in Table 2. We analyzed 8.5 years of Fermi-LAT data from 2008 August to 2017 February for the study.
3. Follow-up Instruments and Analyses 3.1. VERITAS
VERITAS is an array of four IACTs located at the Fred Lawrence Whipple Observatory in southern Arizona(Weekes et al. 2002). Each telescope has a tessellated 12 m diameter
reflector that is used to collect the Cherenkov light generated by gamma-ray-initiated particle cascades (or air showers) in the Earth’s atmosphere. A camera composed of 499 PMTs is installed at the focal plane of each reflector and used to record an image of the cascades. VERITAS is designed to detect gamma rays from an energy of 85 GeV to energies higher than 30 TeV, over afield of view with a diameter of 3°.5. Since the beginning of full array operations in 2007, the sensitivity of VERITAS has been improved by two major upgrades (Park, N. for the VERITAS Collaboration2015): the relocation of one
telescope in 2009 (Perkins & Maier, G. for the VERITAS Collaboration 2009) and the upgrade of the camera with
high-quantum-efficiency PMTs in 2012 (D.B. Kieda for the
VERITAS Collaboration2013). With its current configuration,
VERITAS can detect a point source with 1% of theflux from the Crab Nebula within 25 hr and has an angular resolution better than 0°.1 at 1 TeV.
The VERITAS analysis begins with standard calibration and image-cleaning procedures, after which each image is para-meterized geometrically. A standard Hillas moment parameter-ization is used for this study (Hillas 1985); a detailed
description of the VERITAS data analysis procedure can be
found in Daniel, M.K. for the VERITAS Collaboration(2007).
Selection cuts are then applied to the data in order to discriminate gamma-ray-initiated events from the otherwise overwhelming background of cosmic-ray-initiated cascades. The choice of the optimum gamma-ray selection cuts depends upon the assumed properties of the source candidate, provided by HAWC in this case. The peak sensitivity of HAWC is located in the multi-TeV energy range. For source regions on which the VERITAS exposure is larger than 10 hr, we apply strict gamma-ray selection cuts that are optimized for objects with a hard spectral index and with a weak signal(∼1% of the steady Crab Nebula flux). These cuts provide the best sensitivity for gamma rays with energies higher than∼1 TeV (Park, N. for the VERITAS Collaboration 2015) while still
providing good sensitivity down to 300–600 GeV. For exposures shorter than 10 hr, we chose a less strict set of cuts suitable for stronger sources (3% Crab), which retain more gamma rays at the expense of higher background. This is justified by the fact that a weaker source would be below the sensitivity of VERITAS in such a short exposure. Additional gamma-ray discrimination is achieved by cutting on θ, the angular distance between a test position on the sky and the shower arrival direction. The angular extension of the 2HWC sources is not well defined. Also, a source that appears point-like to HAWC may be an extended source for VERITAS because of its smaller PSF. We therefore applied two sets of angular cuts to the VERITAS search: one for a point-like source(θ<0°.1) and the other for a source with moderately large angular extent (θ<0°.3 for 2HWC J1953+294 and θ<0°.23 for the rest of the sources). The results described here have been confirmed by two independent analysis chains (Cogan, P. for the VERITAS Collaboration 2007; Maier & Holder2017).
3.2. Fermi-LAT
The LAT is a high-energy gamma-ray telescope that detects
photons from 20 MeV to higher than 500 GeV(Atwood
et al. 2009). Since the launch of the spacecraft in 2008 June,
the event-level analysis has been improved based on our increased knowledge of the detectors. The latest version, dubbed Pass 8(Atwood et al.2013), offers a greater acceptance
Table 1
List of HAWC Sources for the Fermi-VERITAS Follow-up Study
Name Id TS R.A. Decl. Unc. Index F7 E12.5 E87.5
(°) (°) (°) (10−15cm−2s−1TeV−1) (TeV) (TeV)
2HWC J0700+143 1 29 105.12 14.32 0.80 2.17±0.16 13.8±4.2 2.3 >100 2HWC J0819+157 0.5 30.7 124.98 15.79 0.17 1.50±0.67 1.6±3.1 25 >100 2HWC J1040+308 0.5 26.3 160.22 30.87 0.22 2.08±0.25 6.6±3.5 6 >100 2HWC J1852+013* PS 71.4 283.01 1.38 0.13 2.90±0.10 18.2±2.3 0.4 50 2HWC J1902+048* PS 31.7 285.51 4.86 0.18 3.22±0.16 8.3±2.4 0.3 11 2HWC J1907+084* PS 33.1 286.79 8.50 0.27 3.25±0.18 7.3±2.5 0.18 10 2HWC J1914+117* PS 33 288.68 11.72 0.13 2.83±0.15 8.5±1.6 0.5 42 2HWC J1928+177 PS 65.7 292.15 17.78 0.07 2.56±0.14 10.0±1.7 0.9 86 2HWC J1938+238 PS 30.5 294.74 23.81 0.13 2.96±0.15 7.4±1.6 0.3 29 2HWC J1949+244 1 34.9 297.42 24.46 0.71 2.38±0.16 19.4±4.2 1.1 >100 2HWC J1953+294 PS 30.1 298.26 29.48 0.24 2.78±0.15 8.3±1.6 0.6 55 2HWC J1955+285 PS 25.4 298.83 28.59 0.14 2.40±0.24 5.7±2.1 1.6 >100 2HWC J2006+341 PS 36.9 301.55 34.18 0.13 2.64±0.14 9.6±1.9 1.0 86 2HWC J2024+417* PS 28.4 306.04 41.76 0.20 2.74±0.17 12.4±2.6 1.0 100
Note.Data for individual sources are taken from the 2HWC catalog(Abeysekara et al.2017a), with the exception of E12.5and E87.5. Detailed description is in Section2.2.
compared to previous LAT data and an improved PSF (with a 68% containment radius less than 0°.2 above 10 GeV that is nearly constant with increasing energy). Together, these two factors significantly improve the detection of sources at
energies above 10 GeV. To search for a counterpart of HAWC sources with Fermi-LAT data, we decided to focus on these high-energy events. By limiting the analysis to high energies, we reduce contamination from diffuse Galactic emission. All
Table 2
Sources Not Detected by VERITAS and Fermi-LAT
Fermi-LAT VERITAS HAWC
Point source Test Extended source Exposure Ethr Point source Extended source Integrated Source name Index upper limit radius upper limit time upper limit upper limit fluxa
(10−11cm−2s−1) (°) (10−11cm−2s−1) (hr) (GeV) (10−12cm−2s−1) (10−12cm−2s−1) (10−12cm−2s−1) 2HWC J0700+143 2.0 4.1 1.0 6.1 5.6 290 L 6.8 3.9±1.9 2.17 4.0 6.2 260 L 7.7 3.0 3.4 5.7 240 L 9.0 2HWC J0819+157 2.0 1.8 0.5 2.3 4.5 220 2.4 2.7 0.11±0.25 1.5 1.6 1.9 240 3.1 2.5 3.0 2.0 2.7 200 3.0 3.3 2HWC J1040+308 2.0 1.7 0.5 2.0 3.1 220 5.7 10 1.8±1.5 2.08 1.7 2.0 L L L 3.0 1.6 2.0 200 7.9 13 2HWC J1852+013* 2.0 2.9 0.23 3.8 10 660 0.41 1.1 7.1±1.6 2.9 3.0 4.2 L L L 3.0 3.0 4.2 420 0.84 2.3 2HWC J1902+048* 2.0 3.3 0.23 4.57 20 550 0.79 1.6 11±5.1 3.22 4.9 6.6 460 0.99 1.6 3.0 4.7 6.3 500 0.83 1.6 2HWC J1907+084* 2.0 2.3 0.23 3.1 4.9 290 5.1 7.1 45±28 3.25 2.5 3.5 240 7.7 10 3.0 2.5 3.5 260 6.3 10 2HWC J1914+117* 2.0 3.4 0.23 3.9 2.2 260 3.0 4.4 13±6.0 2.83 3.7 4.5 260 3.5 4.7 3.0 3.7 4.5 260 3.6 4.8 2HWC J1928+177 2.0 4.9 0.23 6.5 44 500 0.63 2.0 3.2±1.1 2.56 5.3 6.9 460 0.68 2.2 3.0 5.4 7.0 320 1.3 4.2 2HWC J1938+238 2.0 3.4 0.23 4.6 2.9 320 1.3 4.5 14±6.2 2.96 3.3 4.5 290 1.5 5.3 3.0 3.3 4.5 260 1.8 6.4 2HWC J1949+244 2.0 3.5 1.0 12 1.8 220 5.0 24 11±5.6 2.38 3.4 12 220 5.6 27 3.0 3.4 10 200 7.6 36 2HWC J1955+285 2.0 2.7 0.23 3.4 46 320 0.61 2.7 2.2±1.5 2.40 2.7 3.5 320 0.63 2.8 3.0 2.7 3.4 320 0.62 2.7 2HWC J2006+341 2.0 3.4 0.23 48 7.0 290 0.61 5.8 9.1±3.9 2.64 3.4 47 260 0.80 7.5 3.0 3.4 46 240 0.84 7.9 2HWC J2024+417* 2.0 2.8 0.23 5.9 40 720 0.41 0.8 4.2±1.7 2.74 3.2 6.59 550 0.69 1.2 3.0 3.3 6.54 550 0.73 1.5 Note. a
The integratedflux shown here for HAWC is calculated by using the spectral shape provided by HAWC’s measurement over the energy range provided by VERITAS’s analysis for each source.
but three of the HAWC sources investigated here lie within 2°.5 of the Galactic plane(the sources outside the plane lie at a right ascension of less than 11 hr). The LAT energy selection also limits confusion from gamma-ray pulsars in the Galactic plane because gamma-ray pulsar spectra typically roll over in the few-GeV energy range. For energies lower than 10 GeV, we utilized publicly available information from the Fermi-LAT Third Source Catalog(3FGL; Acero et al. 2015).
As the starting point for our analysis, we used a model based on the Third Catalog of Hard Fermi-LAT Sources(3FHL; Ajello et al. 2017) and the Fermi Galactic Extended Source
(FGES) catalog(Ackermann et al. 2017). The 3FHL catalog
contains sources detected between 10 GeV and 2 TeV using 7 years of Pass 8 data, while the FGES catalog focuses on the study of extended sources discovered in the same energy range using 6 years of Pass 8 data. For the unassociated HAWC sources discussed here, there are no spatially coincident LAT sources detected in either catalog. To search for new LAT counterparts and to place upper limits at the position of these new HAWC sources, we analyzed 8.5 years of LAT data from 2008 August to 2017 February using Pass 8 SOURCE photons with reconstructed energies in the 10 GeV–0.9 TeV range. To limit contamination from Earth limb photons, we excluded photons at zenith angles larger than 105°. The Fermi Science Tools v10r01p01, the instrument response functions (IRFs) P8R2 SOURCE V6, and the fermipy v0.13 analysis package (Wood et al. 2017) were used for this analysis. To model
the diffuse backgrounds, we used the standard templates for isotropic and Galactic interstellar emission111developed by the LAT collaboration.
The analysis proceeded as follows. A 10° square region centered around each HAWC source is fit using a binned likelihood formalism. We first place a point source at the location of the HAWC source. The source is modeled by a
power-law energy spectrum with freely fit index and
normalization throughout the fit. Using fermipy, we attempt to localize any putative gamma-ray source around the HAWC position. A source is considered detected if it has a TS greater than 25, defined asTS= -2 ln(Lmax,0 Lmax,1), where Lmax,0is
the maximum-likelihood value for a model without an additional source (the “null hypothesis”), and Lmax,1 is the
maximum-likelihood value for a model with the additional source at a specified location. We repeat this procedure with a uniformly illuminated disk with an initial radius of 0°.2. The localization and extension of the disk are bothfit to search for a possible spatially extended LAT counterpart.
In the event that no significant point-like or extended source is detected, integral upper limits are computed at the 99% confidence level using a semi-Bayesian method provided in the Fermi Science Tools. We compute these upper limits for three different power-law spectral indices: 2.0, 3.0, and the index reported in 2HWC. A pivot energy of 20 GeV is assumed for the conversion to a differential flux limit as the LAT has a decreasing sensitivity with increasing energy above 10 GeV. We compute upper limits assuming either a point-source model or an extended source. For the extended-source model, we choose an extension equal to that estimated in 2HWC or the approximate localization of a point source by HAWC(∼0°.2).
4. Results
The energy ranges of Fermi-LAT, VERITAS, and HAWC for this study are shown in Figure 1. The Fermi-LAT energy ranges are determined by event selections, and they are the same for all of the selected sources. The VERITAS energy range varies from source to source due to different gamma-ray selection cuts used for the analyses and different observational conditions. The energy threshold value of the analysis sets the minimum energy range, while the maximum energy range is set to 30 TeV to choose events reconstructed with energy bias smaller than 10%. For HAWC, the energy ranges correspond to the central 75% of energies contributing to the TS for the source.
Figure 1.Energy range comparisons between the three instruments. The energy coverage for each instrument is shown as the green block for Fermi-LAT, red block for VERITAS, and blue block for HAWC.
111
Galactic IEM: gll_iem_v06.fits, Isotropic: iso_P8R2_SOURCE_ V6_v06.txt. Please see http://fermi.gsfc.nasa.gov/ssc/data/access/lat/ BackgroundModels.html.
Fermi-LAT did not detect counterparts for any of the 14 HAWC sources considered in this study, in either the point-source or extended-point-source searches. Only one gamma-ray source was detected by VERITAS out of 14 selected sources. The detected gamma-ray source was found in the region of
2HWC J1953+294.
4.1. Sources Not Detected by Fermi-LAT and VERITAS For sources that are not detected by Fermi-LAT and VERITAS, upper limits are calculated at the 99% confidence level by using three spectral indices: 2.0, 3.0, and the spectral index reported by HAWC. Spectral indices of 2.0 and 3.0 are selected to consider possible spectral changes from HAWC’s energy range to the lower energy band. Upper limits from Fermi-LAT and VERITAS for the nondetected 13 sources are shown in Table 2. The upper limits for Fermi-LAT and VERITAS are calculated at the location of each HAWC source over energy ranges shown in Figure 1.
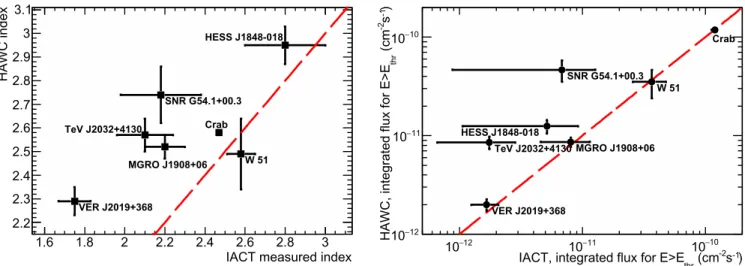
To compare the VERITAS upper limits with the flux
measurement of HAWC, we calculate the integratedflux from each source in the VERITAS energy range, using the spectral information measured by HAWC. The result is shown in Figure2. Error bars for the HAWCflux estimates were derived with error propagation using the statistical errors of the flux normalization factors at 7 TeV and the indices. The systematic errors of the HAWC flux shown as brackets were calculated with a flux normalization error of 50% and an index error of 0.2(Abeysekara et al.2017b).
For the point-source search, the VERITAS upper limits are lower than the expected flux estimated by using HAWC’s spectral information by more than 1σ for most of the sources
except three: 2HWC J0819+157, 2HWC J1040+308, and
2HWC J1949+244. For the extended-source search, there are three sources, 2HWC J1852+013*, 2HWC J1902+048*, and 2HWC J2024+417*, for which the VERITAS upper limits using the integration radius of 0°.23 are lower than the flux
estimated by HAWC by more than 1σ. The upper limits of the other 10 sources are consistent with the HAWCflux estimation within 1σ. VERITAS detected gamma-ray emission from 2HWC J1953+294, but there is a discrepancy in the flux
estimation between VERITAS and HAWC (discussed in
Section4.3).
We also compared the upper limits of Fermi-LAT with the extrapolation of HAWC’s spectra to Fermi-LAT energy ranges. Because the Fermi-LAT energy range is much lower than HAWC’s energy range, the extrapolation has larger uncertain-ties. In this study, we found that both point- and extended-source upper limits calculated with Fermi-LAT are lower than HAWC’s flux extrapolation by more than 1σ for five sources: 2HWC J1852+013*, 2HWC J1914+117*, 2HWC J1928+177,
2HWC J1938+238, and 2HWC J1953+294. For 2HWC J2006
+341, only the point-source upper limit is lower than HAWC’s flux estimation.
Individual SEDs of selected 2HWC sources are shown in the
Appendixtogether with the upper limits from Fermi-LAT and VERITAS.
4.2. SNR G54.1+0.3 Region
The first region that we discuss in detail contains two
HAWC sources: 2HWC J1930+188 and 2HWC J1928+177.
2HWC J1930+188 is coincident with a TeV source pre-viously identified by VERITAS, VER J1930+188(Acciari et al.2010), while 2HWC J1928+177 is newly identified by
HAWC. The VERITAS excess counts map of this region is shown in Figure3.
4.2.1. SNR G54.1+0.3
VERITAS detected a point-like source of TeV gamma-ray emission, VER J1930+188, coincident with SNR G54.1+0.3 in this region(Acciari et al. 2010). H.E.S.S. also recently
reported a detection of the source, HESS J1930+188, in their Galactic plane survey(H.E.S.S. Collaboration et al.2018). The
Figure 2.Integrated photonflux comparison between HAWC and VERITAS. For the comparison, the energy range of the VERITAS analysis shown with red blocks in Figure1was used. The error bars for the HAWCflux are statistical errors derived from the propagation of statistical errors on the normalization factors and indices. The systematic error of the HAWCflux is shown with blue horizontal ticks. VERITAS flux upper limits are calculated assuming a power-law distribution with HAWC’s spectral index for each source.
centroid and integral flux measured by H.E.S.S. agree with VERITAS within statistical and systematic errors. The VERITAS source is associated with SNR G54.1+0.3, a PWN surrounding a radio/X-ray pulsar, PSR J1930+1852.
Fermi-LAT analysis of this region detected a point source coincident with VER J1930+188 with a TS value of 26. The centroid of the point source is R.A., decl.(J2000)=19h30m16 8, 18°55′48 0 with an uncertainty of 1 8. As shown in Figure4, the flux measured by LAT is consistent with VERITAS measure-ments. The nondetection of SNR G54.1+0.3 in the 3FGL catalog indicates the possible existence of a low-energy spectral cutoff in the Fermi energy range, but the source is too faint to measure the cutoff in this study.
We also explored different possible spatial morphologies for this new Fermi-LAT gamma-ray source. The results of these tests are recorded in Table 3. Here thefigures of merit are the change in TS and the number of degrees of freedom, Ndof,
where TS is equal to twice the difference between the log likelihoods of the null hypothesis and the tested spatial model. We first tested an extended model assuming a uniformly illuminated disk-shaped source at the location of SNR G54.1 +0.3 with an initial radius of 0°.2. The best-fit extension was found to be a radius of 0°.4±0°.1. The change in TS between the point-source hypothesis and the tested spatial model is referred to as TSext. The uniform disk gives a TSext of 22
with one additional degree of freedom. Past LAT analyses and simulations of spatially extended sources find that a TSext 16 corresponds to a formal 4σ significance(Lande
et al. 2012). Following Ackermann et al. (2017), a source is
considered to be extended only if TSext>TS2pts, where
TS2pts=2ln(L2pts/Lps) is the improvement when adding a
second point source, L2ptsis the likelihood of the model with
two point sources, and Lpsis the likelihood of the model with a
single point source. In the case of 2HWC J1930+188, the extended LAT source did not meet this criterion, so it was replaced by two point sources located at the best positions found by our localization algorithm. The centroids of the two point sources are plotted as black diamonds in Figure 3. The additional point source is located 0°.3 away from SNR G54.1 +0.3 and has a TS of 17. The addition of the second source also caused the TS of the point source that is spatially coincident with SNR G54.1+0.3 to decrease from 26 to 23. In
Figure 3. VERITAS gamma-ray counts map of the SNR G54.1+0.3 region with point-source search cuts. Theθ cut used for the study, θ<0°.1, is shown as a white dashed circle. The extension of the radio emission from SNR G54.1 +0.3 (Lang et al.2010) is shown with a cyan ellipse. A zoomed-in 0°.36 by
0°.36 view around SNR G54.1+0.3 is shown on the right inset within the black box. The centroid of a known TeV source, VER J1930+188, measured by VERITAS, is shown with a yellow circle in the right inset. The centroid of the source measured by H.E.S.S. is shown with a pink circle in the inset. In the region around VER J1930+188, Fermi-LAT data are best described with a model with two point sources whose locations are indicated with black diamonds. The point source coinciding with the VERITAS source has a TS value of 23, while the other source has a TS value of 17. The four dark green crosses are the locations of 3FGL sources, with dark green ellipses showing the 1σ uncertainty of the location. The two blue “x” marks indicate the centroids of two HAWC sources in the region with 1σ uncertainty of the position marked with blue circles. Four pulsars with a spin-down luminosity higher than 1035erg s−1 are marked with red boxes. White contours are HAWC’s significance contours of 5, 6, 7, and 8σ.
Figure 4.SEDs for sources in the SNR G54.1+0.3 region. The upper panel shows the SED of SNR G54.1+0.3, and the lower panel shows the existing models for SNR G54.1+0.3 together with the SED. The blue contours show the 1σ confidence interval of HAWC’s spectrum measurements for a single power-law distribution(solid) and for a power law with a cutoff (open). Red points and upper limits are the VERITAS measurements. Green rectangles and upper limits are the measurements of the newly detected Fermi source in the SNR G54.1+0.3 region. The green solid area shows the 1σ confidence interval estimated by using the statistical errors of the Fermi spectral analysis. The black dotted line shows the best-fit leptonic model from Li et al. (2010), and the
light blue short-dashed line shows the lepton-hadron model from Tanaka & Takahara(2011). The orange dot-dashed line and the magenta solid line show
models from Torres et al.(2014) and Gelfand et al. (2015).
Table 3
Spatial Models for LAT Analysis in the Vicinity of SNR G54.1+0.3
Spatial model TS Ndof
Null hypothesis L L
Point source 26 4
Uniform disk 48 5
summary, there are not yet sufficient data to establish the spatial morphology of the LAT counterpart to SNR G54.1+0.3, and we therefore prefer a single LAT point source.
With 16 hr of additional data taken in the 2015–2016 observing season, we studied a total of 46 hr of VERITAS exposure in this region. VER J1930+188 is a point-like source for VERITAS. The updated spectrum now extends down to 120 GeV with an index of 2.18±0.20stat. This is in agreement with the
previous result, 2.39±0.23stat, within 1σ(Acciari et al.2010).
The updated normalization value at 1 TeV is (6.61.3stat)´
-10 13TeV−1cm−2s−1. For energies higher than 4.9 TeV, the
99% upper limit is 1.07×10⁻¹⁴cm−2s−1TeV−1 at 7.08 TeV assuming a spectral index of 2.18.
The HAWC source 2HWC J1930+188, coincident with
VER J1930+188, was detected in the point-source search. The centroid of 2HWC J1930+188 is shown in Figure3and agrees with both the VERITAS and Fermi centroid positions. As shown in Figure 4, the spectral index of the HAWC source, 2.74±0.12stat, is softer than that measured by VERITAS. The
significance of the difference is 2.4σ considering the statistical errors, and 1.5σ considering both systematic (∼0.2) and statistical errors. Extrapolation of the HAWC spectrum to the VERITAS energy range yields an integrated flux that is seven times larger than the VERITAS flux. Although this is still in agreement with the VERITAS measurement within 2σ statistical uncertainties, we tested whether the HAWC data favor a power-law distribution with a cutoff. To reduce the number of degrees of freedom, wefixed the index of the power law with a cutoff scenario to the index value measured by VERITAS. The results are plotted in Figure4. As summarized in Table4, the HAWC result can be explained with either a single power law or a power law with a cutoff. The extrapolation of the power law with a cutoff to VERITAS energies produces an integral flux that is only ∼50% larger than the VERITAS flux, within the 1σ statistical error, providing better agreement. While all three measurements were estimated for a point-like source, HAWC would estimate flux from a larger area than VERITAS due to their larger PSF. Because HAWC modeled a single source in the likelihood analysis for this study, the flux estimation may be influenced by emission from other sources in the region.
The likely astrophysical counterpart for both the newly detected Fermi point source, VER J1930+188, and 2HWC J1930+188 is SNR G54.1+0.3, a PWN at a distance of ∼6.5 kpc hosting a young, energetic pulsar, PSR J1930+1852, with a spin-down luminosity of 1.2×1037erg s−1 and a characteristic age of 2900 years(Camilo et al.2002). The pulsar powers a PWN, which
is observed in radio and X-rays. The gamma-ray emission from the PWN can be explained as resulting from inverse Compton
scattering of electrons accelerated at the PWN termination shock on ambient photonfields.
In the X-ray band, a torus structure with a size of 5 7 by 3 7 is detected with a jet(Lu et al.2002; Temim et al.2010), while
the diffuse emission covers a larger area with a size of 2 0 by 1 3(Temim et al.2010). The extension of the diffuse emission
is similar in the radio (Lang et al. 2010) and X-ray bands
(Temim et al.2010). Even including the diffuse emission, the
PWN is a point-like source for LAT, VERITAS, and HAWC. The SED of SNR G54.1+0.3 has been subjected to detailed study, and a number of authors have attempted to construct models of the system based on the observed emission from the radio band up to the gamma-ray band(Li et al.2010; Tanaka & Takahara2011; Torres et al. 2014; Gelfand et al. 2015). The
lower panel of Figure 4 shows the existing models together with the gamma-ray SED of the PWN emission. All of the models assume a spatially uniform magneticfield strength and particle density and include the effect of the time-dependent evolution of the PWN assuming a broken power law distribution of electron energies. Although their assumptions about the environment of the PWN and particle diffusion are slightly different, the estimated gamma-ray emission is similar for all models except in the case of the lepton-hadron model suggested by Li et al. (2010). Li et al. (2010) argued for the
lepton-hadron model because the low magneticfield strength of ∼10 μG required for the pure leptonic model is inconsistent with the∼38 μG estimated by Lang et al. (2010) based on the
radio luminosity. Li et al. (2010) also commented that the
lepton-hadron model reproduced the reported VERITAS measurement(Acciari et al.2010) better than the pure leptonic
model.Some other authors (Tanaka & Takahara2011; Torres et al. 2014) pointed out that the value derived from the
observation is based on an assumption that the energy of the pulsar wind is equally divided between the magneticfield and the particle energies. However, all other models favor a very small contribution of the wind energy to the magnetic field, ranging from 0.04% to 0.5%, indicating that the PWN is a particle-dominated nebula. The lepton-hadron model is also disfavored by the Fermi-LATflux measured in this study, as shown in Figure4. The gamma-ray emission from 3 GeV up to 100 TeV generally agrees well with the other models(Tanaka & Takahara 2011; Torres et al. 2014; Gelfand et al. 2015).
However, the soft spectral index of HAWC at energies above 1 TeV under the single power law assumption, or the low cutoff
energy of 21±15 TeV under the power law with an
exponential cutoff assumption, indicate that the maximum electron energy may be smaller than the 90% confidence interval of 0.96–2700 PeV reported by Gelfand et al. (2015).
4.2.2. 2HWC J1928+177
The other HAWC source in the region is 2HWC J1928+177. HAWC reported similar values offlux and index for this source as for 2HWC J1930+188. The HAWC analysis shows that
2HWC J1928+177 is brighter than 2HWC J1930+188 for
energies higher than 10 TeV (Lopez-Coto et al. 2017).
How-ever, VERITAS did not detect emission from this source with either the point-source search or the extended-source search.
The angular distance between 2HWC J1930+188 and
2HWC J1928+177 is 1°.18, which is larger than the PSF of HAWC for energies larger than 1 TeV. Since 2HWC J1930 +188 is point-like for TeV gamma-ray instruments, it is therefore likely that any contamination from it would result in
Table 4
Spectrum for 2HWC J1930+188 with Two Different Spectral Models
PL PL+cutoff E12.5–E87.5(TeV) 0.9–86 1.4–30 Index 2.74±0.12 2.18(fixed) Norm at 7 TeV 9.8±1.5 19.6±9.0 (10−15TeV−1cm−2s−1) Cutoff energy N/A 21±15 (TeV) TS 54 52
only a slight overestimation of the flux from 2HWC J1928 +177 as measured by HAWC. The lack of a VERITAS detection indicates that the HAWC source has a larger angular extent than the radius of 0°.1 at the confidence level of 98% and the radius of 0°.23 at the confidence level of 82%.
The position of a nearby Fermi source, 3FGL J1928.9+1739, coincides with the position of 2HWC J1928+177 within 2σ. Both sources are coincident with PSR J1928+1746, which at an age of 8.2×10⁴years and a spin-down luminosity of 1.6×1036erg s−1 is both older and less energetic than PSR J1930+1852 (Cordes et al. 2006). The flux of 3FGL J1928.9+1739 follows a log
parabola shape, and its extrapolation to energies larger than 1 TeV lies far below the flux of 2HWC J1928+177, as shown in Figure5. If the nature of both sources is tied to PSR J1928+1746, then it is possible that 3FGL J1928.9+1739 corresponds to the pulsed emission of PSR J1928+1746, while 2HWC J1928+177 may originate from a PWN. However, no pulsation is reported for 3FGL J1928.9+1749. Also, no PWN has been observed for PSR J1928+1746 in any other wavelength.
4.2.3. Other Gamma-Ray Emission in the Region
Although there are only two HAWC sources reported in this region, the extension of HAWC’s 5σ contours covers a larger area than these two sources, as shown in Figure3. It is possible that there are other weak, and possibly extended, TeV gamma-ray emitting sources yet to be identified in this region.
HAWC’s 5σ contours contain four 3FGL sources. These include 3FGL J1928.9+1739, which has been described in the previous section; 3FGL J1932.2+1916, a LAT pulsar; and two unassociated LAT sources, 3FGL J1928.4+1838 and 3FGL J1925.4+1727. 3FGL J1925.4+1727 is located near a young pulsar, PSR J1925+1720, which has a spin-down luminosity of 1036erg s−1 (Lyne et al. 2017). Similar to
3FGL J1928.9+1739, the extrapolation of the SEDs of these two unassociated LAT sources to energies higher than 1 TeV yields less than 1% of the Crab PWN flux. Thus, this source
likely does not directly correspond to what HAWC measured in the region.
Future observations with longer exposure from HAWC and follow-up from IACTs will be necessary to study the nature of the gamma-ray emission in the region and the connections with these unassociated Fermi-LAT sources.
4.3. DA 495 Region
The second area we discuss in detail is a region around
PWN DA 495 (SNR G065.7+01.2). HAWC detected two
point-like sources in this region: 2HWC J1953+294 and
2HWC J1955+285.
Analysis of Fermi-LAT data for the energy range from 10 to 900 GeV did not detect gamma-ray emission in either the point-source search or the extended-point-source search.
4.3.1. PWN DA 495
After 37 hr of observation, VERITAS reported a con firma-tion of weak gamma-ray emission coincident with 2HWC J1953+294 (Holder et al. 2016) with an extended-source
analysis (θ<0°.3). After this initial report, VERITAS continued observing the source and accumulated a total of 72 hr of data on the field of view by summer 2017. With a maximum significance of 5.2σ, VERITAS detected emission near 2HWC J1953+294. The emission observed by VERITAS is centered at R.A. 19h52m15s±9stats , decl. 29°23′±01′stat,
assuming that the spatial distribution of the emission follows a simple 2D-Gaussian distribution; hence, we assign the name VER J1952+293. The best-fit sigma value of the 2D-Gaussian is 0 . 14 0 . 02stat. The distribution of gamma-ray emission in
the region observed by VERITAS is shown in Figure6. The upper panel of Figure7 shows the SEDs of gamma-ray emission measured around 2HWC J1953+294. The VERITAS flux was calculated by integrating gamma rays within a 0°.3
radius around the centroid, while the HAWC flux was
estimated based on a point-like assumption. Theflux measured by VERITAS is well described by a power-law distribution with an index of 2.65±0.49stat, which is in good agreement
with the index measured by HAWC, 2.78±0.15stat. But the
flux normalization value at 1 TeV measured by VERITAS is
´
-(2.84 0.54stat) 10 13cm−2s−1TeV−1, about seven times lower than the extrapolated flux value of HAWC’s measure-ment to 1 TeV, 1.86×10⁻¹²cm−2s−1TeV−1. The difference between the two measurements is significant at the level of 2.4σ when considering only statistical errors. Because VERITAS’s analysis is using 0°.3 as an integration radius while HAWC assumes it to be a point-like source, potentially the flux disagreement can be larger. Unlike the discrepancy shown in SNR G54.1+0.3, the index measurements by the two instruments are in good agreement, and the energy ranges of both measurements are very similar. This suggests that a change of spectral index may not be the reason for the discrepancy of theflux estimations.
We checked the details of both VERITAS and HAWC analyses for potential causes of the discrepancy. For the background estimation, VERITAS excluded events falling within 0°.3 of 2HWC J1955+285 and two bright stars in the field of view. The same exclusion radius was used for the pulsars PSR J1954+2836 and PSR J1958+2846, while an exclusion region of radius 0°.34 was used for 2HWC J1953 +294 in order to cover the extension of the radio PWN. The
Figure 5. SED of 2HWC J1928+177. The blue solid area shows the 1σ confidence interval of HAWC’s spectrum measurements. The solid red lines show the VERITAS upper limits from the point-source search, assuming either the spectral index measured by HAWC or a spectral index of 2. The dashed red lines show the VERITAS upper limits from the extended-source search for the same spectral indices. The corresponding Fermi-LAT upper limits are shown as teal dot-dashed lines for the point-source search and teal dashed lines for the extended-source search. The green triangle points and dashed line show the flux of the nearby 3FGL source, 3FGL J1928.9+1739.
background distribution after these exclusions was reasonable. If there is diffuse emission covering a very large area and weak enough not to be detected by the extended analysis of HAWC, this kind of discrepancy is possible. This is because the
standard analysis of VERITAS obtains its background regions from the same field of view, while HAWC’s flux estimation would include both source and diffuse emission. For the HAWC analysis, we re-estimated the HAWCflux after adding a uniform, diffuse source to the model for the emission, which reduced HAWC’s flux for 2HWC J1953+294 only by 10%–15%. The flux reported in the 2HWC catalog can also be overestimated if there is a nearby source, because HAWC’s analysis performed for the 2HWC catalog assumes a single source for their likelihood analysis. We re-estimated theflux of 2HWC J1953+294 after removing the contribution from the nearby source, 2HWC J1955+285, assuming it to be a point-like source. The result shows only ∼3% smaller flux for 2HWC J1953+294 compared to what was reported in the 2HWC catalog. It is possible that the nearby 2HWC J1955 +285 is extended, in which case the flux of DA 495 reported by HAWC may be overestimated due to contamination from
this source. A scenario in which 2HWC J1955+285 is
extended could also better explain the VERITAS nondetection of this source.
Drawingfirm conclusions about the discrepancy between the VERITAS and HAWC observations in this field of view is challenging because of the relatively weak signals (TS of 25–30) of the sources reported in the 2HWC catalog. Further detailed study with larger HAWC exposure and advanced analysis including multisource likelihood analysis will be necessary to understand the discrepancy.
We did not detect gamma-ray emission from 2HWC J1953 +294 with the Fermi-LAT analysis. The upper limit was obtained by assuming the source extension to be similar to the extension of radio emission from DA 495, which is∼25′(Kothes et al.2008).
The upper limit at the 99% confidence level is 8.17× 10⁻¹¹cm−2s−1with an assumption of spectral index of 2.78, and 8.00×10⁻¹¹cm−2s−1with an assumption of spectral index of 2. Assuming that the spectral index measured by HAWC will not change down to 10 GeV, the upper limit we calculated disagrees with HAWC’s flux estimation at a confidence level of 85%.
The likely counterpart of 2HWC J1953+294 and VER J1952 +293 is the PWN DA 495. As shown in Figure 6, the emission seen by VERITAS overlaps with the radio contours of DA 495, an X-ray compact source, 3FGL J1951.61+2926, and 2HWC J1953 +294. DA 495 is seen as an extended, central concentration of emission in the radio band. X-ray observations by ROSAT and ASCA revealed a compact central object, 1WGA J1952.2+2925, surrounded by an extended nonthermal X-ray source (Arzouma-nian et al. 2004). The implied blackbody temperature and
luminosity, measured by Chandra, suggest that the central object is an isolated neutron star. Together with the extended emission surrounding the compact object, this confirms the PWN interpretation of the source(Arzoumanian et al. 2004, 2008).
Kothes et al.(2008) suggested that DA 495 may be an aging PWN
with an age of ∼20,000 yr, based on the low-energy break measured in the radio band. Nondetection of an SNR shell suggests that the supernova exploded in a very low density environment. The distance to DA 495 is estimated to be 1.0±0.4 kpc based on HI absorption measurements(Kothes et al.2008). The extension of the PWN is 25′ (Kothes et al.2008)
in radio and ∼40″ in X-ray (Arzoumanian et al. 2008). The
detected TeV gamma-ray extension by VERITAS matches well with the radio extension.
Figure 6. VERITAS gamma-ray counts map of the PWN DA 495 and the surrounding region with extended-source search cuts,θ<0°.3. The region used for the spectral analysis with VERITAS data is shown with a white dashed circle. The yellow circle is the centroid measured by VERITAS. Two dark green crosses and ellipses are the location and 1σ uncertainty of the location of 3FGL sources. Blue“x” marks indicate the centroids of two HAWC sources in the region, with blue circles showing 1σ uncertainty. White contours are HAWC’s significance contours of 5σ. The cyan diamond is the location of an X-ray compact source, 1WGA J1952.2+2925 (Arzoumanian et al.2004). Light
pink contours show the radio contours around PWN DA 495 measured by the Canadian Galactic Plane Survey in the 1.42 GHz band(Taylor et al.2003). The
extension of radio emission from SNR G65.1+0.6 is marked with a dashed black line.
Figure 7. Fermi-LAT, VERITAS, and HAWC flux measurements in the vicinity of the PWN DA 495. Green triangles and dashed line show theflux of nearby 3FGL sources, 3FGL J1951.6+2926. The teal rectangles are the upper limits of Fermi-LAT data assuming the extension of the source to be 25′. Blue solid regions are HAWC’s flux measurements. Red squares are the flux measurement from VERITAS withθ<0°.3.
There is a Fermi-LAT source, 3FGL J1951.61+2926, coincident with DA 495. The extrapolated flux of this source
to the HAWC energy range is much lower than the flux
measured by HAWC, as shown in Figure 7. Karpova et al. (2015) suggested that 3FGL J1951.61+2926 is likely
asso-ciated with the central pulsar of DA 495, although no evidence for pulsations has been identified.
4.3.2. 2HWC J1955+285
The second HAWC source in the region, 2HWC J1955 +285, is 1° away from 2HWC J1953+294. There is a nearby radio-quiet gamma-ray pulsar, PSR J1954+2836, detected by Fermi-LAT (3FGL J1954.2+2836). The positions of this pulsar and 2HWC J1955+285 agree within 2σ. But, similar to DA 495, the extrapolation of PSR J1954+2836 to higher energies lies far below HAWC’s flux measurement, as shown in Figure8.
These sources are within the extent of SNR G65.1+0.6, a very faint shell-type SNR detected in the radio band (Landecker et al. 1990; Kothes et al. 2006). Tian & Leahy
(2006) reported the distance to the SNR to be 8.7–10.1 kpc and
the average diameter of the SNR to be 70′. The large size and diffusive appearance of the SNR suggest that it likely exploded in a low-density environment (Kothes et al. 2006; Tian & Leahy 2006). The size of the SNR is larger than the PSF of
HAWC. However, even though 2HWC J1955+285 is found in the HAWC point-source search, the 2HWC analysis cannot rule out the possibility of the source being extended. As
mentioned in the previous section, the measured flux
discrepancy between VERITAS and HAWC on DA 495 can be explained as an overestimation of the 2HWC flux due to contamination from 2HWC J1955+285 if this source has a large extension. Further studies with additional HAWC exposure will be needed to clarify the connection between 2HWC J1955+285 and SNR G65.1+0.6.
Figure 6 shows that VERITAS sees a region of excess gamma-ray counts around 2HWC J1955+285. The maximum pretrial significance in this region is 3.5σ offset by 0°.35 from the position of the HAWC source. With the current data set, it is unclear whether this is a weak source or simply a statistical fluctuation.
5. Discussion
5.1. VERITAS Follow-up Studies of Unassociated 2HWC Sources
As shown in Figure 1, there is large overlap between the energy range covered by HAWC and VERITAS for most of the sources selected for this study. Since the VERITAS sensitivity for a point source is better than that of HAWC, VERITAS should be able to detect a small-sized (radius <0°.5) source with a substantially shorter exposure time. The angular resolution of VERITAS is also better than that of HAWC, so a VERITAS measurement should provide additional insight into the source morphology and extension.
New HAWC sources generally have low TS values compared to the 2HWC sources associated with known TeV gamma-ray-emitting sources. Among the 14 sources we selected for this follow-up study, 11 sources have a TS value less than 36, except for 2HWC J1852+013*, 2HWC J1928 +177, and 2HWC J2006+341. The average spectral index of the selected sources is 2.6, with individual indices ranging from 1.5 to 3.3.
Among the 14 selected new sources, four were detected by an extended-source search with HAWC. These sources are
2HWC J0700+143, 2HWC J0819+157, 2HWC J1040+308,
and 2HWC J1949+244. Of these, 2HWC J0700+143 and
2HWC J1949+244 were detected by the search for sources
with an extension of 1°, while 2HWC J0819+157 and
2HWC J1040+308 were detected by the search for sources with an extension of 0°.5. The exposure of VERITAS on these sources is relatively small(1.8∼5.8 hr), and the upper limits are not strongly constraining.
The other 10 sources were found by a search for point-like sources with HAWC. Nine of the 10 sources were not detected by VERITAS, and wefind that the 99% flux upper limits from VERITAS(assuming a point-source hypothesis) are lower than the expectedflux obtained from the best-fit spectra provided by HAWC. Treating the uncertainties in the HAWC fluxes as Gaussian and considering the statistical errors only, we can
exclude six sources—2HWC J1852+013*, 2HWC J1902
+048*, 2HWC J1928+177, 2HWC J1938+238, 2HWC J2006
+341, 2HWC J2024+417*—as being point sources with the
same power-law energy distribution as measured by HAWC with 95% confidence level. It is possible to explain this disagreement with a changing spectral shape, as we have demonstrated with SNR G54.1+0.3, if the source is indeed point-like to VERITAS and HAWC.
In the extended-source analysis by VERITAS, the upper limits are less constraining. With angular cuts of 0°.23, the
upper limits measured by VERITAS agree with the flux
estimated from HAWC for all but three sources: 2HWC J1852 +013*, 2HWC J1902+048*, and 2HWC J1907+084*. The
discrepancy between the VERITAS and HAWC measurements is especially large for 2HWC J1852+013* and 2HWC J1902 +048*. The measurements for these two sources disagree at a
confidence level of greater than 95%. Both of these sources have relatively large VERITAS exposures(>10 hr). To satisfy both the VERITAS upper limit and the measured HAWCflux, the source extension must be larger than a radius of 0°.23.
Figure 8.SED of 2HWC J1955+285. The description of the blue solid region, red lines, and teal lines are the same as in Figure5. The green triangles and dashed line show theflux of the nearby 3FGL source, 3FGL J1954.2+2836.