HAL Id: hal-02903357
https://hal.archives-ouvertes.fr/hal-02903357
Submitted on 15 Sep 2020
HAL is a multi-disciplinary open access
archive for the deposit and dissemination of
sci-entific research documents, whether they are
pub-lished or not. The documents may come from
teaching and research institutions in France or
abroad, or from public or private research centers.
L’archive ouverte pluridisciplinaire HAL, est
destinée au dépôt et à la diffusion de documents
scientifiques de niveau recherche, publiés ou non,
émanant des établissements d’enseignement et de
recherche français ou étrangers, des laboratoires
publics ou privés.
modeled solar-induced chlorophyll fluorescence in
response to light conditions
Nicholas Parazoo, Troy Magney, Alex Norton, Brett Raczka, Cédric Bacour,
Fabienne Maignan, Ian Baker, Yongguang Zhang, Bo Qiu, Mingjie Shi, et al.
To cite this version:
Nicholas Parazoo, Troy Magney, Alex Norton, Brett Raczka, Cédric Bacour, et al.. Wide discrepancies
in the magnitude and direction of modeled solar-induced chlorophyll fluorescence in response to light
conditions. Biogeosciences, European Geosciences Union, 2020, 17 (13), pp.3733-3755.
�10.5194/bg-17-3733-2020�. �hal-02903357�
https://doi.org/10.5194/bg-17-3733-2020 © Author(s) 2020. This work is distributed under the Creative Commons Attribution 4.0 License.
Wide discrepancies in the magnitude and direction of
modeled solar-induced chlorophyll fluorescence in
response to light conditions
Nicholas C. Parazoo1, Troy Magney2, Alex Norton1, Brett Raczka3, Cédric Bacour4, Fabienne Maignan5, Ian Baker6, Yongguang Zhang7, Bo Qiu7, Mingjie Shi8, Natasha MacBean9, Dave R. Bowling3, Sean P. Burns10,11,
Peter D. Blanken10, Jochen Stutz12, Katja Grossmann13, and Christian Frankenberg1,14
1Jet Propulsion Laboratory, California Institute of Technology, Pasadena, California, USA 2Department of Plant Sciences, University of California Davis, Davis, California, USA 3School of Biological Sciences, University of Utah, Salt Lake City, Utah, USA 4NOVELTIS, 153 rue du Lac, 31670 Labège, France
5Laboratoire des Sciences du Climat et de l’Environnement, LSCE/IPSL, CEA-CNRS-UVSQ,
Université Paris-Saclay, Gif-sur-Yvette, France
6Cooperative Institute for Research in the Atmosphere, Colorado State University, Fort Collins, Colorado, USA 7International Institute for Earth System Sciences, Nanjing University, Qixia District, Jiangsu Province, China 8Joint Institute for Regional Earth System Science and Engineering, University of California Los Angeles,
Los Angeles, California, USA
9Department of Geography, Indiana University Bloomington, Bloomington, Indiana, USA 10Department of Geography, University of Colorado Boulder, Boulder, Colorado, USA
11Mesoscale & Microscale Meteorology Lab, National Center for Atmospheric Research, Boulder, Colorado, USA 12Atmospheric & Oceanic Sciences, University of California Los Angeles, Los Angeles, California, USA
13Institute of Environmental Physics, Heidelberg University, Heidelberg, Germany
14Division of Geological and Planetary Sciences, California Institute of Technology, Pasadena, California, USA
Correspondence: Nicholas C. Parazoo (nicholas.c.parazoo@jpl.nasa.gov) Received: 24 December 2019 – Discussion started: 3 February 2020 Revised: 11 May 2020 – Accepted: 8 June 2020 – Published: 16 July 2020
Abstract. Recent successes in passive remote sensing of far-red solar-induced chlorophyll fluorescence (SIF) have spurred the development and integration of canopy-level fluorescence models in global terrestrial biosphere models (TBMs) for climate and carbon cycle research. The inter-action of fluorescence with photochemistry at the leaf and canopy scales provides opportunities to diagnose and con-strain model simulations of photosynthesis and related pro-cesses, through direct comparison to and assimilation of tower, airborne, and satellite data. TBMs describe key pro-cesses related to the absorption of sunlight, leaf-level fluo-rescence emission, scattering, and reabsorption throughout the canopy. Here, we analyze simulations from an ensem-ble of process-based TBM–SIF models (SiB3 – Simple
Bio-sphere Model, SiB4, CLM4.5 – Community Land Model, CLM5.0, BETHY – Biosphere Energy Transfer Hydrology, ORCHIDEE – Organizing Carbon and Hydrology In Dy-namic Ecosystems, and BEPS – Boreal Ecosystems Pro-ductivity Simulator) and the SCOPE (Soil Canopy Obser-vation Photosynthesis Energy) canopy radiation and vegeta-tion model at a subalpine evergreen needleleaf forest near Niwot Ridge, Colorado. These models are forced with lo-cal meteorology and analyzed against tower-based contin-uous far-red SIF and gross-primary-productivity-partitioned (GPP) eddy covariance data at diurnal and synoptic scales during the growing season (July–August 2017). Our primary objective is to summarize the site-level state of the art in TBM–SIF modeling over a relatively short time period
(sum-mer) when light, canopy structure, and pigments are simi-lar, setting the stage for regional- to global-scale analyses. We find that these models are generally well constrained in simulating photosynthetic yield but show strongly divergent patterns in the simulation of absorbed photosynthetic active radiation (PAR), absolute GPP and fluorescence, quantum yields, and light response at the leaf and canopy scales. This study highlights the need for mechanistic modeling of non-photochemical quenching in stressed and unstressed environ-ments and improved the representation of light absorption (APAR), distribution of light across sunlit and shaded leaves, and radiative transfer from the leaf to the canopy scale.
1 Introduction
Our ability to estimate and measure photosynthesis beyond the leaf scale is extremely limited. This inhibits the ability to evaluate the performance of terrestrial biosphere models (TBMs) that are designed to quantify the direct impact and feedbacks of the carbon cycle with climate change. Con-sequently, there are substantial uncertainties in estimating the gross primary production (GPP) response to environ-mental changes and carbon–climate feedback (Friedlingstein et al., 2014). The global, multiscale remote sensing of solar-induced fluorescence (SIF) may represent a major break-through in alleviating this deficiency (Mohammed et al., 2019). Spaceborne data indicate a linear relationship between SIF and GPP at large spatial (kilometer) and temporal (bi-weekly) scales (e.g., Sun et al., 2017) for several ecosys-tems, while theoretical models and ground-based measure-ments indicate a more nonlinear relationship at the leaf and canopy scales (Zhang et al., 2016; Gu et al., 2019a; van der Tol et al., 2014; Magney et al., 2017, 2019a).
Chlorophyll fluorescence is re-emitted energy produced during the photosynthetic light reactions, in which a small fraction (roughly 2 %) of photosynthetic active radiation (PAR) absorbed by chlorophyll is re-emitted at longer wave-lengths (650–850 nm) as fluorescence. In ambient condi-tions, the emission of SIF represents a byproduct of two pri-mary de-excitation pathways, photochemical (PQ) and non-photochemical (NPQ) quenching. Plants have evolved these regulatory mechanisms to prevent damage to photosynthetic machinery when the amount of absorbed radiation is greater than that which can be used to drive photochemistry. Chloro-phyll fluorescence responds dynamically to changes in pho-tochemistry and NPQ from instantaneous to hourly, daily, and seasonal timescales, as a function of changing environ-mental conditions and plant structural properties (Porcar-Castell et al., 2014; Demmig-Adams et al., 2012). SIF is fundamentally different than steady-state fluorescence yield typically measured at the leaf scale, as it is sensitive to both changes in photochemistry as well as absorbed PAR (APAR; related to incident light, canopy structure, and biochemical content). The response of canopy SIF to APAR is well
doc-umented in deciduous and evergreen forests and cropping ecosystems (Yang et al., 2018; Badgley et al., 2017; Miao et al., 2018; Magney et al., 2019b; Li et al., 2020). More re-cently, Magney et al. (2019b) showed that seasonal changes in canopy SIF for cold-climate evergreen systems is influ-enced by changes in needle physiology and photoprotective pigments (Magney et al., 2019b).
To properly account for these factors, process-based SIF models must represent these underlying nonlinear biophys-ical and chembiophys-ical processes. Several modeling groups have adapted TBMs to incorporate various SIF formalisms for the purpose of model evaluation, data assimilation, and im-proved model prediction (Lee et al., 2015; Koffi et al., 2015; Thum et al., 2017; Norton et al., 2019; Bacour et al., 2019; Raczka et al., 2019). With these goals in mind, TBM–SIF modeling requires two important steps: (1) a representation of SIF at the leaf scale that accounts for NPQ and pho-tochemistry and (2) the canopy radiative transfer of SIF, which enables a comparison to large field-of-view observa-tions (e.g., tower and satellites). The second step involves accounting for radiative transfer within the canopy and has typically relied on incorporating the Soil Canopy Obser-vation Photosynthesis Energy model (SCOPE; van der Tol et al., 2009, 2014), which simulates chlorophyll fluorescence as a function of biophysics, canopy structure, environmen-tal conditions, and sun-sensor geometries. This approach has been adopted by TBMs in various ways using different as-sumptions for fluorescence modeling and radiative transfer, as will be discussed in Sect. 2.
Typically, measuring chlorophyll fluorescence and com-peting pathways (PQ and NPQ) has been done at the leaf scale via pulse-amplitude modulation (PAM) fluorescence (Schreiber et al., 1986). Recently, commercially available spectrometers have made it possible to measure SIF directly in the field at the leaf and canopy scales and also enable the study of structural, environmental, and directional con-trols (Cogliati et al., 2015; Daumard et al. 2010; Migliavacca et al. 2017; Yang et al. 2015; Grossman et al., 2018; Aasen et al., 2019; Gu et al., 2019b; Zhang et al., 2019). The use of field-deployable instruments on eddy covariance towers has increased rapidly since 2014, providing coverage of multiple vegetation types across various climates around the world (Yang et al., 2018; Magney et al., 2019a,b; Parazoo et al., 2019). These data enable an improved understanding of the relationship between SIF, GPP, APAR, and environmental ef-fects at canopy scales. Novel tower-mounted spectrometer systems such as Fluospec2 (Yang et al., 2018), PhotoSpec (Grossman et al., 2018), and FloX (fluorescence box; e.g., Julitta et al., 2017; Shan et al., 2019) have made it possible to monitor canopy SIF continuously in the field with high preci-sion over multiple years, providing opportunities for a more direct comparison and evaluation of satellite data (Grossman et al., 2018; Yang et al., 2015, 2018; Wohlfahrt et al., 2018; Magney et al., 2019b). PhotoSpec offers the additional ben-efits (and challenge) of (a) a precise field of view capable of
resolving leaf-level SIF and (b) canopy scanning at azimuth and elevation angles. These features enable SIF integration from the leaf to the canopy scale and the interpretation of directional variations of the emitted radiance.
Canopy-scanning spectrometers such as PhotoSpec thus provide an opportunity to understand the physical processes that lead to a breakdown of SIF–GPP linearity at the leaf to the canopy scale (or conversely, emergence of linearity at an increasing scale) and for the detailed evaluation and diagno-sis of TBM performance. This study provides a preliminary benchmarking site-level assessment for simulations of SIF within a TBM framework and across an ensemble of TBMs, with the primary purpose being an initial investigation into the response of modeled SIF and GPP to light during peak summer. We leverage the continuous measurements of SIF and GPP at the Niwot Ridge US-NR1 AmeriFlux flux tower in Colorado from June to July 2017 (Magney et al., 2019b) and simulations of canopy radiative transfer, photosynthesis, and fluorescence from a stand-alone version of SCOPE to (1) benchmark TBM–SIF modeling, (2) evaluate the sensitiv-ity to underlying processes and scaling techniques, (3) iden-tify the strengths and weaknesses in current modeling strate-gies, and (4) recommend strategies for models and observa-tions.
The paper is organized as follows: Sect. 2 describes SCOPE and the seven TBM–SIF models (SiB3 – Simple Bio-sphere Model, SiB4, ORCHIDEE – Organizing Carbon and Hydrology In Dynamic Ecosystems, BEPS – Boreal Ecosys-tems Productivity Simulator, BETHY – Biosphere Energy Transfer Hydrology, CLM4.5 – Community Land Model, and CLM5) which have recently been published or are in re-view and provides more details on site-level benchmarking observations. Section 3 summarizes results comparing mod-eled and predicted SIF and GPP at hourly and daily scales as they relate to absorbed light, GPP and SIF yields, and quan-tum yields. Section 4 discusses results in more detail, includ-ing the attribution of SIF magnitude and temporal phasinclud-ing biases and sensitivities to absorbed light and areas for im-provement.
2 Methods
2.1 Site in Niwot Ridge, Colorado
Our study focuses on an AmeriFlux (https://ameriflux.lbl. gov/) site in Niwot Ridge, Colorado, USA (US-NR1), where a tower-based eddy covariance system has been continu-ously measuring the net ecosystem exchange of carbon diox-ide (NEE) over a high-elevation subalpine forest since 1999 and a spectrometer system has been continuously monitoring SIF since June 2017 (Grossman et al., 2018; Magney et al., 2019b). The 26 m tall tower is located in a high-elevation forest (3050 m a.s.l.) located in the Rocky Mountains of Col-orado (Burns et al., 2015; Hu et al., 2010; Monson et al.,
2002) and consists primarily of the evergreen species of lodgepole pine (Pinus contorta), Engelmann spruce (Picea engelmannii), and subalpine fir (Abies lasiocarpa). The mean annual temperature is 1.5◦C, and mean annual precipitation is 800 mm (65 % as snow). The forest is roughly 120 years old with a mean canopy height of 11.5 m and a leaf area in-dex of 4.2 m2m−2. More site-specific details can be found in Burns et al. (2015).
At Niwot Ridge, interannual variations in GPP are closely linked to winter snowfall amount, which typically melts by early June, and summer precipitation, characterized by af-ternoon convective thunderstorms triggered by upslope flow (Burns et al., 2015; Albert et al., 2017) and climatological peak precipitation around 14:00 LT (Fig. 1a). We note that our study period of July–August 2017 is unusual for NR1 (relative to the 2015–2018 mean) in its bimodal distribu-tion of diurnal precipitadistribu-tion (morning and afternoon peaks), lower-than-normal afternoon precipitation, cooler tempera-tures, and reduced vapor pressure deficit (Fig. 1a–c). The early morning peak is due to a strong storm system that moved through from 22 to 24 July (Fig. 1e) and does not show up when these days are removed. This period also shows a decrease in incoming shortwave radiation relative to climatology despite lower precipitation (Fig. 1d). We note that a second storm passed through in early August. The combination of these two storms produced net decreases in air temperature (Fig. 1f), vapor pressure deficit (Fig. 1g), and sunlight (Fig. 1h) over a 2-week period from late July to early August.
2.2 Tower-based measurements: PAR, SIF, and CO2
flux
2.2.1 Absorbed PAR
The site is equipped with two main upward-facing PAR sen-sors. The first (LI-COR LI-190R), mounted on the Photo-Spec telescope unit, provides an independent measurement of direct and diffuse light and can be used to calibrate Pho-toSpec (Grossman et al., 2018). The second (Apogee Instru-ments SQ-500-SS), mounted on the main flux tower, is part of a larger array of upward- and downward-oriented PAR sensors above and below the canopy used for the calculation of the fraction of PAR absorbed by the vegetation canopy (fAPAR). The two PAR sensors show a similar diurnal pat-tern during July–August 2017 (Fig. S1 in the Supplement), including an afternoon dip and relatively smaller values over-all compared to 2018 (the only other year with available PAR for comparison).
Full-spectrum quantum sensors (Apogee Instruments SQ-500-SS) were new and factory-calibrated together just be-fore installation. Above-canopy sensors (one upward- and one downward-facing) were mounted on the main flux tower, and below-canopy sensors (six upward- and six downward-facing) were mounted at the 2 m height above ground on
Figure 1. Observed diurnal (a–d) and synoptic (e–h) precipitation (PPT), air temperature at 21 m (Tair), vapor pressure deficit (VPD), and
downwelling shortwave (SWdown) radiation. Diurnal cycles are averaged over July–August 2017. Synoptic cycles are plotted as 5 d averages
from 15 June to 15 September. Data from 2017 are shown in black, and climatology (2015–2018) is shown in grey. Typically, peak rainfall occurs in the afternoon at this site (a). A substantial rain event which occurred from DOY (day of year) 203 to 205 is removed from the 2017 average to show the impact on diurnal variability and to demonstrate the dominance of the afternoon monsoon upon diurnal precipitation in summer.
shorter canopy-access towers. APAR was calculated for each pair of below-canopy sensors relative to above-canopy sen-sors for every half hour, then averaged among sensen-sors over daylight hours to create a daytime average. We then estimate hourly APAR by multiplying hourly incoming PAR (mea-sured and integrated from 400 to 700 nm) at the top of the canopy (PAR) by the daytime average of fAPAR. Figure S2 in the Supplement shows the mean diurnal cycle for July– August 2017 for each sensor and the across-sensor average, with APAR data collection beginning on 13 July 2017. We note that APAR measurements are only as representative as the distribution of PAR sensors beneath the canopy; while they are placed within the footprint of SIF (Sect. 2.2.3) and fetch of eddy covariance (Sect. 2.2.4) measurements, they
cannot be a perfect representation of canopy APAR for each eddy covariance and SIF measurement.
2.2.2 Fluorescence parameters
We define and clarify three important quantities that de-fine the relationship between absorbed light and emitted SIF at the leaf and canopy scales. φF is the quantum yield of
fluorescence, representing the probability that an absorbed photon will be fluoresced. This quantity can be observed at the leaf level using PAM fluorimetry or calculated by models as a function of rate coefficients for energy trans-fer (Sect. 2.3.3). SIFyieldis the canopy-emitted SIF per
pho-ton absorbed. The quantity is estimated from models and observations as the ratio of absolute canopy SIF to APAR (SIFcanopy/ APAR). SIFyieldis our best attempt to account for
the effects of (a) canopy-absorbed light and (b) SIF reabsorp-tion within the canopy on the canopy-integrated emission of SIF. However, factors such as observation angle, the fraction of sunlit and shaded canopy components, and the difference in footprint from APAR necessitate an additional diagnos-tic variable defined as relative SIF (SIFrel). SIFrelis emitted
SIF per reflected radiance in the far-red spectrum where SIF retrievals occur (SIF/Reffr). This is useful because it
normal-izes for the exact amount of “illuminated” canopy compo-nents within the sensor field of view, whereas APAR mea-surements are integrated for the entire canopy.
These quantities represent different but equally important versions of reality. It is difficult for models to exactly repro-duce the distribution and timing of sunlight in the canopy as observed by PhotoSpec. While SIFrel removes
model-observation differences in illumination, it confounds our in-terpretation of the relationship with GPPyield, which is
de-rived from APAR. As such, we provide both results to be comprehensive but note the temporal stability associated with SIFrel as the more physical interpretation of canopy
yield for this short period of study.
2.2.3 Tower-based measurements of solar-induced chlorophyll fluorescence (SIF)
SIF data have been collected from a scanning spectrom-eter (PhotoSpec) installed at the AmeriFlux US-NR1 tall tower since 17 June 2017. PhotoSpec sits atop the tower at 26 m above the ground and roughly 15 m above the forest canopy top, transferring reflected sunlight and SIF data col-lected from the needleleaf canopy through a trifurcated op-tical cable to three spectrometers in a shed at the base of the tower. These spectrometers measure far-red fluorescence in the 745–758 nm retrieval window at high spectral resolu-tion (full width at half maximum of 0.3 nm) and with a 0.7◦ field of view (FOV), resulting in a 20 cm diameter footprint at the nadir on top of the canopy. The far-red SIF data are then scaled to 740 nm for model intercomparison using the first principal component of the spectral shape in Magney et al. (2019a). PhotoSpec scans from the nadir to the hori-zon in 0.7◦steps at two azimuth directions, with a time res-olution of ∼ 20 s per measurement and complete scan time of 20 min. For this study, we aggregate scans across all az-imuth and elevation angles into hourly canopy-level averages to benchmark model estimates of top-of-canopy (TOC) or canopy-averaged SIF (BETHY only; see Sect. 2.3.4) at diur-nal and synoptic timescales. We refer the reader to Grossman et al. (2018) and Magney et al. (2019b) for further details re-garding PhotoSpec, the implementation at US-NR1, and data filtering and to Magney et al. (2019c) regarding data access. We focus our model data analysis on the 2017 growing sea-son (July–August 2017) to maximize the overlap between observations of SIF, GPP, and APAR.
Diurnal composites of PhotoSpec SIF in 2017 show a late-morning peak and afternoon dip (Fig. S3A in the
Supple-ment). The afternoon dip is consistent with decreased incom-ing shortwave radiation, PAR and APAR (Figs. S1 and S2, re-spectively). However, we note the retrieved signal from Pho-toSpec is also affected by (1) viewing geometry, (2) fraction of sunlit vs. shaded leaves (sunlit and shaded fraction, i.e., the quantity of needles illuminated by incident sunlight) due to self-shading within the canopy, and (3) direct and diffuse fraction due to cloud cover. Structural and bidirectional ef-fects lead to different SIF emission patterns depending on view angles and scanning patterns (Yang and van der Tol, 2018). The viewing geometry of PhotoSpec (as implemented at NR1 in 2017) causes a higher fraction of illuminated veg-etation in the morning, which leads to a 2 to 3 h offset in the timing of peak SIF (Fig. S3a) and incoming far-red reflected radiance within the retrieval window (Fig. S3b), from the peak zenith angle of the sun at noon (coinciding with the ex-pected peak in PAR) to late morning. Normalizing SIF by far-red reflected radiance as relative SIF (SIFrel; Fig. S3c) and
rescaling to SIF (Fig. S3d) shifts the peak back to noon and preserved the afternoon dip (albeit with reduced magnitude). SIFrelhelps to account for factors 1–3 listed above because it
accounts for the amount of reflected radiation in the field of view of PhotoSpec, which is impacted by canopy structure, sun angle, and direct and diffuse light. As discussed above, SIFrel is likely a better approximation of SIFyieldbecause it
normalizes for the exact amount of illuminated canopy com-ponents in each retrieval, whereas APAR integrates the entire canopy. As such, we expect SIFrelto have a strong seasonal
change associated with the downregulation of photosynthesis and a more subtle diurnal change, as during midsummer the SIF signal is primarily driven by light intensity.
It is important to note that the PhotoSpec system is highly sensitive to the sunlit and shaded fraction in the canopy (fac-tor 2) due to the narrow FOV of the PhotoSpec telescoping lens. Increased afternoon cloud cover during summer causes diurnal asymmetry in incident PAR (Fig. S1a). We exam-ine this effect in more detail (Sect. 3) by analyzing SIF and GPP under clear and diffuse sky conditions using a threshold (0.5; top-of-canopy and top-of-atmosphere incoming short-wave radiation) similar to that used in Yang et al. (2017, 2018).
2.2.4 CO2flux and GPP partitioning
NEE measurements are screened using ustar filtering, and
partitioned into gross primary production (GPP) and terres-trial ecosystem respiration components using the so-called nighttime method which is based on the relationship between NEE during the nighttime (PAR < 50 µmol m−2s−1) and air temperature (Reichstein et al., 2005). Diurnal averages of GPP based on nighttime partitioning show similar diurnal structure to PAR and SIF including the afternoon dip and re-duced overall magnitude compared to the 2015–2018 mean (Fig. S4 in the Supplement). Similar results are found us-ing daytime light partitionus-ing of NEE (Lasslop et al., 2010;
Fig. S4), and thus only nighttime-partitioned GPP data are re-ported for the remainder of this study. All GPP estimates are processed as half-hourly means and are then gap-filled and averaged hourly. We note the tower location near the Conti-nental Divide in the Rocky Mountains of Colorado presents slope flow challenges for eddy covariance during nighttime, but the relatively flat area of the tower reduces impact on day-time flux measurements (Burns et al., 2018). Details on the flux measurements, data processing, and quality control are provided in Burns et al. (2015).
2.3 Modeling approach 2.3.1 TBM–SIF overview
The parent TBMs are designed to simulate the exchanges of carbon, water, and energy between the biosphere and atmo-sphere, from global to local scales depending on inputs from meteorological forcing, soil texture, and plant functional type. The addition of a fluorescence model that simulates SIF enables a direct comparison to remotely sensed observa-tions for benchmarking, process diagnostics, and parameter and state optimization (data fusion) for improved GPP esti-mation. The TBM–SIF models analyzed here differ in ways too numerous to discuss. We refer the reader to the appro-priate references in Sect. 2.3.4 for more detailed model de-scriptions. Instead, we focus on key differences affecting the joint simulation of GPP and leaf- and canopy-level SIF at di-urnal and synoptic scales, during the peak of summer. These differences, which are summarized in Table 1, include the representation of stomatal conductance (all use Ball–Berry– Woodrow except CLM5.0, BEPS, and ORCHIDEE), canopy absorption of incoming radiation (all account for sunlit and shaded radiation except ORCHIDEE, SiB3, and SiB4), lim-iting factors for photosynthesis (Vcmax – maximum rate of
Rubisco carboxylase activity, LAI – leaf area index, radia-tion, and stress) and SIF (kN – rate coefficient for
nonpho-tochemical quenching – and fluorescence photon reabsorp-tion), scaling and radiative transfer methods for transferring leaf-level SIF simulations to the top of the canopy, and pa-rameter optimization. Further details on (a) photosynthetic structural formulation and parameter choice, (b) the repre-sentation of leaf-level processes important to SIF (kN and
φP), and (c) the leaf-to-canopy-scaling approach (SIFcanopy)
are provided in Sect. 2.3.2 and 2.3.3. 2.3.2 Photosynthesis models
All TBM–SIF models in this paper used enzyme kinetic models to simulate leaf assimilation rate (gross photosynthe-sis) as limited by the efficiency of the photosynthetic enzyme system, the amount of PAR captured by leaf chlorophyll, and the capacity of leaves to utilize end products of photosynthe-sis (Farquhar et al., 1980; Collatz et al., 1991, 1992; Sellers et al., 1996). However, there are important differences in the
representation of (a) stomatal conductance that couples car-bon and water cycles and (b) limiting factors on carcar-bon as-similation due to leaf physiology (maximum carboxylation capacity, Vcmax), radiation (APAR or fAPAR), canopy
struc-ture (LAI and leaf angle distribution), and stress (water sup-ply and demand and temperature) that affect plant physiolog-ical processes and canopy radiative transfer. The underlying stomatal-conductance models in the TBMs analyzed here are represented by the Ball–Berry–Woodrow family of empiri-cal models rooted in the leaf–gas exchange equation but with different representations of atmospheric demand (relative hu-midity or vapor pressure deficit), including the Ball–Berry– Woodrow model (Ball et al., 1987), the Leuning model (Le-uning, 1995), the Yin–Stuik model (Yin and Struik, 2009), and the Medlyn model (Medlyn et al., 2011). These struc-tural and parametric differences also influence calculated val-ues such as the degree of light saturation (Sect. 2.3.3), which influence both the fluorescence and quantum yield as used by the fluorescence models. Differences in stomatal conduc-tance, canopy type and radiation scheme, stress, Vcmax, and
LAI are summarized in Table 1.
2.3.3 Fluorescence-modeling approach
Following the general approach described in Lee et al. (2015) and van der Tol et al. (2014), the flux of total leaf-level emit-ted fluorescence, SIFleaf, can be diagnosed using a light use
efficiency framework analogous to the expression for photo-synthesis (Monteith, 1972),
SIFleaf=fAPAR · PAR · φF
=APAR · φF, (1)
where PAR and fAPAR are defined in Sect. 2.2.1 but mea-sured at the leaf level and φF is the quantum yield of
flu-orescence, representing the number of photons emitted by fluorescence per absorbed photon. We note that photosys-tems I and II (PS1 and PSII, respectively) contribute to leaf-level fluorescence, but only PSII is considered in models an-alyzed here (with the exception of ORCHIDEE and BETHY, Sect. 2.3.4.2). φFis estimated as follows:
φF=
kF
kF+kD+kN
(1 − φP) , (2)
where k represents the rate coefficients for the different path-ways for the transfer of energy from excited chlorophyll (kF is fluorescence, kD is heat dissipation, and kN is
non-photochemical quenching – NPQ) and φP is the quantum
yield of electron transport (see Sect. 2.3.2). kF is typically
set to a constant value (0.05) in models following van der Tol et al. (2014). kD is also typically set to a constant value
of 0.95 or temperature corrected in some cases (e.g., OR-CHIDEE, CLM4.5, CLM5.0, and BETHY). kN has a
sub-stantial and variable impact on energy partitioning at diurnal and seasonal scales which varies as a function of light satu-ration (e.g., Raczka et al., 2019; Porcar-Castell, 2011). Once
T able 1. Summary of TBM–SIF m odels and within-model experiments illustrating model components that may ha v e led to dif ferences in modeled SIF . These include a representation of stomatal conductance (column 3), canop y absorption of incoming radiation (col umn 4), limiting factors for photosynthesis (stress, Vcmax , and LAI; columns 5–7) and SIF (kN ; column 8), leaf-to-canop y scaling of SIF (column 9), and parameter optimization (column 10). The underlined model experiment w as used for model intercomparison. OCO-2: Orbiting Carbon Observ atory 2. SZA: solar zenith angle. MODIS: Moderate Resolution Imaging Spectroradiometer . NIR V : near -infrared reflectance of v egetation. ENF: boreal needleleaf ev er green. PFT : plant functional type. fP AR: fraction of photosynthetically acti v e radiation. SAIL: Scattering by Arbitrary Incl ined Lea v es. Model (citation) Model experiments Stomatal conductance Canop y type and radiation Stress Vcmax LAI kN Leaf-to-canop y scaling P arameter optimization SCOPE v1.73 (v an der T ol, 2014) SCOPE-e xp1 Ball–Berry– Woodro w Multilayer Sunlit and shaded = yes fP AR and AP AR = semi-analytical canop y radiati v e model (based on SAIL) T a stress Prescribed (30) Prescribed (4.0 m 2m − 2) Adapted to drought-stressed Mediterranean species including high-temperature correction (T ol et al., 2014; Fle xas et al., 2002) 60-layer one-dimensional radiati v e transfer Hand-tuned to NR1 (Raczka et al., 2016) SCOPE-e xp2 Seasonally cali-brated to NR1 BETHY (Norton et al., 2019) BETHY -e xp1 Ball–Berry– Woodro w Same as SCOPE T a stress Prior is a func-tion of T a Prescribed (4.0 m 2m − 2) Adapted to unstressed cotton species (T ol et al., 2014) SCOPE radiati v e transfer; f(T a, AP AR, struc-ture, leaf composition) via dependence of pho-tosynthetic rate on ϕF Def ault Adapted to drought-stressed Mediterranean species including high-temperature correction (T ol et al., 2014; Fle xas et al., 2002) BETHY -e xp2 BETHY -e xp3 Adapted to drought-stressed Mediterranean species (Fle xas et al., 2002) ORCHIDEE (Bacour et al., 2019) ORCHIDEE-e xp1 Y in–Struik Big leaf Sunlit and shaded = no AP AR = Beer –Lambert la w de-pending on LAI and extinction factor of 0.5 T a stress f(leaf age, CO 2 , T a, w ater stress) Prognostic Adapted to needleleaf species (Porcar -Castell, 2011) and unstressed Mediter -ranean species (Fle xas, 2002), with added dependence on P AR, temperature, and ϕP P arametric repre sentation of SCOP E (v1.61) to emulate radiati v e transfer within the canop y for PSI and PSII Def ault ORCHIDEE-e xp2 T a and w ater stress (Y in and Struik, 2009) Def ault ORCHIDEE-e xp3 Same as ORCHIDEE-e xp1 Global ENF PFT opti-mized ag ainst OCO-2 BEPS (Qiu et al., 2019) BEPS-e xp1 Leuning T w o leaf Sunlit and shaded = yes fP AR = semi-analytical canop y radiati v e transfer Soil w ater stress factor (ratio of measured soil av ailable w ater to maximum plant av ailable w a-ter) Prescribed Prescribed (4.0 m 2m − 2) Adapted to w ater -stressed Mediterranean species (Galmes et al., 2007) P arametric representation of radiati v e transfer ph ysics to account for canop y scattering ef fects Def ault BEPS-e xp2 Adapted to drought-stressed Mediterranean species including high-temperature correction (T ol et al., 2014; Fle xas et al., 2002) CLM4.5 (Raczka et al., 2019) CLM4.5-e xp1 Ball–Berry– Woodro w T w o big leaf Sunlit and shaded = yes T a (Vcmax ); soil moisture stress is a function of column rooting profile and soil w ater potential Prescribed (cal-ibrated ag ainst observ ed GPP at NR1) Prescribed (4.0 m 2m − 2) Adapted to w ater -stressed Mediterranean species (Galmes et al., 2007) ? κ740 = f( Vcmax , SZA) calibrated to of fline SCOPE runs using pres cribed canop y charac-teristics at NR1 Hand-tuned to NR1 (Raczka et al., 2016) CLM4.5-e xp2 Adapted to needleleaf species (Porcar -Castel l, 2011); accounts for sustained NPQ (kS ) separately from re v ersible NPQ (kR ); kS is calibrated to NR1 Tair ; kR is fix ed in time CLM4.5-e xp3 Same as CLM4.5-e xp2, b ut kR is seasonal CLM5.0 (unpublished) CLM5.0-e xp1 Medlyn T w o big leaf Sunlit and shaded = yes Plant h ydraulic w ater stress (Sperry and Lo v e, 2015; La wrence et al., 2019) ac-counting for w ater demand and supply f(soil moisture, nitrogen) cali-brated to NR1 Prescribed (4.0 m 2m − 2) Adapted to w ater -stressed Mediterranean species (Galmes et al., 2007) κ740 = f( Vcmax ), calibrated to of fline SCOPE runs from Lee et al. (2015) Def ault CLM5.0-e xp2 κ740 = f( Vcmax , SZA) calibrated to of fline SCOPE runs with prescribed canop y character -istics at NR1 CLM5.0-e xp3 Escape ratio (fesc ) deri v ed from NIR V and fP AR (Zeng et al., 2019) SiB3 (Bak er et al., 2003, 2008) SiB4 (Haynes et al., 2019a,b) SiB3-e xp1 Ball–Berry– Woodro w Big leaf Sunlit and shaded = no Do wnre gulation by VPD, T a, and soil moisture f(soil moisture) Prescribed (MODIS) Adapted to drought-stressed species (T ol et al., 2014) κ740 = f( Vcmax ) calibrated to of fline SCOPE runs from Lee et al. (2015) Def ault Prescribed (4.0 m 2m − 2) SiB3-e xp2 Prognostic SiB4
leaf-level emissions are known, an approach is needed to es-timate the total TOC fluorescence flux (SIFcanopy) for
com-parison to PhotoSpec data. Fluorescence modeling at the leaf and canopy levels is described in more detail in Sect. 2.3.3.1 and 2.3.3.2 below.
Leaf-level SIF emission
The “quantum-yield” approach has been used in SIF models to characterize the fraction of photons that are used for PQ, NPQ, or re-emitted as fluorescence (van der Tol, 2014). It is important to note that this does not translate into the actual amount of SIF emission leaving the leaf but is used as an ap-proximation. TBM–SIF models typically represent φP using
lake model formalism, which assumes large connectivity be-tween photosynthetic units (Genty et al., 1989; van der Tol et al., 2014). φP is expressed in terms of the degree of light
saturation (x), derived from the native photosynthesis mod-ule of the parent TBM and represents the balance between actual and potential electron transport rates and the maxi-mum photochemical yield under dark-acclimated conditions (φPmax), which is derived from the fluorescence model and
defined in terms of rate coefficients in Eq. (2).
φN accounts for the ability of plants to dissipate excess
energy as heat via NPQ through the regulation of xantho-phyll cycle pigments (Demmig-Adams and Adams, 2006). NPQ can be represented as a sum of reversible (kR) and
sus-tain (kS) components (kN=kR+kS). kRaccounts for the
rel-atively fast (diurnal), reversible NPQ response to light. kS
accounts for the relatively slow (seasonal), sustained NPQ response to light and other environmental factors. With the exception of CLM4.5, models do not typically account for kS.
A significant challenge in fluorescence models is to find an appropriate relationship between kN and the degree of light
saturation (x). The TBM–SIF models represent kN through
an approach similar to the one used in SCOPE, which uses a parametric model of kN derived from PAM fluorometry
measurements (van der Tol et al., 2014).
NPQ models can be classified as stressed (drought) and unstressed relative to water availability depending on the dataset from which empirical fits are derived. The unstressed model is ideal for irrigated systems such as crops, and the stressed model is more appropriate for water-limited ecosys-tems such as Niwot Ridge. We examine each of these models using drought and unstressed models from van der Tol (2014) and a drought-based model from Flexas et al. (2002). These models use different empirical fits but are otherwise identi-cal. In general, kNincreases more rapidly with APAR (light
saturation) and ramps up to a higher level, in the drought-based model compared to the unstressed model. Addition-ally, some models provide unique improvements such as de-pendence on environmental conditions (e.g., water stress vs. no water stress in ORCHIDEE), and equations for reversible and sustained NPQ to represent the different timescales
(min-utes to seasonal) at which NPQ regulation occurs (e.g., CLM4.5), influenced by pigmentation changes in the leaf. Leaf-to-canopy scaling
The TBM–SIF models produce leaf-level fluorescence which needs to be converted to canopy-level fluorescence (SIFcanopy) to be directly compared to PhotoSpec and
satel-lite observations. Leaf-to-canopy-level conversion of SIF re-quires a representation of canopy radiative transfer, which in general is too computationally expensive to include within the TBMs in this study, that are designed for global-scale application. Therefore, most TBMs analyzed here account for canopy radiative transfer of SIF using some representa-tion of SCOPE (van der Tol, 2009a, b). The most commonly used approach is to run independent simulations of SIF from SCOPE to create an empirical conversion factor (κ740)
be-tween the leaf- and canopy-level SIF that is a function of Vcmax(Lee et al., 2015). This conversion factor accounts for
the integration over the fluorescence emission spectrum, ob-servation angle, and unit conversion. Model variations of this empirical approach, as well additional approaches utilizing the full SCOPE model and a SCOPE emulator, are summa-rized below and in Table 1.
2.3.4 TBM–SIF models
Here we provide a brief description of individual TBM–SIF models and within-model experiments. We point out key dif-ferences in the modeling of photosynthesis, fluorescence, and leaf-to-canopy scaling. We note that within-model experi-ments, labeled as experiment 1 (exp1), experiment 2 (exp2), etc., represent an increasing order of realism rather than a specific set of conditions common across models. As such, experiment 1 in BETHY (BETHY-exp1) is not equivalent to experiment 1 in CLM4.5 (CLM4.5-exp1).
BETHY
The Biosphere Energy Transfer Hydrology (BETHY) model is the land surface component of the Carbon Cycle Data As-similation System (CCDAS) developed to ingest a range of observational data for estimating terrestrial carbon fluxes at a global scale (Rayner et al., 2005; Kaminski et al., 2013; Koffi et al., 2012; Anav et al., 2015). Koffi et al. (2015) was the first to combine a process-based model of SIF with a global TBM. The native canopy radiative transfer and photosynthe-sis schemes of BETHY were effectively replaced with cor-responding schemes and a fluorescence model from SCOPE (Koffi et al., 2015), thus enabling the spatially explicit simu-lation of GPP and SIF as a function of plant function type. This model was extended to include a module for prog-nostic leaf growth (Norton et al., 2018) and more recently adapted with a formal optimization algorithm for assimilat-ing spaceborne SIF data (Norton et al., 2019). It has been updated for this study to accept hourly meteorological
forc-ing. BETHY-SCOPE, denoted here as BETHY, remains the first and only global TBM–SIF model to simulate vertically integrated (one-dimensional) fluorescence radiative transfer and energy balance.
We include three experiments to examine the impact of calibrating the kN model against PAM fluorometry data to
different species: (1) BETHY-exp1 is adapted to unstressed cotton species (van der Tol et al., 2014); (2) BETHY-exp2 is adapted to drought-stressed Mediterranean species (i.e., vineyard in a controlled environment subjected to drought) including higher temperature correction (Flexas et al., 2002; van der Tol et al., 2014); and (3) BETHY-exp3 is adapted to drought-stressed Mediterranean species (Flexas et al., 2002). We further leverage SCOPE-enabled SIF modeling in BETHY (BETHY-exp3 specifically) to examine (a) leaf- and canopy-level SIF and quenching under sunlit and shaded leaves and (b) SIF emissions at the top of the canopy (SIFcanopy) vs. the average emission within the canopy
(SIFave), which accounts for the average emission from sunlit
and shaded leaves. The latter analysis facilitates the compar-ison to PhotoSpec, which observes the entire canopy.
An important caveat in the analysis of BETHY simulations is that, at the time of this writing, the prescribed meteorolog-ical forcing at NR1 is only available for 2015. While this de-grades comparison to diurnal and synoptic variation observed by PhotoSpec in 2017, we find that the analysis of magni-tude, light sensitivities, and within-model experiments still provides useful insight for the interpretation of other TBM– SIF models and future modeling requirements in general. ORCHIDEE
The Organizing Carbon and Hydrology In Dynamic Ecosys-tems (ORCHIDEE) model (Krinner et al., 2005) is the land surface component of the earth system model of the Institut Pierre-Simon Laplace IPSL-CM (climate model; Dufresne et al., 2013) involved in recent exercises of the Coupled Model Intercomparison Project (CMIP) established by the World Climate Research Programme (https://www. wcrp-climate.org/wgcm-cmip, last access: 6 January 2019). Recently a mechanistic SIF observation operator was devel-oped for ORCHIDEE to simulate the regulation of photo-system II φFat the leaf level using a novel parameterization
of NPQ as a function of temperature, PAR, and normalized φP. It emulates the radiative transfer of SIF to the top of the
canopy using a parametric simplification of SCOPE. The de-tails of the SIF modeling approach are provided in Bacour et al. (2019).
We include three experiments to examine the impact of water stress and parameter optimization (using OCO-2 SIF; see Sect. 2.4): (1) ORCHIDEE-exp1 is the standard config-uration with default parameters; (2) ORCHIDEE-exp2 is the same as ORCHIDEE-exp1 with the two key differences that (a) water stress is applied to the stomatal conductance, mes-ophyll conductance, and photosynthetic capacity and (b) the
tree height (12 m instead of 15 m) was set specifically for the NR1 site; and (3) ORCHIDEE-exp3 is the same as ORCHIDEE-exp1 but includes OCO-2 optimized parame-ters.
BEPS
The Boreal Ecosystem Product Simulator (BEPS) is an en-zyme kinetic two-leaf model for simulating carbon and water cycles for different plant functional types (Chen et al., 1999; Liu et al., 2003). BEPS uses a modified Ball–Berry–Woodrow stomatal-conductance model (Leun-ing et al., 1995) and semi-analytical canopy radiative trans-fer. The canopy architecture is well considered in the BEPS model, which has not only remote-sensed LAI but also the global map of the foliage clumping index. The fluo-rescence emission at the leaf level follows the approach of Lee et al. (2015). SIF emission for sunlit and shaded leaves are separately simulated based on illumination and canopy geometry in BEPS. In addition, multiple scattering SIF is also simulated to account for the scattering process within the canopy. The scaling of leaf-level fluorescence emission to the canopy is based on a novel scheme for single-layer models which accounts for canopy scattering and extinction from sunlit and shaded leaves (Qiu et al., 2019). This scal-ing scheme is an effective approach to simulate the radiative transfer of SIF for a given canopy structure. We include two experiments similar to BETHY-exp1 and BETHY-exp2 in the calibration of the kN model against unstressed vs. stressed
species (BEPS-exp1 and BEPS-exp2, respectively). CLM4.5
The Community Land Model version 4.5 (CLM4.5) provides a description of the biogeochemical profile spanning from the subsurface bedrock to the top of the vegetation canopy. The fluorescence submodel follows Raczka et al. (2019), in which the degree of light saturation is calculated from the po-tential and actual electron transport rate as determined from the photosynthesis model described above. φFis formulated
as described in Eq. (2), and φPis formulated as a function of
the maximum φP under dark acclimated conditions and the
degree of light saturation. CLM4.5 uses independent site-level SCOPE simulations that match the observed canopy characteristics and observed GPP at Niwot Ridge to calculate a leaf-to-canopy-level conversion factor (κ740) for estimating
SIFcanopy. In CLM4.5, κ740is fitted to the modeled SCOPE
data as a function of the solar zenith angle (and implicitly Vcmax).
Similar to Raczka et al. (2019), here we examine three separate approaches to parameterize kN. CLM4.5-exp1 only
considers reversible NPQ (kR), such that kN=kR, and the
relationship between kR and the degree of light saturation
is fitted to PAM fluorometry data based on Mediterranean shrubs (Flexas et al., 2002; Galmes et al., 2007).
CLM4.5-exp2 parameterizes kRwith PAM fluorometry from a Scots
pine forest (Porcar-Castell, 2011) and defines the rate co-efficient in terms of both a reversible and sustained com-ponent (kN=kR+kS). It has been found that sustained
NPQ is important for cold-climate evergreen conifer forests such as Niwot Ridge (Miguez et al., 2015; Magney et al., 2019b), and Raczka et al. (2019) found that representing both components provided improved simulations of seasonal SIF. CLM4.5-exp3 is similar to CLM4.5-exp3 but includes a seasonally varying representation of kR. All model
ex-periments use hand-tuned parameters specific to US-NR1 (Raczka et al., 2016).
CLM5.0
CLM version 5.0 (CLM5.0) is similar to CLM4.5 with re-spect to the implementation of the fluorescence submodel yet includes several important updates to the representation of photosynthesis from CLM4.5, including a prognostic calcu-lation of Vcmaxbased upon leaf nitrogen and environmental
conditions, a revised nitrogen limitation scheme, the Med-lyn stomatal-conductance model, and plant hydraulic water stress (Kennedy et al., 2019). To represent NPQ, we use a single approach for kN (see CLM4.5-exp1) but examine
three approaches for estimating κ740: (1) CLM5.0-exp1 uses
κ740 as a function of Vcmax following Lee et al. (2015);
(2) CLM5.0-exp2 follows the approach of CLM4.5; and (3) CLM5.0-exp3 adapts the approach proposed by Zeng et al. (2019) that estimates the fraction of total emitted SIF escaping the canopy by combining the near-infrared re-flectance of vegetation (NIRV) and fPAR.
SiB3
The Simple Biosphere Model version 3 (SiB3) involves the use of explicit biophysical mechanisms to directly calculate carbon assimilation by photosynthesis (Baker et al., 2003; 2008). SiB3 includes the prognostic calculation of tempera-ture, moistempera-ture, and trace gases in the canopy air space but requires the prescription of most structural properties in-cluding LAI. We examine two approaches for prescribing LAI: (1) SiB3-exp1 using values prescribed from MODIS and (2) SiB3-exp2 uses values observed at the study site (4.0 m2m−2). In general, the fluorescence submodel follows the approach of Lee et al. (2015), except that kNis adapted to
drought-stressed species following van der Tol et al. (2014). SiB4
SiB4 (Haynes et al., 2019a, b) shares many similarities with SiB3 with respect to the functional aspects of photosynthesis and fluorescence; however, SiB4 uses prognostic rather than prescribed phenology and LAI.
2.3.5 SCOPE
SCOPE is a multilayer canopy model which explicitly rep-resents the within-canopy radiative transfer of fluorescence, whereas TBM–SIF models analyzed here (with the excep-tion of BETHY) only provide an empirical representaexcep-tion. We provide results from a stand-alone version of SCOPE, v1.73 (van der Tol et al., 2014), as an additional benchmark for TBM–SIF simulations of APAR, GPP, SIF, and quan-tum yields. There are three important reasons for this. (1) It is inherently difficult to provide representative and accurate in situ measurements of APAR, SIF, and GPP for compar-ison to models. (2) SCOPE provides estimates of quantum yields for fluorescence, photochemistry, and nonphotochem-ical quenching, which are not measured continuously in the canopy at NR1. (3) SCOPE offers a more direct benchmark for evaluating more simplified representations of canopy ra-diative transfer in TBM–SIF models. Unlike the TBM–SIF models, SCOPE does not include a representation of biogeo-chemical cycling or carbon pools, and thus no spin up is re-quired. As such, we prescribe LAI (4 m2m−2), canopy height (13 m), and leaf chlorophyll content (25 µg cm−2) following Raczka et al. (2019). We also examine two approaches for prescribing Vcmax: (1) SCOPE-exp1 uses the default
con-stant value of 30, similar to BETHY, and (2) SCOPE-exp2 uses a seasonal varying value calibrated to NR1, following Raczka et al. (2016, 2019), which follows a bimodal distri-bution peaking near 45 in early summer (DOY = 150) and 40 in late summer (DOY = 250).
2.4 Data assimilation
Details of the data assimilation protocols for ORCHIDEE are provided in Bacour et al. (2019). An ensemble of parame-ters related to photosynthesis (including optimal Vcmax) and
phenology were optimized for several plant functional types. Note that none of the assimilated pixels encompass the lo-cation of the US-NR1 tower. In ORCHIDEE, the study site is treated as boreal needleleaf evergreen (ENF); as such, the ORCHIDEE-exp3 simulations in this study are based on pa-rameters optimized against OCO-2 SIF data using an ensem-ble of worldwide ENF pixels. Note that for BETHY, each ex-periment uses the same set of optimized parameters, whereas in ORCHIDEE the SIF simulations are performed sepa-rately for the standard parameters (ORCHIDEE-exp1 and ORCHIDEE-exp2) and optimized parameters (ORCHIDEE-exp3), thus providing a test of sensitivity to parameter opti-mization as discussed below.
2.5 Illumination conditions
In order to gain insight into how SIF emissions and quan-tum yields vary with illumination, we further analyze Pho-toSpec and a subset of models with respect to (a) changes in incoming light and (b) self-shading within the canopy,
re-spectively. For PhotoSpec, we analyze changes in canopy-average SIF and SIFrelunder conditions of predominantly
di-rect vs. diffuse PAR, using a 0.5 threshold to distinguish be-tween the two conditions (Sect. 2.2.3). For models, we focus on emissions from sunlit vs. shaded leaves. We analyze leaf-vs. canopy-level SIF emissions (SIFleaf and SIFcanopy) in
CLM4.5-exp3 and leaf-level quantum yields (φF, φP, and φN)
in SCOPE-exp2. We further compare predictions of quantum yield at the top of the canopy to canopy averages in SCOPE-exp2. The motivation here is that top-of-canopy leaves see most of the sunlight and thus should have different yields compared to shade-adapted leaves lower in the canopy. This also provides a more direct comparison for PhotoSpec.
2.6 Modeling protocol
Models are run for the period 2000–2018 (except BETHY, which is for 2015 only, and SCOPE, which is for 2017 only) using identical, hourly, gap-filled meteorological ob-servations. The primary hourly output fields analyzed are the top-of-canopy SIF (SIFcanopy at 740 nm), GPP, φF, φP,
and APAR. Model-observation comparisons are made for absolute and relative SIF, GPP, SIFyield (SIFcanopy/ APAR)
and GPPyield (GPP / APAR), sunlit vs. shaded canopies
(CLM4.5-exp3 and SCOPE-exp2), and TOC vs. canopy-average SIF (SIFcanopyvs. SIFave, respectively, from
SCOPE-exp2). Quantum yields and within-model experiments pro-vide context to understand canopy-integrated results. We fo-cus our analysis on 08:00–16:00 LT from July to August 2017 for comparison to available PhotoSpec and APAR data. Models are controlled for meteorological forcing (mete-orological data described in Burns et al., 2015), but other factors such as spin-up, land surface characteristics, param-eter tuning, and model state are not controlled for and are treated separately according to each model’s protocol. For example, CLM4.5 is better suited than others in prescrib-ing observed vegetation characteristics at the study site. One ORCHIDEE experiment (ORCHIDEE-exp3) is preliminary optimized by assimilating independent Orbiting Carbon Ob-servatory 2 (OCO-2) SIF data at the global scale (Sect. 2.4). We emphasize that our point here is not to identify the best model but to identify common patterns in model behavior through normalized SIF and deviation from observed behav-ior to identify areas requiring the most attention.
The results are organized around two parallel themes. The first theme addresses four key processes driving canopy-level fluorescence: (1) incoming illumination; (2) energy partition-ing on incompartition-ing light between photochemistry, fluorescence, and NPQ; and (3) leaf-to-canopy-emitted SIF, including the linearity of yields at the leaf and canopy scales. The second theme addresses the sensitivity of these processes to environ-mental conditions at diurnal and synoptic scales. Here, the synoptic scale refers to the impact of day-to-day changes in weather, including two storm events which brought sustained
cool, wet, and cloudy conditions from 22 to 31 July and then from 6 to 10 August.
3 Results
Incoming illumination
Two key features dominate observed APAR variability: af-ternoon depression (Fig. 2a) and reduction during two sum-mer storms (Fig. 2d). Both features are captured by models. More generally, models capture synoptic variability with a high correlation (r > 0.8) and low across-model spread (σ = 10 %). The exception is BETHY, which is simulated outside our observation year (2015). High model fidelity is expected given that observed PAR is prescribed, and it is promising that models show a consistent response to changes in illu-mination. The primary shortcoming across TBM–SIF mod-els and SCOPE is a systematic high bias in APAR magni-tude (129 %), with most models exceeding the upper range of observed APAR (as determined from the six within-canopy PAR sensors; Fig. S2) and high model spread. These errors are likely related to differences in predicted fAPAR. In the case of ORCHIDEE, high APAR is expected due to the big-leaf assumption, where all leaves are considered as opaque and fully absorbing.
Canopy photosynthesis
Observed GPP shows a broad peak from mid morning to early afternoon (∼ 09:00 to 13:00 LT), followed by a slight decrease until 16:00 (Fig. 2b), consistent with afternoon cooling and reduced light availability (Fig. 1b–d). The 2-month period under investigation is relatively flat with gen-erally weak day-to-day variability (σ = 17 %) but a est correlation with APAR (r = 0.61; Fig. 2e). Some els capture the afternoon GPP depression, but all mod-els strongly underestimate its magnitude, apparently inde-pendent of stomatal-conductance formulation or more ex-plicit accounting for plant hydraulic water stress such as in CLM5.0. SCOPE and BETHY, which do not account for wa-ter stress, show no afwa-ternoon depression. Models are mostly uncorrelated with observed GPP at the synoptic scale (r ranges from −0.2 to 0.36; highest value in SiB4), are highly biased, and show increased spread (in predicted magnitude) relative to APAR (143 ± 23 %). SCOPE-exp2 shows a slight improvement in GPP magnitude with the larger Vcmaxvalue
in late summer.
While observed GPPyieldis mostly stable over the diurnal
cycle, most models (except BEPS) show a distinct midday minimum (Fig. 3a). Half of the models show a similar mid-day minimum in photochemical quantum yield (φP, Fig. 4a),
with the other half either increasing or decreasing in the after-noon (CLM5.0 and SiB3 and SiB4, respectively). The mid-day dip in yield is likely associated with reduced photosyn-thetic efficiency at high light levels, as demonstrated by
re-Figure 2. Observed and simulated diurnal and synoptic cycles of APAR, GPP, and SIF. Diurnal cycles (a–c) are averaged over July– August 2017. Synoptic cycles (d–f) are plotted as 5 d averages from 15 June to 15 September. Observations are shown in black, with relative SIF (SIFcanopyand far-red reflected radiance) included in panels (c) and (f) in grey. The across-model average (dashed black line) represents
the average of “best-case” model scenarios (solid lines; SCOPE-exp2, SiB3-exp2, SiB4, ORCHIDEE-exp3, CLM5.0-exp3, CLM4.5-exp3, BEPS-exp2, and BETHY-exp3) with uncertainty bars indicating the across-model 1σ uncertainty.
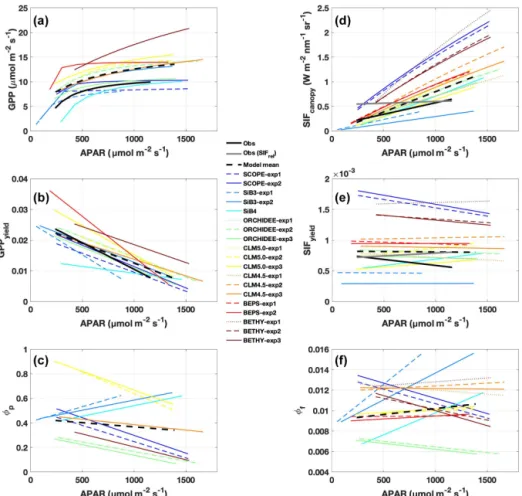
ductions in GPP, GPPyield, and φP with APAR (Fig. 5a, c,
and e).
Observed GPPyieldshows a significant structure at the
syn-optic temporal scale (Fig. 3c), most notably increased yield during the cool and rainy period (reduced heat and water stress) and decreased yield in mid-to-late August (increased heat and water stress following the cooling pattern). In con-trast to predicted GPP, models show high fidelity in captur-ing the magnitude and variability of GPPyield at the
syn-optic scale (r ranges from 0.35 to 0.76; highest values in SCOPE and CLM4.5 and CLM5.0). Individual models are self-consistent in their predictions of GPPyieldand φPat the
synoptic scale (r = 0.592–0.935), except for SiB3 and SiB4 (r < 0.1; Fig. 4b).
Canopy fluorescence
Observed SIFcanopy is strongly correlated with observed
APAR at the diurnal and synoptic scales (r = 0.77), with common features including an afternoon depression and re-duction during rainy periods (Fig. 2c and f). Observed PAR
also feeds into the fluorescence submodel and, unlike GPP, strongly correlates with SIFcanopy at the synoptic scale (r
ranges from 0.58 to 0.92; highest values in SCOPE and OR-CHIDEE). However, we find a persistent positive model bias in SIFcanopy (170 ± 45 %) consistent with, but not
propor-tional in magnitude to, the APAR bias. We note that mod-els are especially oversensitive to APAR at high light levmod-els (Fig. 5d).
We investigate the high bias in SIFcanopy in more detail
using SCOPE-exp2 and CLM4.5-exp3. Specifically, we ex-amine leaf- and canopy-level SIF and quenching under sunlit and shaded leaves. Analysis of quantum yields in SCOPE-exp2 (Fig. S5 in the Supplement) shows a reversal in the frac-tional amounts of absorbed energy going to SIF and PQ vs. NPQ in low- vs. high-light conditions that is consistent with leaf-level data and theory (Porcar-Castell et al., 2014). More specifically, SCOPE-exp2 predicts low φF and φP and high
φN in sunlit leaves relative to shaded leaves, with more
en-ergy going to fluorescence and photochemistry than to NPQ in shaded leaves and more energy going to (shed off by) NPQ
Figure 3. Same as Fig. 2 except for SIFyieldand GPPyield. Here, SIFyield=SIFcanopy/ APAR, and GPPyield=GPP / APAR. As with Fig. 2,
the left column shows the mean diurnal cycle, and the right column shows a time series of 5 d averages.
Figure 5. Observed and predicted change in GPP, SIF, and yields with APAR. Regression lines are shown for (a) GPP, (b) GPPyield, (c) photochemical quantum yield (φP), (d) SIFcanopy, (e) SIFyield, and (f) fluorescence quantum yield (φF), as a function of APAR, using daily
mean (08:00–16:00 LT) values over the period July–August 2017. Observations are shown in solid black; individual models and experiments are in color; the across-model average is a dashed black line. Relative SIF is shown in grey in panels (d) and (e).
in sunlit leaves (Fig. S5). Likewise, total φF shows
decreas-ing values with increasdecreas-ing APAR in SCOPE and BETHY-exp2 and BETHY-exp3 compared to BETHY-exp1, consis-tent with observed SIFyield(Fig. 5e and f), as φNramps up to
higher levels in the drought-parameterized kNmodel.
More-over, in stark contrast to SIFyieldand SIFcanopy, φF does not
show high values relative to other models (Fig. 4d). These results point to an issue in SCOPE and BETHY with leaf-to-canopy scaling in needleleaf forests.
Analysis of CLM4.5-exp3 suggests several possible rea-sons for oversensitivity to APAR. First, we focus on emis-sions from sunlit and shaded portions of the canopy (Fig. S6 in the Supplement). CLM4.5-exp3 and PhotoSpec both show higher SIF under “high-light” conditions (sunlit leaves and direct radiation, respectively) compared to “low-light” con-ditions (shaded leaves and diffuse radiation, respectively), which is promising (Fig. S6A and D). Comparing the ra-tio of sunlit-to-shaded SIF in CLM4.5-exp3 to the rara-tio of direct-to-diffuse SIF in PhotoSpec (Fig. S6b and e) shows a higher ratio in CLM4.5-exp3 on average. The difference peaks in midday, when sunlit leaf area is maximized
(self-shading minimized) in CLM4.5 but with no major differ-ence in the amount of direct radiation and decreases with an increasing sun angle (morning and afternoon) and with in-creasing rainfall (in the afternoon on average and during the rainy period in late July to early August), both of which in-crease the shaded fraction. As such, accounting for the view angle and different illumination metrics for PhotoSpec and CLM4.5 (most comparable in morning, afternoon, and dur-ing rainy days) reduces, but does not entirely remove, the positive bias in high-light conditions.
Second, the degree of light saturation (x) is twice as high in the sunlit canopy in CLM4.5 (Fig. S7 in the Supplement), which leads to low fluorescence efficiency in sunlit leaves and high fluorescence efficiency in shaded leaves. While this produces high photochemistry in shaded leaves, it con-tributes a small fraction of SIF to the total canopy (∼ 20 %) despite higher fractions of shaded leaves (about two-thirds at noon; Fig. S6C), and thus sunlit leaves dominate SIFyieldand
SIFcanopy. Therefore, it seems likely that a model’s
represen-tation of canopy structure including the partitioning between sunlit and shaded leaf area fractions has an important impact
upon canopy SIF. Biases in the sunlit and shaded fraction will likely propagate into the simulated value of canopy SIF. However, it is important to know that the observed sunlit and shaded fraction from PhotoSpec is estimated as well, since it is currently not possible to determine the precise sunlit and shaded fraction within PhotoSpec FOV.
Additionally, all formulations of CLM4.5 (and most mod-els except BETHY and SCOPE) show a lack of decline in SIFyieldwith APAR compared to measurements of absolute
SIF (Fig. 5e). For CLM4.5, the relationship between SIFyield
and APAR depends upon the relationship between the degree of light saturation and reversible NPQ (Raczka et al., 2019). This suggests that it is important to properly represent the NPQ response to environmental conditions when simulating SIF.
While most of the model bias is reduced in SIFyield
(126 %; mostly attributed to BETHY and SCOPE), the re-maining signal, representing the dynamic response to syn-optic conditions (e.g., Magney et al., 2019), is poorly rep-resented in models, as demonstrated in a time series of 5 d means (Fig. 3d). Most models show zero to strongly negative correlation with observations at the synoptic scale, and only three models (SCOPE, ORCHIDEE-exp3, and BETHY-exp2 and BETHY-exp3), produce a correlation greater than 0.5. These are the only three models that also capture a negative relationship between SIFyieldand APAR (Fig. 5e).
In general, predicted SIFyield is stable during our short
study period (Fig. 3). Half of the models show a significant positive correlation with GPPyield(r > 0.85), and half show
zero or a negative correlation (Fig. S8 in the Supplement). While these findings run counter to observed SIFyield, which
shows a clear response during and following the storm event and moderate positive correlation with observed GPPyield
(r = 0.40), they show some consistency with observed SIFrel
(grey line in Figs. 3 and S8A), which like many models is stable and uncorrelated with GPPyield. We refer the reader to
Sect. 2.2.2 for clarification of the important difference be-tween SIFyieldand SIFrel.
Leaf-to-canopy scaling
Several methods have been proposed to transfer predicted leaf-level SIF emissions to the top of the canopy. While leaf-to-canopy scaling enables efficient global-scale simula-tion, the diversity of novel methods adds uncertainty to the canopy-level estimate of SIF (in addition to aforementioned uncertainties in structure, APAR, photochemistry, and fluo-rescence). These differences are evident in a comparison of Figs. 3 and 4, in which yields are plotted on a similar scale.
At least at the diurnal scale, there is some evidence that leaf and canopy emissions look more similar for models adopting simplified empirical scaling functions (SiB3, SiB4, CLM4.5, CLM5.0, and BEPS) than for models that more ex-plicitly account for radiative transfer (SCOPE, BETHY, and ORCHIDEE). For the more explicit models, the diurnal
cy-cle of φFis out of phase with SIFyield, the former of which
peaks in the afternoon and the latter of which peaks in the morning. This produces a reasonable agreement with Photo-Spec in phase and magnitude between SIFyieldand SIFrelfor
ORCHIDEE, but it produces divergence in the magnitude of SIFcanopyfor ORCHIDEE.
Model performance in leaf-to-canopy scaling is summa-rized in Fig. S8. The only three models with a positive re-lationship between yields (Fig. S8B) and between quench-ing terms (Fig. S8C) include an explicit representation of radiative transfer (i.e., SCOPE, BETHY, and ORCHIDEE). CLM4.5 is the only model with a positive relationship be-tween yields but not bebe-tween quenching terms. SiB3 and SiB4 are the only models with a positive relationship be-tween quenching terms but not bebe-tween yields.
Finally, we clarify an important difference between ob-served and predicted estimates of canopy-average SIF. Pho-toSpec scans direct emissions from sunlit and shaded leaves within the canopy, thus observing the total emission from leaves in the instrument FOV. We then average each of these leaf-level scans and report them as canopy averages. Model output, in contrast, is reported at the TOC, which represents the net emission from leaves after attenuation in the canopy (through canopy radiative transfer, the reabsorption of SIF, and shading). Assuming sunlit and shaded leaves within the canopy emit at the same rate as TOC leaves, attenuation will reduce the effective signal from leaf-level emissions within the canopy. As such, the average of leaf-level emissions (canopy average) is expected to be lower than the net emis-sion of leaves reaching the top of the canopy.
This is important because CLM4.5 shows a strong attenu-ation of SIF from the leaf level to TOC, decreasing by a fac-tor of 2–3 at midday (Fig. S7). The interpretation here is that the model bias in absolute SIF may actually be higher than reported here; however, we note that more quantitative information on the observed fraction of sunlit vs. shaded leaves and comparative top-of-canopy SIF values for the same canopy elements are needed (to account for off-nadir SIF viewing) for a more accurate determination of scaling between observed canopy and top-of-canopy SIF.
Within-model experiments
In most cases, within-model experiments produce improve-ments in some metrics and degradation across others (per-formance change is quantified by reporting correlation val-ues in brackets). An important and unexpected result of this study is the impact of different levels of tuning to observa-tions on our predicobserva-tions. While this work represents a snap-shot of the state of the art in site-level TBM–SIF modeling, and we have taken great care to control for environmental conditions (most important being illumination), an important overall takeaway is for future model comparisons to make additional efforts to control for initial conditions and vegeta-tion state (i.e., model biophysical parameters).