1
Design and
Manufacturing of a Microcalorimeter for Measuring Heat Flows in
Electrochemical Reactions to milli-Kelvin Precision
by
Rebecca Kestin Submitted to the
Department of Mechanical Engineering
in Partial Fulfillment of the Requirements for the Degree of Bachelor of Science in Mechanical Engineering
at the
Massachusetts Institute of Technology June 2018
C 2018 Rebecca Kestin. All rights reserved.
The author hereby grants to MIT permission to reproduce and to distribute publicly paper and electronic copies of this thesis document in whole or in part in any medium now known or
hereafter created..
Signature of Author:
Signature redacted
Department of Mechanical Engineering May 29, 2018
Certified by:
Signature redacted
Betar Gallant Assistant Professor of Mechanical Engineering
Signature redacted
Thesis SupervisorAccepted by: MASSACHUSETTS INSTITUTE OF TECHNOLOGY
SEP 13(2018
LIBRARIES
Rohit Karnik Professor of Mechanical Engineering Undergraduate OfficerDesign and Manufacturing of a Microcalorimeter for Measuring Heat Flows in Electrochemical Reactions to milli-Kelvin Precision
by
Rebecca Kestin
Submitted to the Department of Mechanical Engineering on May 29, 2018 in Partial Fulfillment of the
Requirements for the Degree of
Bachelor of Science in Mechanical Engineering
Abstract
Due to their high energy density, lithium-air batteries have tremendous potential for application to batteries for electric vehicles. While significant efforts have been made in understanding the material origins of electrochemical performance under discharging and charging conditions, there is still very limited understanding of the thermodynamics and thermal science, including heat transfer, of such reactions. Several methods and procedures that have been previously used to deduce entropy profiles in batteries are examined. One such microcalorimetric device allows for measurements of heat flows in electrochemical reactions to milli-Kelvin precision. This device has not previously been applied to gas-to-solid reactions. Next, an explanation of the design and manufacture of a device adapted to measure heat flows in solid-to-gas electrochemical reactions is explained. The high sensitivity of the measurements resulted in high noise levels. This paper also explains the main methods used to address and reduce this level of noise.
Thesis Supervisor: Betar Gallant
Acknowledgements:
I would like to thank Mingfu He for his guidance and support throughout this entire project. I
would also like to thank Professor Betar Gallant for her advice and support throughout the past year. Their mentorship has been invaluable and has made this an incredibly valuable learning experience.
I would also like to thank Mark Belanger for the many hours he spent assisting with the machining
of the device and the expertise he provided to the project.
I would also like to acknowledge the invaluable assistance from Nha Nguyen, Farita Tasnim,
Aaron Yeiser, Mark Vrablek, Nicholas McCoy and Chetan Sharma designing and debugging the electronics. In addition, the assistance from Elizabeth Cheng-Davidson machining the brass enclosure.
I would also like to thank MIT's Cyprus Engineering Design Studio, MIT's Pappalardo Labratory,
Lily Zhou, Benjamin Rowley, and Dr. Hughey for donation of several components for this project. In addition, many thanks to the Putz's Wolo Workshop for the use of the space and equipment when debugging the circuit board.
Contents
A b stract ... 3 Acknowledgem ents: ... 5 List of Figures ... 9 List of Tables ... 9 Introduction ... I I Background ... I I Therm odynam ics of Electrochem ical Reactions ... I I Prior M ethods ... 12Calorim etry ... 12
T h erm isto r ... 13
Probe Beam Deflection ... 13
P V D F ... 14
Experim ental Setup ... 15
Redesigned M icrocalorimeter ... 15
Pyroelectric Sensors ... 17
Circuit Board ... 17
Therm odynam ic M odel of Electrochemical Cell ... 24
Further W ork ... 26
W orks Cited ... 27
List of Figures
Figure 1: Probe Beam Deflection Setup ... 13
Figure 2: Assembled Microcalorimeter...14
Figure 3: Microcalorimeter Cross Section...15
Figure 4: Diagram of Working Electrode and PVDF Foil...15
Figure 5: B rass H ousing...16
Figure 7: Operational Amplifier Circuit...17
Figure 8: Improvements to Resetting the Voltage...18
Figure 9: Improved Circuit Design...19
Figure 10: Eagle Schematic of PCB...20
Figure 11: Eagle Layout of PCB...20
Figure 12: Noise due to Vibration...21
Figure 13: N oise due to A rduino...21
Figure 14: Reduced Noise from Arduino...22
Figure 15: R am ping V oltage...23
Figure 16: Resistor Model of Thermodynamic Model of Microcalorimeter... 23
List of Tables
Table 1: Properties of ADA4530 Operational Amplifier...19Introduction
There is a need for significant improvements in the capacity, efficiency, and longevity of batteries for electric vehicles and other battery-powered devices. There has been a recent focus in the battery field on metal-gas batteries and, in particular, on gas-to-solid reactions. While significant efforts have been made in understanding the material origins of electrochemical performance under discharging and charging conditions, there is still very limited understanding of the thermodynamics and thermal science, including heat transfer, of such reactions [1]. One such gas-to-solid battery, Li-02, has generated interest because it is projected to be capable of having gravimetric energy densities as high as 2000 Wh/kg [2]. This predicted energy density is around 2 to 4 times higher than the gravimetric energy density in today's Li-ion batteries (which are commonly used in modem electric vehicles) at the packaged cell level [3].
Both the Li anode and the 02 cathode undergo reactions that are governed by the intrinsic electrochemical redox behavior, and are modulated by the solvent, but it is not known how these microscopic processes influence the heat and entropy transfers occurring within a reacting electrode. Thus, there is a need to have tools that can probe individual electrode reactions and at scales that yield insights into the molecular-scale processes. This thesis examines the creation of a device to determine the entropy profile of an electrochemical reaction in solid-to-gas electrochemical reactions.
Background
Thermodynamics of Electrochemical Reactions
The Gibbs free energy of a reaction is described by the following equation:
AG = AH - TAS
where H is the enthalpy of reaction, T is the temperature, and AS is the entropy. The last two terms in this equation are often grouped together and known as the Peltier Heat, H:
H7 = TS
This if the Peltier heat of a reaction is known, and the temperature of the reaction is known, the entropy can be determined. As a battery is charged and discharged, the entropy of the system changes. Determining how the entropy profile changes during charging and discharging cycles, under different current rates, and at different temperatures can provide key insights and inform the design of better batteries.
If the current is sufficiently low, as it is in the microcalorimetry experiments, effects due
to Joule heating can be ignored [4] .By combining these equations and the Nernst equation and
ignoring effects due to Joule heating, the change in heat of a reaction can be determined.
(5q = TASd + I1r1neFd
where 4 is the reaction variable which states progress of the reaction, rj is the overpotential, ne is the stoichiometric number of electrons, F is the Faraday constant, and AS is the molar entropy
change. The overpontential for the reaction is the difference in voltage between the thermodynamically determined reduction potential and the potential at which the reaction is
carried out.
The quantity of interest is the reversible Peltier heat because with it the entropy can be calculated. However, a reaction cannot be carried out at exactly 0 overpotential. If the experiment is repeated with varying overpotentials, the associated heat flows will change slightly. Consequently, by extrapolating these values to 0 overpotential, the reversible Peltier heat can be determined [4]. In that case, ij = 0, so the equation becomes:
Sq = TASd
If the temperature of the system is known, the entropy for a given state of charge can be
determined. By repeating these experiments for many different states of charge, a complete entropy profile of a half reaction can be determined.
Prior Methods
One of the key aspects of this project involved researching several methods by which measurements of entropy in electrochemical cells was determined and choosing one to pursue further. In this section, several of the methods that were examined in preliminary stages but not pursued further are summarized.
Calorimetry
Calorimetry is one of the oldest methods of determining the heat transfers associated with electrochemical (or chemical) reactions. In the simplest type of adiabatic calorimetric experiment, the components of the electrochemical reaction are put in contact with a large thermal mass of
known temperature. After the reaction occurs, the temperature within the system undergoing reaction is perturbed from equilibrium, and then allowed to equilibrate. By measuring the change in temperature of the system, and using the known thermal properties of the large thermal mass, the change in energy of the system can be calculated, and from that the heat flows can be deduced. Heat conductivity within this system must be significantly faster than with the outside in order to achieve accurate results.
The biggest advantage of this method is that it is extremely easy to carry out. However, the sensitivity is also poor. First of all, the heat capacity of the thermal mass is generally significantly larger than the heat capacity of the reactants themselves. Consequently, the change in temperature of the system is significantly less than the change in temperature if only the electrochemical reactants were being measured. Consequently, the sensitivity of the experiment itself is often several orders of magnitude worse than of the instrumentation because the change in temperature of the system is also several orders of magnitude lower than it would be. Furthermore, the temperature of the system must be roughly uniform in order for temperature readings to be representative of the whole system. It takes time for the temperature of the thermal mass to reach equilibrium. As a result, it is hard to measure heat flows in a reaction on very small time scales.
There have been many recent advances in calorimetry machines. However, these machines were prohibitively costly for the scale of this project, and as a result the background research done for this project focused mostly on benchtop calorimetry. In those cases, it is generally better for measuring long-term heat flows over full charging or discharging cycles. In order to deduce useful information about the evolution of entropy profiles in electrochemical reactions, an experimental approach with more sensitivity is required. Consequently, this method was not pursued farther.
Thermistor
In the 1970's and 1980's several groups began using thermistors to measure Peltier heats in electrochemical reactions over shorter time scales than could be accomplished through simple calorimetry[5-9]. Thermistors are resistors whose resistance decreases as they are heated. By using a Wheatstone bridge amplifier, the change in resistance of the thermistor can be measured. From there, the change in temperature of the system can be calculated. This is carried out for both the reduction and oxidation reactions. The reversible heat in both cases should be of the same magnitude but opposite signs, whereas the irreversible heat always causes an increase in temperature. By averaging the magnitude of heat changes in the two reactions, the Peltier heats can be deduced[6]. In 1979, Ozeki et al began coating the thermistor itself with the working electrode. The thermal mass of the whole system was quite small and the temperature probe was in direct thermal contact with the electrode itself. Consequently, temperature measurements at significantly smaller time scales and to higher precision could be measured.[5] In later experiments, Ozeki et al were able to measure temperature changes as small as 0.1 mK. Furthermore, the Peltier heats they measured were within about 10% of accepted values from literature. [6]
One of the downsides of this method is that the circuit used to measure the temperature changes generates irreversible Joule heating also occurs. In 1984, Donepudi et al proposed a method for correcting for the effects of Joule heating, thereby obtaining more accurate measurements of the reversible Peltier heats. To do this, they analyzed the differences in heat effects between anodic and cathodic half reactions.[7] The following year, Shibata et al achieved even higher time resolution by switching from a round to a flat-plate thermistor. This allowed even faster temperature equilibration in the system.[8]
Probe Beam Deflection
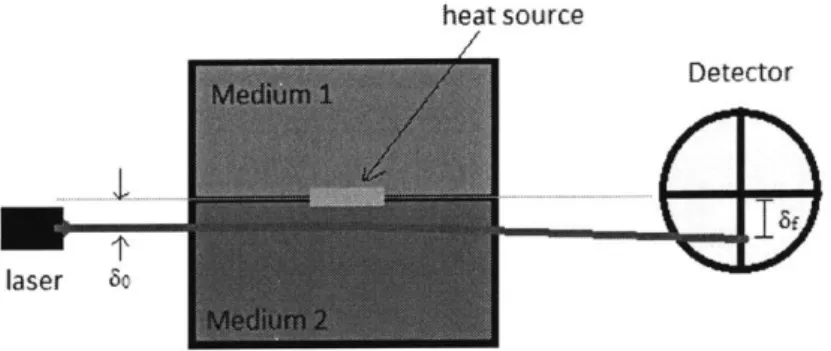
Probe beam deflection (PBL) is a recently-developed method of performing temperature measurements. While there are many experimental setups whereby this can be accomplished, they all rely on using temperature gradients to redirect a laser a measurable amount. One such experimental setup, used by Hai and Scherson to measure the rate of heat generation at the interface between two directed parallel to an interface between two different mediums where heat is being generated is shown in Figure 1. The temperature gradient within the second medium causes the beam to change direction slightly, leading to a larger deflection at the detector. Based on this deflection, the rate of heat generation at the interface can be determined. [10]
There are several drawbacks to this method. The equipment is expensive and calibration is a time consuming process. Furthermore, determining the exact effect that a temperature gradient has on a beam is not trivial.
heat source
Detector
laser 5o
Figure 1: Probe Beam Deflection (PBL) is one method of measuring heat flows. In it, a laser is deflected by the thermal gradient that the heat source induces in medium 2.
PVDF
Recently, several experiments have been conducted by the Schuster Group at the Karlsruhe Institute of Technology that use Polyvinylidene foil (PVDF) as a temperature sensor. PVDF foil has pyroelectric properties. Essentially, when it experiences a change in temperature it emits electrons. Consequently, it is an excellent temperature sensor. Similar to the setup typically done in electrochemical experiments with thermistors, Schuster's group placed the working electrode in direct contact with the PVDF foil. In order to ensure good thermal contact between the two, they were clamped between O-rings, and air was evacuated from between the layers. An integrating circuit with an operational amplifier was used to measure the total charge released from the PVDF foil.
In the early 2000's, Schuster et al demonstrated that the foil could be used to measure the Peltier heats in electrochemical half reactions to mK precision on ms timescales. In fact, they were able to measure heat effects in electroplating reactions of a few percent of a monolayer [11] [12]. In 2013, Bickel et al demonstrated that the method could be applied to electrochemical reactions driven at larger over potentials [13]. In the same year, Schmid et al used a similar method to derive the coordination number of Li' [14]. In 2015, Frittmann et al used a similar experimental setup, but replaced the PVDF with a Lithium tantalate (LiTaO3) crystal as a temperature sensor [15]. The LiTaO3 crystal also has pyroelectric properties, but is even more sensitive than the PVDF foil. A recent review article published by the group summarizes the main progress made by the group so far [16] including several other key experiments performed by the Schuster group [17] [18] [4].
Experimental Setup
Redesigned Microcalorimeter
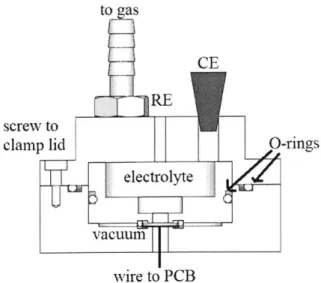
One main goal of this project is to be able to explore solid-to-gas electrochemical reactions, and as a result several changes had to be made to the design presented by Schuster. The microcalorimeter has a compartment inside for gasses, and there are inlet and outlet valves on the top. Seals are maintained through the use of chemically resistant O-rings. The counter electrode and reference electrode are inserted through the top, and are then sealed with PTFE tape. The electrolyte is also placed in this chamber. In order to ensure that the electrolyte is fully sealed in the chamber, the fully assembled calorimeter was filled with electrolyte and left for two weeks. No leakage occurred. A cross-section of the calorimeter is shown in Figure 3.
The microcalorimeter is constructed of PTFE. This material was chosen for its low reactivity and high strength properties. There was concern that using a metal calorimeter could cause side reactions to occur between the electrolyte and walls of the calorimeter. Furthermore, a Teflon calorimeter is non-conductive, and consequently there is less risk that an accidental short-circuit will occur.
An additional valve is placed on the side of the calorimeter. This attaches to a vacuum pump, and maintains a vacuum between the foil layers inside the calorimeter. This vacuum is important because it ensures that good thermal contact between the working electrode, PTFE, and PVDF foil is maintained at all times. This portion of the setup is shown in further detail in Figure 4.
to as
CE
RE screw to
clamp lid O-rings
electrolyte
vacuum
wire to PCB
Figure 3: Cross section of microcalorimeter.
Electrolyte
vactnuni
0 rings
Teflon PVDF
Figure 4: Closer look at microcalorimeter setup.
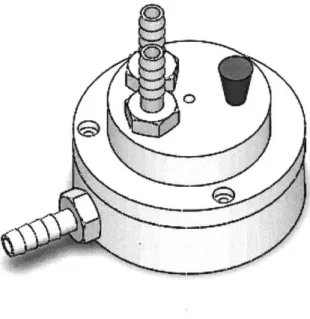
The entire calorimeter is encased in a brass housing. This serves several key functions. First, it serves as a large thermal mass to keep the temperature around the foil steady. Second, the brass serves as a pseudo-Faraday cage and ground plane, helping to reduce the noise in the circuit. Third, the brass is extremely heavy. The entire assembly sits on a rubber mat. This combination is essentially a spring-mass-dashpot system. The heavier the assembly, the better the damping. Due to the piezoelectric nature of the foil, damping out vibrations is an essential to getting a high signal to noise ratio. Noise due to vibrations was mentioned as an issue the Schuster group encountered, but they did not go into significant detail on how it was addressed [11].
Figure 5: The brass helps to thermally isolate the system and increases the damping of the system.
Pyroelectric Sensors
Pyroelectic materials release electrons as their temperature changes, and as a result can be effective temperature sensors. In this setup, a pyroelectric PVDF foil manufactured by Goodfellow is used as a temperature sensor. Unfortunately, as with many pyroelectric materials, this sensor is also piezoelectric, meaning that induced stresses in the material also cause the material to release electrons. Consequently, it is essential to minimize the stresses induced in the material. To do this, the PVDF foil was clamped between two O-rings and securely within the microcalorimeter. This isolated the foil from changes in air currents within the room. The entire setup was mounted on a vibration isolation table to further reduce the effects of the piezoelectric properties of the foil.
Circuit Board
In order to measure changes in temperature to milli-Kelvin precision, a large amplification of the signal from the PVDF sensor was required. The number of coulombs of charge,
Q, released
by the foil as a result of a temperature change, AT, can be described by the following equation:
Q
= kAATwhere A is the area of the foil and k is its pyroelectric constant. The foil used in this setup has an area of about Icm2 and a pyroelectric constant of 27 --. Consequently, temperature changes on
m2K~ the order of ImK would release about 2.7 pC.
C Ii1
Vouit
Figure 7: Operation amplifier integrating circuit.
To measure changes in charge to this sensitivity, an integrating op amp circuit was used as shown in Figure 7. In this circuit, the foil is modeled as a current source because it sources a specific amount of charge, rather than a specific driving force. An ideal op amp has an infinite input impedance, meaning that the two input terminals neither source nor sink current. Consequently, the entire charge from the foil is used to charge the capacitor. In a capacitor, the voltage, V, is directly proportional to the charge on the capacitor,
Q.
I.e.,V
=
Q
C
where C is the capacitance. Consequently, an integrating circuit is robust to varying current rates. The voltage is related to the total amount of charge, and is not effected by how long that charge took to accumulate. A capacitance of 49 pF was chosen for the capacitor. Consequently, a charge of 2.7 pC, corresponding to a change in temperature of about lmK, would result in a voltage of about 55mV.
Several other changes were made to the circuit as well. The circuit is an integrating circuit, and consequently it was necessary to reset the voltage across the capacitor before beginning an experiment. Originally, this was done by simply short-circuiting two wires on either side of the capacitor. While this method did discharge the capacitor, it also required someone to physically touch the wires across the capacitor. Doing so slightly changes the capacitance of the circuit. When the wires were dropped, the capacitances changed back. This small change was amplified significantly by the op amp, leading to a noticeable spike in voltage every time the circuit was reset. To address this issue, the physical wires were replaced by a relay. A relay is a mechanical switch controlled by an inductor. The Arduino was not powerful enough to power the relay directly, so an n-channel Mosfet (2N-7000) was used to control the relay. As can be seen in Figure
9.
When powered and controlled by a computer, the Arduino caused significant noise in the circuits output voltage. The noisy waveform had an amplitude of several volts (depending on how close the Arduino was to the circuit) and a period of 30 seconds. Consequently, the Arduino was powered from a 9V cell to eliminate this source of noise.
3.00 2.50 . 2.00 1.00 %f1.50 (> WJ 1.50 _ .3 1.00 -1.00 -0.,50 -3.00 0.00 0.001 0.002 4.00 8.00 12.00
Time (mn) Time (min)
Figure 8 a: voltage reset manually by short circuiting wires on either side of the capacitor. The voltage does not stay stable at 0 because the capacitance of the wires changes as they are dropped. and b: voltage resetting using an Arduino, Mosfet, and relay. As can be seen, the second method significantly reduces the noise in the circuit.
Due to the circuits high amplification, it is essential that the op amp is powered off of a stable power supply in order to reduce the noise in the circuit. Consequently, a 9V battery was chosen to power the circuit because it has a stable output voltage. A voltage divider between the terminals of the battery provided a pseudo-ground for the circuit. To further stabilize the voltage, several capacitors were placed across the battery's terminals. A diagram of the improved circuit is shown in Figure 9.
Arduino
C
vout
Figure 9: Improved circuit design.
An ideal op amp has an infinite input impedance, meaning that the two input terminals neither source nor sink current. However, a real op amp has a small input bias current during operation. Consequently, it is essential that the current sourced by the PVDF foil, I, is significantly greater than IIB, or
I = -
<
IIBAt
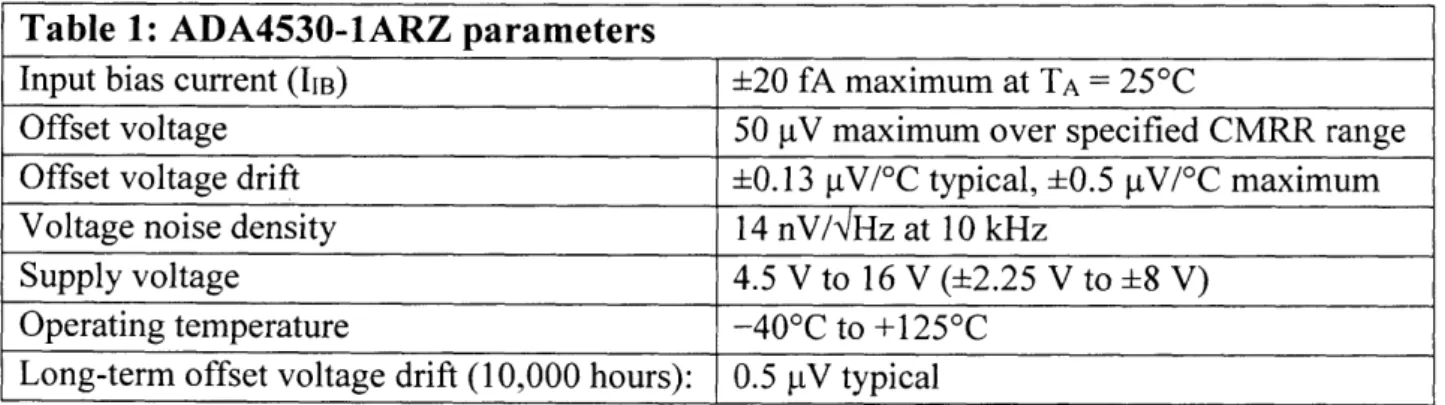
where At is the time scale of the reaction. For a 2.7pC charge released during Ims, I is 2.7nA. An ideal op amp also has no threshold voltage needed between its input terminals to generate an output voltage. However, real world op amps have an input offset voltage. It is essential that the voltage across Ci be significantly larger than this input offset voltage. To meet these requirements, the ADA4530-lARZ op amp manufactured by Analog Devices was chosen. The critical parameters of the op amp are listed in Table 1.
Table 1: ADA4530-1ARZ parameters
Input bias current (IIB) i20 fA maximum at TA = 25'C
Offset voltage 50 pV maximum over specified CMRR range
Offset voltage drift 0.13 gV/0C typical, 0.5 [tV/0C maximum
Voltage noise density 14 nV/NHz at 10 kHz
Supply voltage 4.5 V to 16 V ( 2.25 V to 8 V)
Operating temperature -40'C to +125'C
Long-term offset voltage drift (10,000 hours): 0.5 pV typical
A significant amount of noise was caused by the jumper wires in the circuit. Consequently,
a PCB circuit was designed to eliminate these jumper wires. The wires running from the foil to the PCB and from the PCB to the output scope were replaced with BNC cables to reduce the overall signal noise.
In R ELY-SPD L- O-15 S+
UE P
-ADA4530-1ARZ '1. ORA]N
rL1.ORD 4 2 OCRD aII 7 4!;pF B9F TOMO]LFI
6 O~ V OUTD 5OURC (..Out W~E2 gnd RL P2
U-Figure 10: Eagle Schematic of PCB.
Figure 11: Eagle Board Layout of PCB
Due to the high sensitivity of the circuit, mechanical vibrations caused significant noise. With initial iterations of the circuit, if someone walked nearby to the circuit board there would be large spikes in the output voltage.
3
2
>1
a) +J0-1
-2
-3
5.50E-03
9.50E-03
1.35E-02
Time (h)
Figure 12: The output voltage noticeably spikes when the circuit board is exposed to small vibrations (indicated by the vertical red lines).
Powering the Arduino off of a computer caused a strange periodic noise signal. It is likely that something in the software caused a periodic change in the signal in the communication between the Arduino and the computer. This in turn caused a changing electromagnetic field which was picked up by the jumper wires in the circuit board and amplified significantly. The signal can be seen in Figure 14. When the Arduino was moved farther away from the circuit board or shielded, the magnitude of the noise dropped significantly.
1
-1
Arduino
duino shielded moved
4farther .. .. ... .. ....... ... .I ... ... .. ... ... ... ... ... .a.. .. ... ... ... ... .. .
0
2
Time (min)
4
6
I I0.5
0
-0.5
tw 0 I7v
Figure 13: Periodic noise caused by the Arduino with a period of about 30 seconds. When the circuit board was shielded from the Arduino, or the Arduino was moved farther away, the noise
was reduced.
In order to address this issue, several changes were made. A PCB of the circuit board was printed to eliminate the need for jumper wires. The Arduino was powered off of a battery instead of a computer, and the circuit was grounded to the brass case and shielded better using Aluminum foil.
0.01
0.00
4-J 5 0.00-0.01
0.00
0.20
0.40
0.60
0.80
1.00
Time (min)
Figure 14: The noise from the Arduino could be significantly reduced by shielding the circuit board and powering the Arduino off of a battery instead of a computer.
There is a source of noise that has still not been identified. The voltage ramps up slightly over time at a rate of about 1 V/minute when left alone. This occurs even when it is disconnected from the PVDF foil. 1V/minute corresponds to about 8.17 * 10- A which then passes through the
integrating circuit. This is significantly larger than the input bias current of 20 femto-Amps, so it is unlikely that the charge is caused by the bias on the op amp. A sample waveform of this behavior is shown in Figure 16. As can be seen, the voltage ramps up at a reasonably steady rate. Compared to the time scales we are observing (lOims), a steady charging rate of 1 V/s will cause problems.
The ramp could be eliminated by either subtracting out the background noise by interpolating the voltage caused by the ramping behavior. Alternatively, a high pass filter could be constructed. However, neither of these are ideal. In practice, the source of the ramping voltage should be determined.
a) bD Cu 4~J
0
2.50
2.00
1.50
1.00
0.50
0.00
-0.50
5.00
7.00
9.00
11.00
13.00
Time (min)
Figure 15: There is an unidentified source of noise causing the voltage to slowly ramp up over time. While this is not a large enough source of noise to effect measurements on a small time
scale, it is important to determine the source of the noise to ensure that it should be ignored.
Thermodynamic Model of Electrochemical Cell
It is essential to know how long it takes for the PVDF foil and working electrode to reach a thermal equilibrium to ensure that the experiment is actually capturing the full extent of the reaction. This can be done as follows:
First, the thermal resistance, Rcond between the working electrode and the PVDF foil can be calculated by the resistor model. A is the cross-sectional area of the foil, and k is the thermal conductivity of the material. The air between the layers is evacuated, and as a result convection
need not be considered.
Rco-d
Yd
A L 1 Lnickel LPTFE LPVDF * k A Tnicke+ TkPTFE KPVDFNickel Teflon PVDF
Heat iia
-
aftL.jJL-Source
IIIV
.Figure 16: Resistor model of the microcalorimeter.
Based on the resistor model, the heat flux through the system can be calculated, where
AT
q = R
Rcond
Integrating this with respect to time yields the total heat transferred during the time of interest.
Q =
f
q dtNext, the total heat required to increase the temperature of the PVDF can be calculated. Q = mcPAT = LApc AT
By setting these two values equal to each other, the temperature profile of the system over time
can be determined.
A T
L pvdf Ap cpAT =f 1 L
Snickel A nicele + kPTFE + PVDFPD
dt
Differentiating both sides with respect to time yields a first order differential equation.
LpvdfPCp Lnickel + knickel LPTFE LPVDF kPTFE kPVDF) dAT at =AT AT = cle-tc2 AT (t = 0) = 1mK cl = 1mK Lnickel knickel + LPTFE LPVDF 0 kPTFE kPVDF
Next, the difference in temperature between the nickel and the PVDF after 10 ms can be calculated as:
AT (t = 10ms) = cle
10ns
C2 = 9.435 * 10-5 K « 1mK
Consequently, it is reasonable to assume that measuring the reaction for 1 Oms would be sufficient.
Table 2: Thermodynamic Properties of Microcalorimter Components
Variable Symbol Value Units
Nickel thermal conductivity kNickel 90.9 W/(m*K)
Nickel length Lnickel 50 m
PTFE thermal conductivity kPTFE 0.25 W/(m*K)
PTFE length LPTFE 25 tm
PVDF thermal conductivity kPVDF 0.1 W/(m*K)
PVDF length LPVDF 9 jIm
PVDF density p 1.76 g/cm3
PVDF specific heat capacity cp 1.4*1 J/(kg*K)
Further Work
The next major step that must occur is calibrating the microcalorimeter using a Peltier heat from a known electrochemical reaction. This will likely be done with the [Fe(CN)6]4-/[Fe(CN)6]3
-redox reaction for which the Peltier heat has been well documented in literature. Boudville et al documented a value of -45.1 0.5 kJ/mol at 298K in 1988 [19]. In 2010, Fang et al documented a
similar value of -45.62 kJ/mol at 298K [20].
Another more long-term improvement that can be attempted is switching out the PVDF foil for a more sensitive temperature sensor such as lithium tantalate. This was done by the Schuster group at KIT, and allowed even more sensitive measurements to be carried out. However, the electronics would have to be significantly improved before this could occur.
The current method of attaching wires to the PVDF foil might be increasing the noise caused by mechanical vibrations. Currently, a piece of copper tape with conductive adhesive is placed on the PVDF foil. Before attaching the tape, a wire is soldered onto the non-adhesive side. The PVDF foil and copper tape have different Young's moduli and thermal coefficients of expansion. Consequently, if the setup moves or changes temperature, the two materials deform in slightly different ways. This induces stresses in the PVDF foil. Due to its piezoelectric nature, the induced stresses lead to induced currents and noise. In the future, a different method of forming electrical contacts should be used. On potential method would be to use a small conductive plate on either side of the foil. Due to the vacuum between the layers and the clamping force, adhesive may not be needed at all to form good electrical contact.
Works Cited
[1] Bruce, P. G., Freunberger, S. A., Hardwick, L. J., and Tarascon, J.-M., 2012, "02 and Li-S Batteries with High Energy Li-Storage," Nat. Mater., 11(1), pp. 19-29.
[2] Imanishi, N., and Yamamoto, 0., 2014, "Rechargeable Lithium-Air Batteries: Characteristics and Prospects," Mater. Today, 17(1), pp. 24-30.
[3] Lu, Y.-C., Gallant, B. M., Kwabi, D. G., Harding, J. R., Mitchell, R. R., Whittingham, M. S.,
and Shao-Horn, Y., 2013, "Lithium-oxygen Batteries: Bridging Mechanistic Understanding and Battery Performance," Energy Environ. Sci., 6(3), p. 750.
[4] Etzel, K. D., Bickel, K. R., and Schuster, R., 2010, "Heat Effects upon Electrochemical Copper Deposition on Polycrystalline Gold," ChemPhysChem, 11(7), pp. 1416-1424.
[5] Ozeki, T., Watanabe, I., and Ikeda, S., 1979, "Cu/Cu 2+ SYSTEM IN AQUEOUS
PERCHLORATE SOLUTION," J Electroanal Chem, 96, pp. 117-121.
[6] Ozeki, T., Ogawa, N., Aikawa, K., Watanabe, I., and Ikeda, S., 1983, "THERMAL ANALYSIS OF ELECTROCHEMICAL REACTIONS INFLUENCE OF
ELECTROLYTES ON PELTIER HEAT FOR Cu(0)/Cu(II) AND Ag(0)/Ag(I) REDOX
SYSTEMS," J Electroanal Chem Elsevier Sequoia SA, 145, pp. 53-65.
[7] Donepudi, V. S., and Conway, B. E., 1984, "Electrochemical Calorimetry of the Zinc and
Bromine Electrodes in Zinc-Bromine and Zinc-Air Batteries," J. Electrochem. Soc., 131(7),
pp. 1477-1477.
[8] Shibata, S., Sumino, M. P., and Yamada, A., 1985, "AN IMPROVED HEAT-RESPONSIVE
ELECTRODE FOR THE MEASUREMENT OF ELECTROCHEMICAL PELTIER HEAT THE PELTIER HEAT FOR ELECTROSORPTION AND ELECI-RODESORPTION OF
OXYGEN ON A PLATINIZED PLATINUM ELECTRODE IN SULFURIC ACID SOLUTION," J Electroanal Chem, 193, pp. 123-134.
[9] Shibata, S., and Sumino, M. P., 1985, "THE ELECTROCHEMICAL PELTIER HEAT FOR
THE ADSORPTION AND DESORPTION OF HYDROGEN ON A PLATJNIZED
PLATINUM ELECTRODE IN SULFURIC ACID SOLUTION," J Elecrroanal Chem, 193, pp. 135-143.
[10] Hai, B., and Scherson, D., "In Situ Calorimetry at Metal-Electrode Liquid Electrolyte
Interfaces As Monitored by Probe Beam Deflection Techniques."
[11] Schuster, R., Rbsch, R., and Timm, A. E., 2007, "Microcalorimetry of Electrochemical
Reactions at Submonolayer Conversions," Z. FUr Phys. Chem., 221(11-12), pp. 1479-1491. [12] Etzel, K. D., Bickel, K. R., and Schuster, R., 2010, "A Microcalorimeter for Measuring
Heat Effects of Electrochemical Reactions with Submonolayer Conversions," Rev. Sci. Instrum., 81(3).
[13] Bickel, K. R., Etzel, K. D., Halka, V., and Schuster, R., 2013, "Microcalorimetric
Determination of Heat Changes Caused by Overpotential upon Electrochemical Ag Bulk Deposition," Electrochimica Acta, 112, pp. 801-812.
[14] Schmid, M. J., Bickel, K. R., Nov??k, P., and Schuster, R., 2013, "Microcalorimetric Measurements of the Solvent Contribution to the Entropy Changes upon Electrochemical Lithium Bulk Deposition," Angew. Chem. -Int. Ed., 52(50), pp. 13233-13237.
[15] Frittmann, S., Halka, V., Jaramillo, C., and Schuster, R., 2015, "An Improved Sensor for Electrochemical Microcalorimetry, Based on Lithiumtantalate," Rev. Sci. Instrum., 86(6).
[16] Schuster, R., 2017, "Electrochemical Microcalorimetry at Single Electrodes," Curr. Opin.
[17] Bickel, K. R., Timm, A. E., Nattland, D., and Schuster, R., 2014, "Microcalorimetric Determination of the Entropy Change upon the Electrochemically Driven Surface Aggregation of Dodecyl Sulfate," Langmuir, 30(30), pp. 9085-9090.
[18] Schmid, M. J., Xu, J., Lindner, J., Novik, P., and Schuster, R., 2015, "Concentration
Effects on the Entropy of Electrochemical Lithium Deposition: Implications for Li+ Solvation," J. Phys. Chem. B, 119(42), pp. 13385-13390.
[19] Boudeville, P., and Tallec, A., 1988, "ELECTROCHEMISTRY AND CALORIMETRY
COUPLING. IV. DETERMINATION OF ELECTROCHEMICAL PELTIER HEAT,"
Thermochim. Acta Elsevier Sci. Publ. BV, 126, pp. 221-234.
[20] Fang, Z., Wang, S., and Zhang, Z., "The Peltier Heat and the Standard Electrode Potential of Ferro--Ferricyanide Couple at 298.15 K Determined by Electrochemical-calorimetry."
.- -...
n .
I I-Appendices
...
--- ---7i ... .. ... ... 0.27 0.30 NA-A (140 0.73 . ... .. ... ... ...B
B
0
2,R9 .... .. ... .... ... .... ... ... 0 New's...
FW . .... ... ... ... ... .. .. ... ... -- -- -- - C a w " 5 .. . ... ... ... .. ... ... ... eel; ... ...bottorrAhalf of casel drawir
...
....
.
...
..
..
...
.
1: SCALE: !.,I we SHEET 1. OF
... ... .. ... ..
A
... ... .. .. ... ... 0"" cm rA w W. ww '. A.W. .. ... ... ... ... ... ... W . . ... ....2
M4xO.7 hole a d 0.3Zn depth "3pp' 3 holes Evenly Spac Afignment pin 0.32in tal0. 1 6in dia meter -4 3 pins Evenly Spaced A
SECTIC
...
...
... ... . -- Hole Interfaces vk h 1/16 NTP Pipe Size 27 threods per inch 0.26"threod engagement2
...
...
...
...
.
...
...
..
..
..
.
...
...
..
B
B
t 1,75SECTIONA-A
01.75 0 1,56 1.34 0 0 ci it -w 0 0 1,3 6 0 3 OiO,75 ... ... O 75 ... ... ... ... ... ... ... .. .... ... : -... ... ...... ... ......
...
.. ...A
... ... ... ... ... ... .... ... WF RACE WCA&A 9 ... ... ... . ... ... ... ... ... ... t40- RrV .. .... .. .. . ... ... ... ...ftMXIII rCft N ft Ir. 00 ASA WIM
middle sAction of cas'e dra\A
....
..
..
..
.
...
...
.
-...
...
..
...
.
SHEET I OF
... ... ... ... -.... .. ... ....
I
2
le for alignment pin
I I II
Encps with:.
27 Threads Per I..h O.26" Thread Engagement
2 Holes Total
0.
Role or /
hole for m4 screw
Engages with:
1/16 NPT Pipe Size
27 Threads Per Inch
0.26 Thread Engagement 2 Holes total
Hole for M4 Screw Head inset 0.1 e diam 0.1W Thru Hole
3 Holes, equally spaced
0.17" diameter
Thra,
AoS holesequay spaced
"-SECTION
... .. fl .. , ..~ ...
Owc Zm ... ...
SIZE DWG. NO.
top
t*if
of case dr
A*Th 2flN SCALE: wsG: SHEET1