HAL Id: hal-01416310
https://hal.archives-ouvertes.fr/hal-01416310
Submitted on 14 Dec 2016
HAL is a multi-disciplinary open access
archive for the deposit and dissemination of
sci-entific research documents, whether they are
pub-lished or not. The documents may come from
teaching and research institutions in France or
abroad, or from public or private research centers.
L’archive ouverte pluridisciplinaire HAL, est
destinée au dépôt et à la diffusion de documents
scientifiques de niveau recherche, publiés ou non,
émanant des établissements d’enseignement et de
recherche français ou étrangers, des laboratoires
publics ou privés.
Probabilistic Analysis for Mixed Criticality Scheduling
with SMC and AMC
Dorin Maxim, Robert Davis, Liliana Cucu-Grosjean, Arvind Easwaran
To cite this version:
Dorin Maxim, Robert Davis, Liliana Cucu-Grosjean, Arvind Easwaran. Probabilistic Analysis for
Mixed Criticality Scheduling with SMC and AMC. WMC 2016 - 4th International Workshop on
Mixed Criticality Systems, Nov 2016, Porto, Portugal. �hal-01416310�
Probabilistic Analysis for Mixed Criticality
Scheduling with SMC and AMC
Dorin Maxim
1, Robert I. Davis
1,2, Liliana Cucu-Grosjean
1, and Arvind Easwaran
3 1INRIA, France
2
University of York, UK
3
Nanyang Technological University, Singapore
Abstract—This paper introduces probabilistic analysis for fixed priority preemptive scheduling of mixed criticality systems on a uniprocessor using the Adaptive Mixed Criticality (AMC) and Static Mixed Criticality (SMC) schemes. We compare this analysis to the equivalent deterministic methods, highlighting the performance gains that can be obtained by utilising more detailed information about worst-case execution time estimates described in terms of probability distributions.
I. INTRODUCTION
In 2007, Vestal [13] introduced a mixed criticality task model, where each task is represented by multiple worst-case execution time (WCET) estimates that are determined at different levels of assurance. For example, the WCET
estimates C(LO) and C(HI) are the estimates for
low-assurance and high-assurance respectively in a
dual-criticality system. By contrast, in this paper we use a richer model based on probabilistic worst-case execution
time (pWCET) distributions, provided by probabilistic
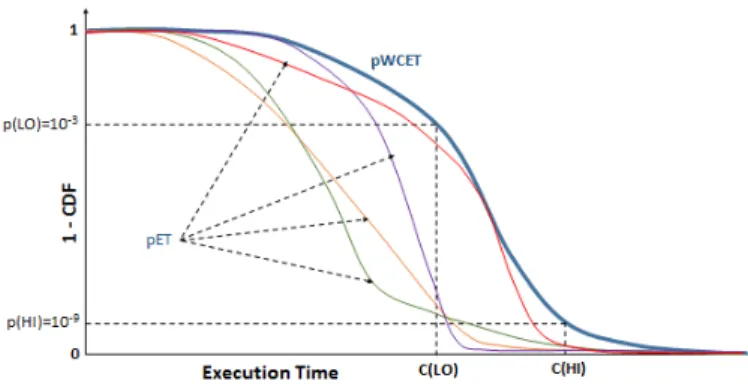
analysis of worst-case execution times of tasks [8], [1]. Figure 1 illustrates this richer model, where the line on the
graph denotes the 1-CDF (Complementary Cumulative
Distribution Function or exceedance function) of the pWCET for a task. The 1-CDF describes the probability that the WCET of the task exceeds any particular value given on the x-axis. The high-assurance estimate C(HI) may be obtained
using an exceedance probability (on the y-axis) of
p(HI) = 10−9, where 10−9 denotes an acceptable threshold
on the failure probability for each job of the task at the
high-assurance level1. Thus in a mixed criticality system with
a probabilistic description, the scheduler can safely ignore any execution demand beyond C(HI) because its probability of occurrence is below the threshold required. Further, at a lower level of assurance (say with acceptable threshold
p(LO) = 10−5), the scheduler can ignore any execution
demand beyond C(LO) because its probability of occurrence is below the threshold for that level of assurance.
In this paper, we focus on the development of a
probabilistic mixed criticality framework under the
Fixed-Priority Preemptive Scheduling (FPPS) policy. Our choice of FPPS is motivated by the fact that it is a standard scheduling policy employed in many applications. There are
two well-known FPPS schemes and corresponding
deterministic schedulability analyses in the literature on
mixed critiality scheduling; Static Mixed Criticality
(SMC) [3] and Adaptive Mixed Criticality (AMC) [2]. We
1We note that the relationship between failure rates and acceptable
thresholds on failure probabilities is not direct, but rather depends on various factors considered in fault tree analysis [9]. In this paper, we assume that suitable values for the thresholds are given, and make a somewhat arbitrary choice of values for illustration purposes
Fig. 1: Exceedance function or 1-CDF for the pWCET distribution of a task, and also pET distributions for different jobs of the same task.
develop probabilistic analyses for both of these schemes. (A brief description of these schemes is given in Section II). A. Related work
A growing number of studies have been introduced for mixed criticality real-time scheduling, an overview of these approaches can be found in the review on mixed criticality systems [6]. Previous work on probabilistic analysis and mixed criticality systems was done for the Earliest Deadline First (EDF) scheduling policy. Santinelli and George [12] presented preliminary work that investigates the probabilistic
C-space, showing how schedulability varies with task
execution times under EDF. Guo et al. [10] extended the mixed criticality task model with a single exceedance probability value for the low assurance budget of each HI-criticality task, and used probabilistic analysis to improve schedulability. In contrast, we focus on the FPPS policy, and consider a richer task model with pWCET distributions.
II. SYSTEMMODEL
In this paper, we are interested in the Fixed Priority Preemptive Scheduling of a Mixed Criticality System (MCS) comprising a static set of n sporadic tasks which execute on a single processor. We assume without loss of generality that
each task τi has a unique priority. We further assume a
discrete time model in which all task parameters are given using integers.
Each task τi is defined by its period (or minimum arrival
interval), relative deadline, worst-case execution time, and
level of criticality (defined by the system engineer
responsible for the entire system): (Ti, Di, Ci, Li). We
restrict our attention to constrained-deadline systems in
In a mixed criticality system, further information is needed
in order to perform schedulability analysis. Thus a task τimay
be defined by: (Ti, Di, ~Ci, Li), where ~Ci is a vector of values
– one per criticality level, with the constraint L1 > L2 ⇒
Ci(L1) ≥ Ci(L2) for any two criticality levels L1 and L2. In
this paper we are concerned with dual criticality systems, with criticality levels LO and HI (where LO < HI).
Using a deterministic representation each LO-criticality
task τi has a single worst-case execution time estimate
Ci(LO), while each HI-criticality task τi has two worst-case
execution time estimates Ci(LO) and Ci(HI) with
Ci(HI) ≥ Ci(LO). We use p(LO) (and p(HI)) to denote
the worst-case probability that Ci(LO) (resp. Ci(HI)) is
exceeded during the execution of any single job of the task. Thus p(LO) and p(HI) reflect the confidence that we have in the two WCET estimates. Note, in this paper, we assume that these probabilities are the same for all tasks and so drop the index. We use exemplar values for p(LO) and p(HI) of
10−5 and 10−9 respectively. (Note for ease of presentation,
we also drop the index for C(LO) and C(HI) when using these terms in a generic way; nevertheless, these values are specific to each task).
By contrast, using a probabilistic representation, each
task τk (of LO- or HI-criticality) has a probabilistic
worst-case execution time distribution (pWCET) Ck. Further,
there is a correspondence between the probabilistic and
deterministic representations. Considering the 1-CDF
(exceedance function), f (Ck) for task τk, Ck(LO) (resp.
Ck(HI)) in the deterministic representation corresponds to
the value of f (Ck) at a probability of exceedance of p(LO)
(resp. p(HI)). Note beyond this correspondence, we make no assumptions in our analysis about the form of the distribution. We assume that the WCET values of two tasks
Ci and Cj are independent and so too are their pWCET
distributions Ci and Cj [7].
For simplicity of presentation, we assume that C(HI) is not exceeded and that p(HI) therefore represents the probability that the WCET of a HI-criticality task is C(HI) (rather than exceeds C(HI)).
The SMC and AMC scheduling schemes investigated in this paper both use budget enforcement by the Real-Time Operating System (RTOS) to ensure that LO-criticality tasks cannot execute for more than their LO-criticality execution time budget C(LO). With the AMC scheme, the RTOS also uses the C(LO) budget for each HI-criticality task to determine if a mode change should take place. The system moves from LO- to HI-criticality mode if this budget is reached without the job completing. Once HI-criticality mode is entered, then with AMC, any jobs of LO-criticality tasks that have already started can continue to execute; however, no further jobs of LO-criticality tasks can be released. (This simple extension to the original AMC scheme, which called for jobs of LO-criticality tasks to be aborted on entering HI-criticality mode, is permitted by the analysis [2] and was proposed in [4] as a means of avoiding difficulties in dealing with aborted jobs). With SMC, jobs of LO-criticality tasks continue to be released in HI-criticality mode. Full details of both schemes can be found in [2] and [4].
In any processor busy period, where all jobs of
HI-criticality tasks complete without exceeding their
LO-criticality budgets, the system is said to be in
LO-criticality mode; otherwise it is said to be in
HI-criticality mode. (We assume that at an idle instant when there are no jobs with outstanding execution, the system may revert back to LO-criticality mode). There are different
requirements on schedulability that apply in the different modes of the system.
We use Rito refer to the deterministic worst-case response
time (WCRT) of task τi, and Ri to refer to the probabilistic
worst-case response time (pWCRT) distribution which may be computed using pWCET values.
In LO-criticality mode, jobs of LO-criticality tasks must have a worst-case Deadline Miss Probability (DMP) that is no greater than a specified threshold H(LO) (for example
10−5). We assume these thresholds are the same value for all
LO-criticality tasks and so drop the index. Using
deterministic analysis, this requirement may be satisfied by showing that the tasks are schedulable i.e. have a worst-case
response time Ri(LO) ≤ Di, computed using execution
times of C(LO). Using the probabilistic analysis developed in this paper, the requirement may be satisfied directly by determining the worst-case deadline miss probability. This is achieved by computing a probabilistic worst-case response time distribution (pWCRT) and determining the value of the 1-CDF (Cumulative Distribution Function) at a response time
corresponding to the task’s deadline Di, thus computing the
probability of missing the deadline.
Jobs of HI-criticality tasks must have a worst-case deadline miss probability that is no greater than a specified
threshold H(HI) (for example 10−9). This requirement
applies to all modes, and may be met via deterministic methods or via calculating the appropriate probabilistic worst-case response time distribution and comparing it with the task’s deadline. In both cases, due account needs to be taken of interference from LO-criticality tasks. In addition, we note that jobs of LO-criticality tasks may fail to meet their timing requirements by not completing by their execution time budget C(LO). The probability of this happening depends upon the budget set and may be read from the pWCET distribution for the task. It is the same irrespective of whether we use deterministic or probabilistic analysis. (The high assurance RTOS is assumed to enforce this budget at runtime).
Finally we note a subtle but important point about using pWCET distributions and probabilistic analysis, which does not occur with deterministic analysis. This point rests on the fact that when we analyse LO-criticality behaviour, we can use low assurance information e.g. C(LO) WCET estimates, pWCET distributions for LO-criticality tasks etc. However, when we analyse HI-criticality behaviour, we must be sure to
use only high assurance information e.g. pWCET
distributions for HI-criticality tasks, and rely on the high assurance RTOS to enforce C(LO) budgets for LO-criticality tasks. We return to this point in Section IV-A.
III. RECAP OFEXISTINGPROBABILISTIC
SCHEDULABILITYANALYSIS
In this section, we recapitulate the probabilistic response time analysis for FPPS originally derived in [11] for tasks
with both worst-case execution times and minimum
inter-arrival times described by random variables. Since in this paper the minimum inter-arrival time for each task is a constant, we present only a simplified version of this analysis. First we recap the basic terminology and operators used.
We distinguish between full distributions and partial distributions. A full distribution Z has probabilities which sum to 1. Such a distribution may be split into two (or more)
partial distributions X and Y such that ∀v
Z = X ⊕ Y where ⊕ is the coalescence of the two distributions via the addition of the probabilities for each
value. In contrast, the sum Z of two independent
distributions X and Y is given by their convolution X ⊗ Y
where P {Z = z} =Pk=+∞
k=−∞P {X = k}P {Y = z − k}.
In [11], Maxim and Cucu-Grosjean showed that
considering all valid patterns of job releases, the worst-case
response time distribution of a job of task τi occurs for the
first job of τi released simultaneously with jobs of all higher
priority tasks, which are then re-released as soon as possible. We can therefore compute an upper bound on the pWCRT
distribution Ri of task τi as follows.
The worst-case response time distribution for task τiis first
initialized to:
R0
i = Bi⊗ Ci (1)
where the backlog Bi at the release of τi is given by:
Bi =
O
j∈hp(i)
Cj (2)
The worst-case response time is then updated iteratively for each preemption as follows:
Rmi = (R m−1,head i ⊕ (R m−1,tail i ⊗ C pr k )) (3)
Here, m is the index of the iteration. Rm−1,headi is the part
of the distribution Rm−1i that is not affected by the
preemption under consideration (i.e. it only contains values
≤ tm where tm is the time of the preemption). Rm−1,taili is
the remaining part of the distribution Rm−1i that may be
affected by the preemption. Finally, Ckpr is the pWCET
distribution of the preempting task τk.
Iteration ends when there are no releases left from jobs of higher priority tasks at time instants smaller than the largest value in the response time distribution currently obtained. Iteration may also be terminated once any new preemptions are beyond the deadline of the task. Once iteration is complete, the worst-case Deadline Miss Probability valid for
any job of task τi is given by:
DM Pi= P (Ri> Di). (4)
IV. PROBABILISTICMIXEDCRITICALITY
SCHEDULABILITYANALYSIS
In this section, we introduce probabilistic response time analysis for the SMC and AMC scheduling schemes, referred to as pSMC and pAMC analysis respectively.
A. pWCET Distributions Used
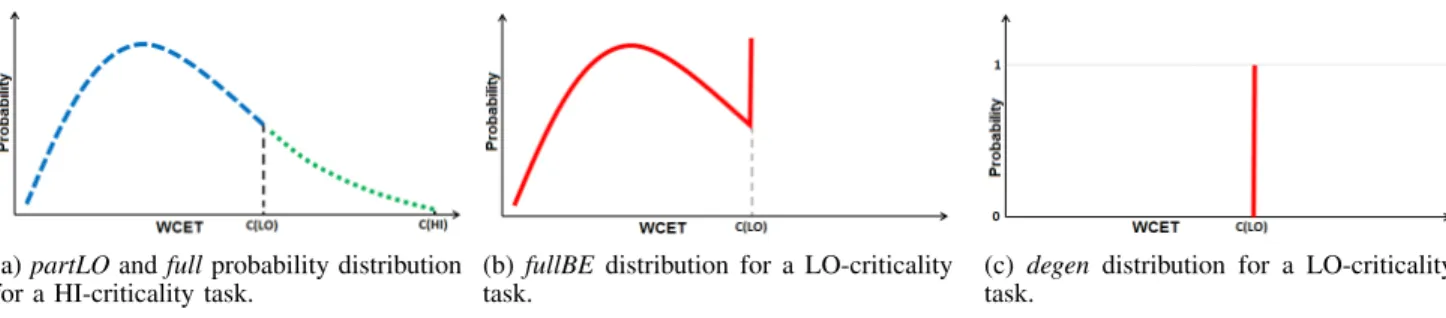
In our analysis, we make use of different types of pWCET distribution which we now describe. We use the term partLO to denote a partial distribution X formed from the full pWCET distribution Z of a task by taking only those values that represent completion of the task in no more than its budgeted LO-criticality execution time C(LO). Thus X is such that ∀v ≤ C(LO) P (X = v) = P (Z = v) and ∀v > C(LO) P (X = v) = 0.
As discussed in Section II, we assume that the value C(HI) is the final and therefore largest value in the pWCET distribution for a HI-criticality task. Figure 2a illustrates both f ull and partLO distributions for a HI-criticality task. (Note the shape of these distributions is for illustration purposes only. No specific distribution is assumed by the analysis).
In the case of a LO-criticality task, we are also interested in the partLO distribution, since this describes the behaviour expected of it by the system designer. In addition, with both
the SMC and AMC schemes, if a job of such a task executes for its execution time budget C(LO) without signaling completion, then the job will be aborted as a result of budget enforcement by the RTOS. We need to also take this behaviour into account when computing the interference on other tasks of lower priority. Thus we form a further partial distribution for each LO-criticality task denoted by partBE (meaning budget exceeded). This distribution Y has a single value of C(LO) with a probability which equates to the sum of the probabilities for all larger values from the full distribution, i.e. P (Y = C(LO)) = P (Z > C(LO)). Note that X ⊕ Y forms the full distribution that we use for a LO-criticality task. This is illustrated in Figure 2b. We refer to this distribution as fullBE (the full distribution accounting for budget exceedance).
When we analyse the HI-criticality mode (e.g. computing the pWCRT distribution for a HI-criticality task), then we cannot trust the full pWCET distributions obtained for LO-criticality tasks. The reason for this is that LO-criticality tasks are not developed to the same rigourous standards as HI-criticality tasks. Thus, in the analysis we provide for the HI-criticality mode, we must not make any assumptions about their correct behaviour. Instead, we assume the worst; that such tasks may enter an infinite loop, and be aborted at their C(LO) budget by the RTOS, which is itself a trusted
component developed to the standards required for
HI-criticality operation. When we are analysing HI-criticality mode, we therefore assume that LO-criticality tasks have a
degen (meaning full degenerate) distribution which has a
single value C(LO) with probability 1 (see Figure 2c).
pWCRT distributions are composed from pWCET
distributions using the analysis described in Section III. When partial pWCET distributions are used (for example representing LO-criticality mode only), then the resultant pWCRT distribution is also a partial distribution, giving probabilities that are conditional on being in that mode.
When analysing the Deadline Miss Probability for LO-criticality tasks, we use the partLO distributions, since we are only interested in the probability that tasks exceed their deadlines and the system remains in LO-criticality mode, i.e. no C(LO) budgets are exceed. The component of a full pWCRT distribution that is lost represents only those scenarios where the system enters HI-criticality mode, and hence where there is no requirement for LO-criticality tasks to meet their deadlines.
We note that a partial distribution Y describing the behaviour in HI-criticality mode can be obtained from a full distribution Z describing the behaviour in all modes, by
subtracting the partial distribution X describing the
behaviour in LO-criticality mode. By subtraction we mean the subtraction of probabilities for the corresponding values, ∀v P (Y = v) = P (Z = v) − P (X = v), i.e. the counterpart of coalescence. We write this as Y = Z X . Here, Y is well defined provided that X is a partial distribution of Z. This is the case in all uses of the operator in this paper, since Z
is composed from full distributions and X from
corresponding partial distributions for the same tasks. As a building block for the analysis in the following
sections, we use a function pRTA(τk, δ, δLO, δHI, t)
defined as follows.
Definition 1: pRTA(τk, δ, δLO, δHI, t) is a function
which returns a (full or partial) pWCRT distribution for task
τk computed using the analysis described in Section III. This
analysis starts from an initial distribution of type δ for task
(a) partLO and full probability distribution for a HI-criticality task.
(b) fullBE distribution for a LO-criticality task.
(c) degen distribution for a LO-criticality task.
Fig. 2: Illustrations of the full and partial distributions used in probabilistic analysis. for preempting (i.e. higher priority) LO-criticality and
HI-criticality tasks respectively. Further, jobs of higher
priority LO-criticality tasks are only included in the
computation of the pWCRT distribution if their release times are no later than time t. The parameters δ, δLO, and δHI may take values partLo, fullBE, degen, and full when the function is used.
B. pSMC Analysis
Recall that with the SMC scheme, LO-criticality tasks may execute in HI-criticality mode. The only constraint on their execution being budget enforcement. We note that for a LO-criticality task, there are three possibilities:
(i) The task overruns its budget, the probability for this case is given by the partBE distribution for the task; (ii) The task does not overrun its budget and the system
operates in LO-criticality mode;
(iii) The task does not overrun its budget and the system operates in HI-criticality mode.
The partial pWCRT distributions for cases (ii) and (iii) are derived below. For a HI-criticality task, we assume that there can be no overrun of the C(HI) budget, and thus C(HI) is effectively the maximum value in the pWCET distribution. Thus there are just two cases to consider, equivalent to (ii) and (iii) above. The partial pWCRT distributions for those cases are also derived below.
1) LO-criticality mode: We determine schedulability in
LO-criticality mode using the partLO distribution for the task
of interest τk, and the f ullBE distribution for higher
priority, LO-criticality tasks, since they may overrun their budgets, but there is no behaviour of these tasks that can cause HI-criticality mode to be entered. Finally, we need only consider the partLO distribution for HI-criticality tasks, as the remaining part of the full distribution for these tasks implies that the system enters HI-criticality mode, hence:
Rk(LO) = pRTA(τk, partLO, f ullBE, partLO, ∞) (5)
Equation (5) applies to both LO- and HI-criticality tasks. In each case it provides the partial pWCRT distribution for task
τk conditional on the system operating in LO-criticality mode
and the task not exceeding its own budget.
2) HI-criticality mode: When analysing a HI-criticality
task τk executing in HI-criticality mode, we can no longer
trust the behaviour of LO-criticality tasks. Thus we must use degenerate distributions equating to the execution time budget C(LO) for higher priority, LO-criticality tasks.
First, we compute the pWCRT distribution for both modes. Here, we begin with the full distribution for HI-criticality task
τk and similarly include the full distribution for preempting
higher priority, HI-criticality tasks.
Zk = pRTA(τk, f ull, degen, f ull, ∞) (6)
Then we determine the partial pWCRT distribution for LO-criticality mode:
Xk = pRTA(τk, partLO, degen, partLO, ∞) (7)
Finally, we obtain the partial pWCRT distribution for HI-criticality mode as a simple subtraction:
Rk(HI) = Zk Xk (8)
Equation (8) upper bounds the pWCRT distribution for a
HI-criticality task τk conditional on the system operating in
HI-criticality mode. C. pAMC Analysis
The AMC and SMC schemes have identical behaviour in LO-criticality mode, hence the analysis given in Section IV-B also provides pAMC analysis for both LO- and HI-criticality tasks in LO-criticality mode. That leaves pAMC analysis of HI-criticality tasks in HI-criticality mode.
Again, we first compute the pWCRT distribution for both HI- and LO-criticality modes. Here, we begin with the full
distribution for task τk and similarly include the full
distribution for preempting higher priority, HI-criticality tasks. As this analysis is for HI-criticality mode, we assume that the behaviour of LO-criticality tasks cannot be trusted and therefore make use of the degen distributions for those tasks.
Zk = pRTA(τk, f ull, degen, f ull, R(LO)) (9)
Then we determine the partial pWCRT distribution for LO-criticality mode:
Xk= pRTA(τk, partLO, degen, partLO, R(LO)) (10)
Note, in (10) for symmetry and obvious compatibility with (9) we limit the jobs of higher priority LO-criticality tasks to those released by time R(LO) given by the deterministic analysis for AMC [2]; however, since R(LO) is effectively
computed using the maximum values in the degen
distributions for LO-criticality tasks and partLO
distributions for HI-criticality tasks, then in practice this does
not restrict the distribution Xk in any way. Note that if
R(LO) cannot be obtained by deterministic analysis i.e. the task is unschedulable and R(LO) > T then R(LO) may be assumed to be infinite and the pAMC analysis reduces to the pSMC analysis. Finally, we obtain the partial pWCRT distribution for HI-criticality mode as a simple subtraction:
Rk(HI) = Zk Xk (11)
Equation (11) upper bounds the pWCRT distribution for a
HI-criticality task τk conditional on the system operating in
HI-criticality mode. Together with (5), this completes the analysis for pAM C.
Comparing (9) and (10) with (6) and (7), it is easy to see
that the pAMC analysis dominates pSMC. The only
difference is the discounting of LO-criticality preemptions after time R(LO) in the case of pAMC. Thus all task sets
that are deemed schedulable2 by pSMC analysis are also
schedulable according to the pAMC analysis. Further, we note that the pAMC analysis dominates deterministic analysis
for AMC, and similarly, pSMC analysis dominates
deterministic analysis for SMC. This can be seen by
considering the distributions used in the probabilistic
analyses. These distributions and the resulting pWCRT distributions satisfy the limit condition [11]. The maximum values in each input distribution are the same as the values used in the corresponding deterministic analysis, thus the maximum value in the output pWCRT distributions are the same as the deterministic WCRTs.
D. Probabilistic schedulability
For a LO-criticality task to meet its schedulability requirements, then its execution time must not exceed its C(LO) budget with more than a specified probability. This is guaranteed, as with deterministic analysis, by setting its execution time budget no lower than C(LO). Secondly, its pWCRT distribution conditional on not exceeding its budget and that the system remains in LO-criticality mode must give a worst-case Deadline Miss Probability that does not exceed
the specified threshold, i.e. P (Rk(LO) > Dk) ≤ H(LO).
This can be determined for both pSMC and pAMC using (5). For a HI-criticality task to meet its schedulability requirements, then execution of no more than C(HI) is assumed to be assured. Further, its pWCRT distribution (valid for both modes combined) must give a worst-case Deadline Miss Probability that does not exceed the specified
threshold i.e. P (Rk > Dk) ≤ H(HI), where
Rk = Rk(LO) ⊕ Rk(HI). This can be determined for
pSMC using (5) and (8), and for pAMC using (5) and (11). V. EVALUATION
In this section, we present an empirical investigation, examining the effectiveness of the probabilistic analysis techniques (pSMC and pAMC) introduced in this paper, in particular examining the performance improvements that can be obtained with respect to the corresponding deterministic analyses.
A. Task set parameter generation
The task set parameters used in our experiment were randomly generated as follows:
• Task utilisations (Ui = Ci/Ti) (for LO-criticality mode)
were generated using the UUnifast algorithm [5], giving an unbiased distribution of values.
• Task periods were generated according to a log-uniform distribution from 10ms to 1000ms.
• The LO-criticality execution time of each task was set
based on the utilisation and period: Ci(LO) = UiTi.
• The HI-criticality execution time of each task was a fixed
multiplier of the LO-criticality execution time, Ci(HI) =
CF · Ci(LO) (default CF = 1.5), where CF is called
the Criticality Factor.
• The probability that a generated task was a HI-criticality task was given by the parameter CP (default CP = 0.5). • Task deadlines were constrained, chosen from a uniform
distribution in the range [CF.C(LO), T ].
2Recall that by schedulable we mean that LO-criticality tasks must not
exceed their DMP threshold in LO-criticality mode, and HI-criticality tasks must not exceed their DMP threshold in either mode.
Fig. 3: Example of possible pWCET distributions. • Task priorities were set in deadline monotonic order.
We generated the pWCET distribution for each task via extrapolation from the C(LO) and C(HI) parameter values. We assumed that the probability of exceeding C(LO) is
p(LO) = 10−5, and that the probability of executing for, but
not exceeding C(HI) is p(HI) = 10−9. To determine
intermediate points, we assumed that the pWCET
distributions have an exponential tail (as is the case with a Gumbel distribution). Thus we assumed that the 1-CDF of the pWCET was a straight line on an exceedance graph with probabilities given on a log scale, as depicted in Figure 3.
The Thresholds H(LO) and H(HI) on the maximum
acceptable deadline miss probabilities for LO- and
HI-criticality tasks were set to 10−5 and 10−9 respectively.
B. Schedulability tests
We investigated the performance of the following
techniques and associated schedulability tests.
• pSMC: Probabilistic SMC analysis (Section IV-B). • pAMC: Probabilistic AMC analysis (Section IV-C). • dSMC: Deterministic SMC analysis [2].
• dAMC: Deterministic AMC analysis [2].
• dUB: Task sets pass this ‘test’ if they are schedulable according to deterministic analysis of FPPS in each of the individual LO-criticality and HI-criticality modes with priorities in deadline monotonic order. This is a necessary test for any fixed priority preemptive mixed criticality scheduling algorithm [2].
• pUB: Task sets pass this ‘test’ if they are schedulable according to probabilistic analysis of FPPS in each of the individual LO-criticality and HI-criticality modes with priorities in deadline monotonic order.
The dominance relationships between the algorithms and tests implies a strict ordering to the lines on the graph: pUB dominates pAMC which dominates pSMC. Similarly dUB dominates dAMC which dominates dSMC. Further pUB dominates dUB, pAMC dominates dAMC, and pSMC dominates dSMC. The purpose of the experiment is to examine the relative performance of the different schemes.
In our experiment, the LO-criticality utilisation was varied from 0.05 to 1. For each utilisation value, 1000 task sets were generated and the schedulability of those task sets determined for the different schemes.
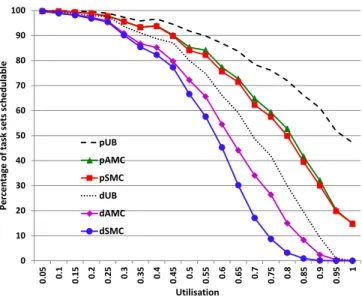
Figure 4 plots the percentage of task sets generated that were deemed schedulable for a system of 10 tasks, with on average 50% of those tasks having HI-criticality (CP = 0.5) and each task having a HI-criticality execution time that is 1.5 times its LO-criticality execution time (CF = 1.5). The utilisation values (x-axis) are computed using the C(LO) values and periods for each task.
0 10 20 30 40 50 60 70 80 90 100 0.0 5 0.1 0.15 0.2 0.25 0.3 0.35 0.4 0.45 0.5 50.5 0.6 0.65 0.7 0.75 0.8 0.85 0.9 0.95 1 Pe rc en ta ge o f t ask se ts sc he du la bl e Utilisation pUB pAMC pSMC dUB dAMC dSMC
Fig. 4: Percentage of task sets deemed schedulable according to the four tests: dSMC, dAMC, pSMC and pAMC.
Figure 4 shows that the probabilistic analysis (pAMC and
pSMC) provides substantially improved performance
compared to deterministic analysis (dAMC and dSMC), with many more task sets deemed schedulable. This is because the probabilistic analysis is able to account for the full extent of the pWCET distributions, and thus the very small probability that multiple jobs take long execution times leading to a very long response time. We note that pAMC and pSMC may deem some tasks sets with LO-criticality utilisation greater than 1 schedulable. This is correct, and is a reflection of the shape of the pWCET distributions (see Figure 3). Recall that
C(LO) has a probability of exceedance of 10−5 thus once
the distributions for a number of tasks are convolved, the probability that all of them execute for C(LO) or more becomes very small. Further, we note that the results for pSMC and pAMC converge at a very high values of LO-criticality utilisation. This is because finite values for R(LO) can no longer be computed via deterministic analysis. We note that using the deterministic R(LO) value in pAMC leads to only a small improvement over pSMC. In future, we will investigate whether an improved pAMC analysis can be obtained by making use of the probabilistic R(LO) distribution.
VI. CONCLUSIONS
In this paper we introduced probabilistic analysis for fixed priority preemptive scheduling of mixed criticality systems under the SMC [3] and AMC schemes [2]. This analysis makes use of probabilistic worst-case execution time (pWCET) distributions to compute probabilistic worst-case response time distributions (pWCRT) and thus the worst-case deadline miss probability (DMP) for each task under SMC and AMC. Provided that the DMP is below the appropriate
threshold3 for that task, then it is declared schedulable.
The main contributions of this paper are as follows: • Introducing probabilistic analysis of mixed criticality
systems based on a richer mixed criticality model using pWCET distributions.
• Deriving probabilistic worst-case response time analysis for both LO- and HI-criticality tasks under the SMC and
3Derived from acceptable failure rates for tasks of that criticality.
AMC schemes.
• Showing via an experimental evaluation that the probabilistic analyses, pSMC and pAMC, substantially out-perform their deterministic counterparts. This is due to the fact that low-probability unfavorable events such
as all HI-criticality jobs simultaneously requiring
additional execution time can be soundly ignored. In future, we intend to explore whether the probabilistic analysis framework can provide improved support for LO-criticality tasks based on the observation that the LO-criticality WCET estimates used in the deterministic representation are in reality tunable execution time budgets at different levels of assurance. We expect that the more effective probabilistic analysis will enable these budgets to be increased for both LO- and HI-criticality tasks, thus reducing the chance that HI-criticality mode is entered and lowering the likelihood that LO-criticality jobs have to be dropped or aborted.
Acknowledgements
The research described in this paper was partially funded by EU FP7 Integrated Project PROXIMA, the FR BGLE funded Departs project, the FR LEOC Capacites project, the FR FUI Waruna project, the ESPRC grant, MCC (EP/K011626/1), the Inria International Chair program, and the Ministry of Education Tier-2 grant, ARCS9/14. EPSRC Research Data Management: No new primary data was created during this study.
REFERENCES
[1] S. Altmeyer, L. Cucu-Grosjean, and R.I. Davis. Static probabilistic timing analysis for real-time systems using random replacement caches. Springer Real-Time Systems, 51(1):77–123, 2015.
[2] S. Baruah, A. Burns, and R.I. Davis. Response-Time Analysis for Mixed Criticality Systems. In Proceedings of the IEEE Real-Time Systems Symposium (RTSS), pages 34–43, 2011.
[3] S. Baruah and S. Vestal. Schedulability Analysis of Sporadic Tasks with Multiple Criticality Specifications. In Proceedings of the Euromicro Conference on Real-Time Systems (ECRTS), pages 147–155, 2008. [4] I. Bate, A. Burns, and R.I. Davis. A bailout protocol for
mixed-criticality systems. In Proceedings of the Euromicro Conference on Real-Time Systems (ECRTS), 2015.
[5] E. Bini and G.C. Buttazzo. Measuring the performance of schedulability tests. Journal of Real-Time Systems, 30(1-2):129–154, 2005. [6] A. Burns and R.I. Davis. Mixed criticality systems - a review. Technical
report, Department of Computer Science, University of York, 2014. [7] L. Cucu-Grosjean. Independence - a misunderstood property of and for
probabilistic real-time systems. In N. Audsley and S.K. Baruah, editors, In Real-Time Systems: the past, the present and the future, pages 29–37, 2013.
[8] L. Cucu-Grosjean, L. Santinelli, M. Houston, C. Lo, T. Vardanega, L. Kosmidis, J. Abella, E. Mezzetti, E. Quiones, and F. J. Cazorla. Measurement-based probabilistic timing analysis for multi-path programs. In Proceedings of the Euromicro Conference on Real-Time Systems (ECRTS), pages 91–101, 2012.
[9] D. Griffin, I. Bate, B. Lesage, and F. Soboczenski. Evaluating mixed criticality scheduling algorithms with realistic workloads. In Proceedings of the Workshop on Mixed Criticality Systems (WMC), 2015.
[10] Z. Guo, L. Santinalli, and K. Yang. Edf schedulability analysis on mixed-criticality systems with permitted failure probability. In Proceedings of the IEEE International Conference on Embedded and Real-Time Computing Systems and Applications (RTCSA), 2015. [11] D. Maxim and L. Cucu-Grosjean. Response time analysis for
fixed-priority tasks with multiple probabilistic parameters. In Proceedings of the IEEE Real-Time Systems Symposium (RTSS), pages 224–235, 2013. [12] L. Santinelli and L. George. Probabilities and mixed-criticalities: the probabilistic c-space. In Proceedings of the Workshop on Mixed Criticality Systems (WMC), 2015.
[13] S. Vestal. Preemptive Scheduling of Multi-criticality Systems with Varying Degrees of Execution Time Assurance. In Proceedings of the IEEE Real-Time Systems Symposium (RTSS), 2007.