Effects of iron supplementation on dominant bacterial groups in the gut,
faecal SCFA and gut inflammation: a randomised, placebo-controlled
intervention trial in South African children
Alexandra Dostal
1†, Jeannine Baumgartner
2,3†, Nathalie Riesen
1, Christophe Chassard
1,
Cornelius M. Smuts
3, Michael B. Zimmermann
2and Christophe Lacroix
1*
1Laboratory of Food Biotechnology, Institute of Food, Nutrition and Health, ETH Zurich, Schmelzbergstrasse 7, 8092 Zurich, Switzerland
2Laboratory of Human Nutrition, Institute of Food, Nutrition and Health, ETH Zurich, Schmelzbergstrasse 7, 8092 Zurich, Switzerland
3Centre of Excellence for Nutrition, North-West University, Potchefstroom Campus, South Africa
(Submitted 5 December 2013 – Final revision received 26 March 2014 – Accepted 14 April 2014 – First published online 11 June 2014)
Abstract
Fe supplementation is a common strategy to correct Fe-deficiency anaemia in children; however, it may modify the gut microbiota and increase the risk for enteropathogenic infection. In the present study, we studied the impact of Fe supplementation on the abundance of dominant bacterial groups in the gut, faecal SCFA concentration and gut inflammation in children living in rural South Africa. In a randomised, placebo-controlled intervention trial of 38 weeks, 6- to 11-year-old children with Fe deficiency received orally either tablets containing 50 mg Fe as FeSO4(n 22) for 4 d/week or identical placebo (n 27). In addition, Fe-sufficient children (n 24) were included as
a non-treated reference group. Faecal samples were analysed at baseline and at 2, 12 and 38 weeks to determine the effects of Fe supplementation on ten bacterial groups in the gut (quantitative PCR), faecal SCFA concentration (HPLC) and gut inflammation (faecal calprotectin concentration). At baseline, concentrations of bacterial groups in the gut, faecal SCFA and faecal calprotectin did not differ between Fe-deficient and Fe-sufficient children. Fe supplementation significantly improved Fe status in Fe-deficient children and did not significantly increase faecal calprotectin concentration. Moreover, no significant effect of Fe treatment or time£ treatment interaction on the concentrations of bacterial groups in the gut or faecal SCFA was observed compared with the placebo treatment. Also, there were no significant differences observed in the concentrations of any of the bacterial target groups or faecal SCFA at 2, 12 or 38 weeks between the three groups of children when correcting for baseline values. The present study suggests that in African children with a low enteropathogen burden, Fe status and dietary Fe supplementation did not significantly affect the dominant bacterial groups in the gut, faecal SCFA concentration or gut inflammation.
Key words:Iron supplementation: Iron deficiency: Gut microbiota: Children
Fe deficiency affects more than 2 billion people worldwide, and children, because they require high amounts of Fe for growth and development, are among the most vulnerable(1). Fe deficiency can lead to Fe-deficiency anaemia and impair school performance and cognitive development in children(2,3). Thus, adequate dietary Fe availability for school-aged children is critical. In the past, the WHO rec-ommended that children living in the regions with a high prevalence of Fe deficiency receive oral supplementation of Fe as FeSO4( 1,4,5). This recommendation has been modified in recent years because of concerns that Fe supplementation may increase the risk for hospitalisations and mortality from infections(6 – 9).
Supplemental Fe is poorly absorbed in the human gastroin-testinal tract and most of the dose passes into the colon where it becomes available for the gut microbiota. The symbiotic bacteria in the gut provide the host with many beneficial functions, such as colonisation resistance from pathogens, immunomodulatory properties and degradation of indigestible compounds, while producing bacterial metabolites, such as SCFA, influencing host health and providing additional energy to host cells(10,11). There are alterations in the com-position of the gut microbiota in malnourished children in developing countries, and it has been proposed that the microbiota may contribute to the effects of nutritional deficiencies in these settings(12 – 16). Several animal studies
† Both authors contributed equally to this work.
* Corresponding author: C. Lacroix, fax þ 41 44 632 14 03, email christophe.lacroix@hest.ethz.ch
Abbreviations: CRP, C-reactive protein; qPCR, quantitative PCR; SF, serum ferritin; TfR, serum transferrin receptor; ZnPP, zinc protoporphyrin. qThe Authors 2014
British
Journal
of
have suggested that host Fe status and dietary Fe availability can influence the microbial ecosystem of the gut(17 – 22), and that most bacteria in the gut have a requirement for Fe(23).
However, the impact of Fe status and dietary Fe availability on the gut microbiota in humans is uncertain. A recent study in India has reported decreased numbers of lactobacilli in women with Fe-deficiency anaemia(24). Furthermore, two studies in infants(25,26) and one randomised placebo-controlled trial in Ivorian school children living in a rural area with a high prevalence of environmental pathogens(9) have reported changes in the composition of the gut micro-biota after Fe fortification. It has also been shown that the growth and infectivity of several enteropathogens can be pro-moted by Fe supplementation in vitro(27) and also in hosts with Fe overload(28). Both a dysbiosis of the gut microbiota, and hence a reduced barrier effect and colonisation resistance against pathogens(29), and enhanced pathogen growth due to high-dose Fe supplementation could increase the risk for the development of diarrhoea. Indeed, a systematic review and a recent study in young children in Pakistan have found that Fe supplementation may increase the incidence of diarrhoea in children, especially in areas with a high prevalence of enteric pathogens(6,30). Moreover, an increase in infection with other pathogens due to Fe supplementation could have an impact on the inflammatory preset of the host, which in turn might alter the composition of the gut microbiota and facilitate colonisation with enteropathogenic bacteria(8,29,31).
Based on these previous studies and observations, our hypothesis was that high-dose Fe supplementation and also host Fe status can affect the dominant commensal bacterial groups in the gut, their main metabolites and gut inflam-mation. This may lead to a potential dysbiosis of the gut microbiota with less protection against the establishment of environmental bacteria, such as enteropathogens, and a change in the degradation of dietary compounds. To test this hypothesis, we investigated the impact of oral
supplementation of Fe as FeSO4 over a time period of 38 weeks on the concentrations of dominant bacterial groups in the gut, faecal SCFA and faecal calprotectin, a gut inflammation marker, in Fe-deficient school children living in rural South Africa compared with a placebo treatment without FeSO4 over the same time period. We also included non-treated Fe-sufficient children to investigate whether the abundance of dominant bacterial groups, faecal SCFA concen-tration and faecal calprotectin concenconcen-tration differs between Fe-sufficient and Fe-deficient children.
Subjects and methods Study design
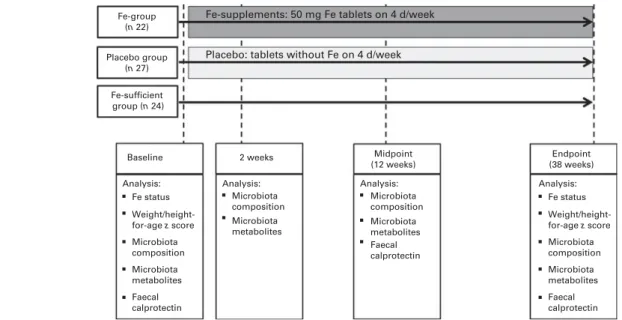
Participants included in the present study were 6- to 11-year-old children (n 73) from two primary schools that serve low-income rural villages in the Province of KwaZulu-Natal in eastern South Africa (Fig. 1). A total of two groups of chil-dren were randomly selected from two arms of a 2£ 2 study design assessing the effects of Fe and n-3 fatty acid sup-plementation, alone and in combination, on cognition in school children, as reported previously(3). One group received Fe supplements (Fe group, n 22) and another group received placebo (placebo group, n 27). As described previously, these children lived in a malaria-free region and fulfilled the following inclusion criteria: (1) 6 to 11 years of age; (2) Hb concentration . 80 g/l; (3) Fe deficient (serum ferritin (SF) concentration , 20 mg/l or zinc protoporphyrin (ZnPP) con-centration . 70 mmol/mol haem or serum transferrin receptor (TfR) concentration . 8·3 mg/l); (4) no chronic disease; (5) not using Fe supplements(3).
Children in the Fe group were given orally one tablet con-taining 50 mg Fe as FeSO4 (Lomapharm; Paul Lohmann GmbH) together with a fruit-flavoured and vitamin C-enriched (approximately 10 mg/serving) beverage (200 ml) for 4 d/week,
Fe-group (n 22) Placebo group (n 27) Fe-sufficient group (n 24) Baseline
Analysis: Analysis: Analysis: Analysis: Fe status Weight/height-for-age z score Microbiota composition Microbiota metabolites Microbiota composition Microbiota metabolites Faecal calprotectin Microbiota composition Microbiota metabolites Faecal calprotectin 2 weeks
Fe-supplements: 50 mg Fe tablets on 4 d/week
Placebo: tablets without Fe on 4 d/week
Midpoint (12 weeks) Endpoint (38 weeks) Fe status Weight/height-for-age z score Microbiota composition Microbiota metabolites Faecal calprotectin
Fig. 1. Summary of the study design with interventions in the placebo and iron groups as well as the different sampling time points and the corresponding analysis.
British
Journal
of
while those in the placebo group received an identical tablet without Fe and the beverage(3). Trained fieldworkers (one fieldworker per group and school) directly supervised the tablet consumption and recorded compliance and self-reported illness symptoms while absent and present. Children in the placebo and Fe groups were dewormed with an oral dose of 400 mg mebendazole (Be-Tabs Pharmaceuticals (Pyt) Limited) 3 and 15 weeks after the start of the intervention trial. A third group of children (Fe-sufficient group, n 24) with highest SF concentrations (without inflammation, C-reactive protein (CRP) concentration , 5 mg/l) and thereafter lowest TfR and ZnPP concentrations was randomly selected out of 100 children from the same two schools; they participated in the baseline screening, but were not included in the interven-tion trial due to adequate Fe status. We enrolled this third group as a reference group to compare the composition of the gut microbiota between Fe-deficient and Fe-sufficient children at baseline and to follow the changes in the gut microbiota over time without the intervention.
In a previous study in Ivorian school children, a sample size of thirty children per group was adequate to detect significant differences in the major bacterial groups in the gut microbiota after Fe fortification of 10 mg Fe/d(9). Since in the present study, a much higher Fe dose (50 mg Fe, 4 d/week) was pro-vided via oral supplementation, we estimated that a sample size between twenty and thirty children per group would be adequate to detect the differences between Fe supplemen-tation and placebo treatment.
Trained local fieldworkers conducted two 24 h dietary recalls 2 weeks apart on different days of the week. The 24 h dietary recalls were administered to the parents/carers of sixty children per participating school in their local language (Zulu). One recall per child was conducted for a week day and one recall was conducted for a weekend day. Dietary data were analysed with the Food Finder computer program (Medical Research Council, 2003). Anthropometric measurements were taken at baseline and endpoint, as described previously(3). Age- and sex-specific height-for-age z scores, weight-for-age z scores and BMI-for-age z scores were calculated using the 2007 WHO growth standards for children aged 5 to 19 years with the software WHO Anthro Plus for personal computers (version 1.0.3, WHO, 2010). Weight-for-age z scores were available only for children ,11 years of age. The present study was performed from Feb-ruary to November 2010 and was interrupted by holidays for 2 weeks in March and April, for 5 weeks in June and July, and for 1 week in September. Supplementation was further interrupted for 4·5 weeks by a national strike of teachers in August and September. To catch up on the unexpected loss of intervention days, supplementation was increased from 4 to 5 d/week for 8 weeks, which compensated for 2 weeks of supplementation. Thus, in total, supplements were provided for 105 d over a period of 38 weeks. The present study was conducted according to the guidelines laid down in the Declaration of Helsinki, and all procedures including human subjects were approved by the ethics committees of the North-West University in South Africa and by the Swiss Federal Institute of Technology Zu¨rich in Switzerland. Written
informed consent was obtained from parents, and verbal consent of children was witnessed and formally recorded. The present trial was registered at ClinicalTrials.gov as NCT01092377.
Sample collection and blood sample analysis
Faecal samples were collected from 09.00 to 12.00 hours at four time points throughout the study: at baseline just before the start of the intervention, and at 2 weeks, 12 weeks (midpoint) and 38 weeks (endpoint) of Fe supplementation (Fig. 1). Faecal sample collection was specifically optimised to avoid bacterial cell death by oxygen or bacterial growth due to the lack of a constant low temperature before freezing. The samples were collected immediately after defecation in zip-lock bags containing an Anaerocult A mini bag (Merck Millipore) to maintain anaerobiosis. Samples were kept at 48C and within 6 h, aliquots were made in several 2 ml Eppendorf tubes and frozen at 2 808C until further analysis.
Blood samples were collected at baseline and endpoint, as described previously(3). Briefly, venous blood samples (10 ml) were drawn into EDTA-coated and trace-element free tubes (Becton Dickinson) at baseline and endpoint. Hb con-centrations were measured on site in the whole blood by the direct cyanmethaemoglobin method (Ames Mini-Pak Hb test pack and Ames Minilab; Bio-Rad Laboratories (PTY) Limited) with Drabkin’s solution and a standard miniphotometer. The remaining samples were centrifuged at 500 g for 15 min at room temperature, and plasma and serum aliquots were pre-pared and stored at 2 208C for the duration of the fieldwork (4 d) and then at 2 808C until analysis. Erythrocytes were washed twice with 0·15M-NaCl and centrifuged at 500 g for 10 min to remove the buffy coat. ZnPP was determined on site on washed erythrocytes, as described previously(3). SF, CRP and TfR concentrations were measured in serum, as described previously(3). Fe deficiency during the intervention was defined as a SF concentration , 15 mg/l(32)or a ZnPP con-centration . 70 mmol/mol haem(33) or a TfR concentration .8·3 mg/l (test kit reference value), and anaemia was defined as a Hb concentration , 115 g/l(4). For the reporting of pre-valence and statistical analyses, a SF concentration , 15 mg/l was used to define Fe deficiency; for inclusion into the study, an SF concentration , 20 mg/l was used. Systemic inflammation was defined as a CRP concentration . 5 mg/l.
Faecal sample DNA extraction and enumeration of bacterial groups
Faecal samples were thawed on ice and total genomic DNA was extracted using the FastDNA SPIN kit for soil (MP Biomedicals), according to the manufacturer’s instructions. Bacterial groups prevalent in the gut were enumerated using specific primers for the 16S ribosomal RNA gene or a func-tional gene (Table 1) by quantitative PCR (qPCR) analysis performed with an ABI PRISM 7500-PCR sequence detection system (Life Technologies), as described previously(34,35). qPCR consisted of 2£ SYBR Green Mastermix (Life Tech-nologies) or 2£ Kapa Sybr Fast qPCR Mastermix (Biolabo
British
Journal
of
Scientifics Instruments), 0·2 mM of each primer and 1 ml of
template genomic DNA in a total volume of 25 ml. Amplifica-tion consisted of an initial denaturaAmplifica-tion step at 958C for 10 min (20 s for Kapa Sybr Fast qPCR Mastermix) followed by forty cycles of 958C for 15 s (3 s) and 608C for 1 min (30 s). A denaturation step was added to check for amplicon specificity. The samples were analysed in duplicate and stan-dard curves with the specific target 16S ribosomal RNA gene or a functional gene were included in each run, as described previously(34). Data were analysed with the 7500 Fast System Sequence Detection Software (version 1.4; Life Technologies) and expressed as the log number of 16S ribosomal RNA gene copies or functional gene copies/g faeces.
Faecal SCFA concentration analysis
SCFA concentrations were analysed in the faecal samples of a randomly selected subgroup of children (n 10 per group) by HPLC. Briefly, 200 – 300 mg faeces were homogen-ised with 1 ml of 0·15 mM-H2SO4and subsequently centrifuged at 48C and 9000 g for 20 min. The supernatants were diluted 1:1 with MilliQ water and filtered through a 0·45 mm nylon filter (Infochroma AG) before injection. HPLC (Hitachi LaChrome; Merck) was performed using a Cation-H refill cartridge (30£ 4·6 mm) connected to an Aminexw HPX-87H (300£ 7·8 mm) column at a flow rate of 0·4 ml/min at 408C and 10 mM-H2SO4 as the eluent solution. The samples were analysed in duplicate and data expressed as mmol/g faeces.
Faecal calprotectin concentration analysis
Calprotectin concentration in the faecal samples of children was measured by immunoassay (Calprest; Eurospital S.p.A), according to the manufacturer’s instructions (placebo group, n 12; Fe group, n 13; Fe-sufficient group, n 13), at baseline,
midpoint and endpoint. The samples were analysed in dupli-cate and data expressed as mg/kg faeces.
Statistical analyses
Statistical analyses were performed using IBM SPSS Statistics (version 19; IBM Company). Data were checked for normal distribution and transformed, if necessary. Outliers (^ 3SD
from the mean) were removed from the analysis. At baseline, all variables were compared between the groups using the one-way ANOVA with post hoc Bonferroni correction for multiple comparisons. At 2 weeks, midpoint and endpoint of the study, variables were compared between the groups (Fe group, placebo group and Fe-sufficient group) using ANCOVA with corresponding baseline values as covariates. Moreover, potential differences in qPCR data and HPLC data by intervention group only (Fe and placebo groups) over time were analysed using repeated-measures ANOVA, with the sampling time point as the within-subject variable and intervention group (Fe and placebo groups) as the between-subject factor. When significant changes over time were detected, repeated-measures ANOVA was performed for each variable between baseline and the subsequent time points within each group separately to detect deviations from baseline levels. qPCR data, TfR, ZnPP, SF, CRP and cal-protectin data were log transformed for statistical analyses. P, 0·05 was considered as significant.
Results
Iron status, inflammation and anthropometric measurements of the study subjects
Anthropometric measurements, Hb concentration, Fe status indices and markers of systemic (CRP) and gut (calprotectin) inflammation are shown in Table 2. At baseline, both
Table 1. Primers used to enumerate selected bacterial target groups by quantitative PCR
Primers Sequence 50– 30 Target group Reference
Eub338F 50-ACTCCTACGGGAGGCAGCAG-30 Total bacteria Guo et al.(48)
Eub518R 50-ATTACCGCGGCTGCTGG-30
Bac303F 50-GAAGGTCCCCCACATTG-30 Bacteroides spp. Ramirez-Farias et al.(49)
Bfr-Femrev 50-CGCKACTTGGCTGGTTCAG-30
Firm934F 50-GGAGYATGTGGTTTAATTCGAAGCA-30 Firmicutes Guo et al.(48)
Firm1060R 50-AGCTGACGACAACCATGCAC-30
Clep866mF 50-TTAACACAATAAGTWATCCACCTGG-30 Clostridium Cluster IV Ramirez-Farias et al.(49) Clep1240mR 50-ACCTTCCTCCGTTTTGTCAAC-30
RrecF 50-GCGGTRCGGCAAGTCTGA-30 Roseburia spp./E. rectale Furet et al.(50) Rrec630mR 50-CCTCCGACACTCTAGTMCGAC-30
Fprau223F 50-GATGGCCTCGCGTCCGATTAG-30 Faecalibacterium prausnitzii Bartosch et al.(51) Fprau420R 50-CCGAAGACCTTCTTCCTCC-30
EhalF 50-GCGTAGGTGGCAGTGCAA-30 Eubacterium hallii Ramirez-Farias et al.(49)
EhalR 50-GCACCGRAGCCTATACGG-30
dsrA_F336 50-CTGCGAATATGCCTGCTACA-30 SRB, dsrA gene Pereyra et al.(52)
dsrA_R533 50-TGGTCGARCTTGATGTCGTC-30
F_Lacto 05 50-AGCAGTAGGGAATCTTCCA-30 Lactobacillus/Pediococcus/Leuconostoc spp. Furet et al.(50) R_Lacto 04 50-CGCCACTGGTGTTCYTCCATATA-30
xfp-fw 50-ATCTTCGGACCBGAYGAGAC-30 Bifidobacteria phosphoketolase Cleusix et al.(53) xfp-rv 50-CGATVACGTGVACGAAGGAC-30
Eco1457F 50-CATTGACGTTACCCGCAGAAGAAGC-30 Enterobacteriaceae Bartosch et al.(51) Eco1652R 50-CTCTACGAGACTCAAGCTTGC-30
SRB, sulphate-reducing bacteria; dsrA, dissimilatory sulphite-reductase subunit A.
British
Journal
of
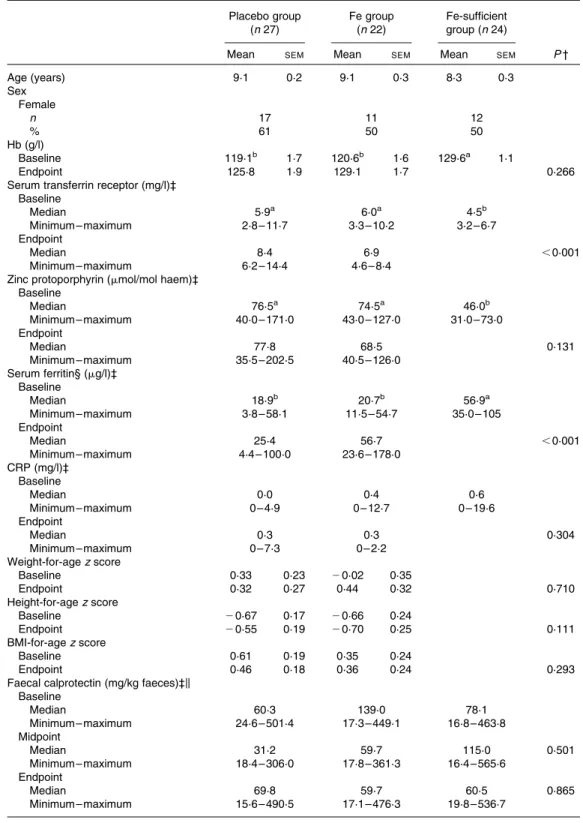
Table 2. Baseline and endpoint parameters of iron status, inflammation as well as anthropometric measurements of children included in the study*
(Mean values with their standard errors; medians and maximum and minimum values) Placebo group (n 27) Fe group (n 22) Fe-sufficient group (n 24)
Mean SEM Mean SEM Mean SEM P †
Age (years) 9·1 0·2 9·1 0·3 8·3 0·3 Sex Female n 17 11 12 % 61 50 50 Hb (g/l) Baseline 119·1b 1·7 120·6b 1·6 129·6a 1·1 Endpoint 125·8 1·9 129·1 1·7 0·266
Serum transferrin receptor (mg/l)‡ Baseline Median 5·9a 6·0a 4·5b Minimum – maximum 2·8 – 11·7 3·3 – 10·2 3·2 – 6·7 Endpoint Median 8·4 6·9 ,0·001 Minimum – maximum 6·2 – 14·4 4·6 – 8·4
Zinc protoporphyrin (mmol/mol haem)‡ Baseline Median 76·5a 74·5a 46·0b Minimum – maximum 40·0 – 171·0 43·0 – 127·0 31·0 – 73·0 Endpoint Median 77·8 68·5 0·131 Minimum – maximum 35·5 – 202·5 40·5 – 126·0 Serum ferritin§ (mg/l)‡ Baseline Median 18·9b 20·7b 56·9a Minimum – maximum 3·8 – 58·1 11·5 – 54·7 35·0 – 105 Endpoint Median 25·4 56·7 ,0·001 Minimum – maximum 4·4 – 100·0 23·6 – 178·0 CRP (mg/l)‡ Baseline Median 0·0 0·4 0·6 Minimum – maximum 0 – 4·9 0 – 12·7 0 – 19·6 Endpoint Median 0·3 0·3 0·304 Minimum – maximum 0 – 7·3 0 – 2·2 Weight-for-age z score Baseline 0·33 0·23 20·02 0·35 Endpoint 0·32 0·27 0·44 0·32 0·710 Height-for-age z score Baseline 20·67 0·17 20·66 0·24 Endpoint 20·55 0·19 20·70 0·25 0·111 BMI-for-age z score Baseline 0·61 0·19 0·35 0·24 Endpoint 0·46 0·18 0·36 0·24 0·293
Faecal calprotectin (mg/kg faeces)‡k Baseline Median 60·3 139·0 78·1 Minimum – maximum 24·6 – 501·4 17·3 – 449·1 16·8 – 463·8 Midpoint Median 31·2 59·7 115·0 0·501 Minimum – maximum 18·4 – 306·0 17·8 – 361·3 16·4 – 565·6 Endpoint Median 69·8 59·7 60·5 0·865 Minimum – maximum 15·6 – 490·5 17·1 – 476·3 19·8 – 536·7 CRP, C-reactive protein.
a,bMean values with unlike superscript letters were significantly different (P, 0·05; one-way ANOVA with post hoc Bonferroni correction).
* No Fe status indices and anthropometric measurements were available for children in the Fe-sufficient group at the endpoint. † Midpoint (only for faecal calprotectin) and endpoint variables were compared between the groups using ANCOVA with respective
baseline values as covariates.
‡ Data were log transformed for statistical analyses.
§ Only those children were considered whose CRP concentrations were , 5 mg/l. k Placebo group, n 12; Fe group, n 13; Fe-sufficient group, n 13.
British
Journal
of
Fe-deficient groups (placebo and Fe groups) had significantly lower Hb and lower Fe status than the Fe-sufficient group. The prevalence of Fe deficiency based on the concentrations of TfR and SF in the Fe group was 18·2 and 9·1 %, respectively, and in the placebo group 18·5 and 29·6 %, respectively. More-over, 25·9 % of the children in the placebo group and 13·6 % of the children in the Fe group were anaemic, while none of the children in the Fe-sufficient group were anaemic. There was a significant intervention effect (ANCOVA with baseline values as covariates) of Fe supplementation for lower TfR concen-trations (P, 0·001) and higher SF concenconcen-trations (P, 0·001) at the endpoint in the Fe group compared with the placebo group. Fe supplementation did not affect the concentration of CRP. Faecal calprotectin concentrations did not differ between the groups at baseline, midpoint and endpoint, and were not affected by Fe supplementation.
Dietary assessment done in the study population found a mean background dietary Fe intake of 9·8 (SEM 0·3) mg/d.
The incidence of illness was recorded during the entire trial period, and the mean days absent from school due to illness was 1·3 (SEM 0·3) d and due to gastrointestinal illness (diar-rhoea, stomach pain and/or vomiting) was 0·3 (SEM0·1) d in
children included in the present study. Moreover, the mean days absent due to all illness and gastrointestinal illness did not differ between the Fe (all illness: 1·2 (SEM0·4) d; gastro-intestinal illness: 0·2 (SEM0·1) d) and placebo (all illness: 1·3 (SEM0·4) d; gastrointestinal illness: 0·3 (SEM0·2) d) groups.
Concentrations of dominant bacterial groups
Total 16S ribosomal RNA gene copies were stable over the entire trial period, and no differences were observed between the treatment groups across the different time points (Fig. 2).
12 (a) (b) (c) (d) 10 8 6 12 10 8 6 12 10 8 6
Bacterial concentration (log number of gene copies/g faeces)
12 10 8 6 * * * * * * * * * * Total 16S Bacteroides spp.
Firmicutes ClostridiumCluster IV E. hallii F. prausnitzii Roseburia spp./ E.rectale Bifidobacterium spp. Lactobacillus/ Pediococcus/ Leuconostoc spp. Enterobacteriaceae SRB
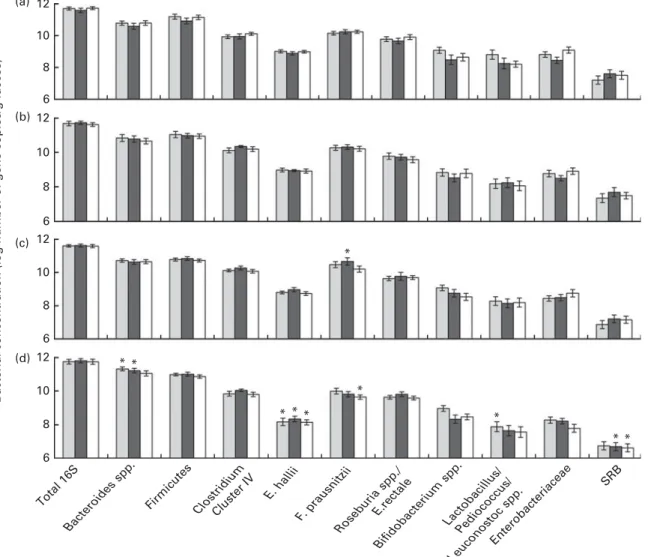
Fig. 2. Log number of 16S ribosomal RNA gene copies or functional gene copies/g faeces of selected bacterial target groups in the gut microbiota of children in the placebo group ( ), iron group ( ) and iron-sufficient group ( ) at (a) baseline, (b) 2 weeks, (c) midpoint and (d) endpoint. No significant treatment£ time interaction was detected using repeated-measures ANOVA, with the sampling time point as the within-subject variable and intervention group (iron and placebo groups) as the between-subject factor. Values are means, with their standard errors represented by vertical bars. * Mean value was significantly different from that of baseline concentrations of the same bacterial target group within a treatment group (P, 0·05; repeated-measures ANOVA). SRB, sulphate-reducing bacteria.
British
Journal
of
At baseline, measured gut bacterial populations did not differ between the children who were Fe deficient (placebo and Fe groups) and those with an adequate Fe status (Fe-sufficient group). There was a trend observed towards lower concentrations of Enterobacteriaceae in the faeces of children in the Fe group compared with the Fe-sufficient group (P¼ 0·064).
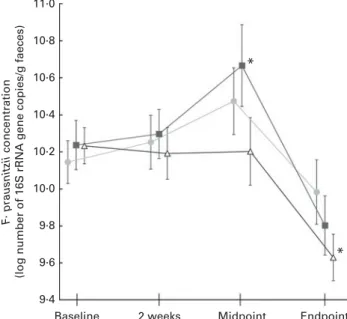
With baseline concentrations as covariates, there were no significant differences observed between the groups in terms of concentrations of any of the measured bacterial target groups at 2 weeks, midpoint or endpoint of the study. Moreover, no significant effects of Fe treatment or time£ treatment interaction were observed when analysing each bacterial target group over time and including only the placebo and Fe groups in the analysis. However, there were significant effects for time within the groups, when comparing bacterial concentrations at 2 weeks, midpoint and endpoint with baseline. As shown in Fig. 2, Bacteroides spp. signifi-cantly increased in the placebo (P¼ 0·004) and Fe (P¼ 0·004) groups from baseline to the endpoint, while Eubacterium hallii concentrations significantly decreased in the placebo (P, 0·001), Fe (P¼ 0·024) and Fe-sufficient (P, 0·001) groups, and sulphate-reducing bacteria concentrations signifi-cantly decreased only in the Fe-sufficient (P¼ 0·03) and Fe (P¼ 0·008) groups from baseline to the endpoint. Concen-trations of Lactobacillus/Leuconostoc/Pediococcus spp. signifi-cantly decreased from baseline to the endpoint (P¼ 0·027) in the placebo group, and Faecalibacterium prausnitzii concen-trations decreased from baseline to the endpoint (P¼ 0·004) in the Fe-sufficient group. Furthermore, concentrations of F. prausnitzii increased from baseline to the midpoint (P¼ 0·045) in the Fe group, which was not observed in the placebo group or the Fe-sufficient group (Fig. 3).
Faecal SCFA concentrations
Baseline faecal acetate, propionate and butyrate con-centrations did not differ between the placebo, Fe and the Fe-sufficient groups (Fig. 4(a) – (c), respectively). Also, the baseline ratios of acetate:propionate:butyrate did not differ between the placebo (59:28:13), Fe (58:27:15) and Fe-sufficient (56:30:14) groups.
With baseline values as covariates, there were no signi-ficant differences observed in faecal acetate, propionate and butyrate concentrations between the three groups at 2 weeks, midpoint or endpoint of the study. Furthermore, no significant effects for Fe treatment and time£ treatment interaction were found for SCFA production by the gut microbiota when including only the Fe and placebo groups in the analysis. However, there were significant effects for time within the Fe and placebo groups (but not within the Fe-sufficient group) when comparing the concentrations of metabolites during the intervention with those at baseline. Acetate concen-trations significantly increased from baseline to 2 weeks (P¼ 0·026) in the Fe group (Fig. 4(a)). In the placebo group, acetate concentrations significantly increased from baseline to the endpoint (P¼ 0·009). In the Fe and placebo groups, butyrate concentrations significantly increased from baseline
to 2 weeks (P¼ 0·001 and P¼ 0·002, respectively) and to the endpoint (P¼ 0·034 and P¼ 0·040, respectively; Fig. 4(c)). At midpoint, butyrate concentrations remained significantly higher than those at baseline in the Fe group (P¼ 0·040). There were no significant effects of time on propionate concentrations within the groups (Fig. 4(b)).
Discussion
The present study was the first randomised, placebo-controlled Fe intervention trial to investigate the impact of oral Fe supplementation on gut microbiota and gut inflam-mation in African children. The major finding of the present study is that high-dose Fe supplementation (50 mg Fe, 4 d/week) over a period of 38 weeks did not significantly modify the concentrations of dominant bacterial groups in the gut or faecal SCFA, and did not increase gut inflammation. A second important finding is that the dominant bacterial groups prevalent in the gut and faecal SCFA concentrations of Fe-sufficient children were not different from those of Fe-deficient children.
We found no effect of Fe supplementation on the abun-dance of dominant bacterial groups in the gut compared with the placebo treatment. These findings are in sharp con-trast to the previous study in similarly aged children living in rural Coˆte d’Ivoire, where daily provision of Fe-fortified biscuits (10 mg Fe as electrolytic Fe) to school children for 6 months significantly increased Enterobacteriaceae and decreased lactobacilli concentrations(9). This difference may
11·0 10·8 10·6 10·4 10·2 10·0 9·8 F· prausnitzii concentration
(log number of 16S rRNA gene copies/g faeces)
9·6
9·4
Baseline 2 weeks Midpoint Endpoint
* *
Fig. 3. Log number of 16S ribosomal RNA (rRNA) gene copies/g faeces of Faecalibacterium prausnitzii in the faecal samples of children in the placebo
group (n 27, ), iron group (n 22, ) and iron-sufficient group (n 24, )
measured over time by quantitative PCR. No significant treatment£ time interaction was detected using repeated-measures ANOVA, with the sampling time point as the within-subject variable and intervention group (iron and placebo groups) as the between-subject factor. Values are means, with their standard errors represented by vertical bars. * Mean value was sig-nificantly different from that of baseline concentrations within a treatment group (P, 0·05; repeated-measures ANOVA).
British
Journal
of
be at least partially explained by the fact that Ivorian children lived in a remote rural area with poorer-quality water and food sanitation, a more monotonous low-quality diet and a higher infectious disease burden (including enteropathogens and malaria). Colonic Fe can promote the growth and viru-lence of certain pathogens(36 – 38). During enteropathogen infection and the resulting inflammation, the composition of the gut microbiota is shifted towards facultative anaerobes such as enterobacteria(29,39 – 42), and high colonic Fe concentrations may contribute to these effects by aggravating inflammation(18,43). The children in the present study were mainly from households with access to relatively clean tap water and lived in a malaria-free environment. In addition, the schools in this area of South Africa participated in the National School Nutrition Program, where children were offered a daily school meal that contributes to nutritional diversity. Nevertheless, studies in infants have shown an impact of additional dietary Fe supplementation on the gut microbiota even in industrialised countries with a low entero-pathogen burden(26,44). However, the gut microbiota in infants is in the process of developing into a fully diversified bacterial ecosystem. This still fragile bacterial consortium may be more vulnerable to alterations in luminal Fe status than a fully diversified and stable gut microbiota such as that found in the 6- to 11-year-old children of the present study.
We also found that the abundance of dominant bacterial groups and faecal SCFA concentrations did not differ between Fe-deficient (Fe and placebo groups) and Fe-sufficient children. This is in contrast with several animal studies that associated Fe deficiency with changes in the composition of the gut microbiota(17,18,24). Animal and in vitro studies have further shown that Fe deficiency modifies the metabolic activity of the gut microbiota, resulting in a decrease in buty-rate production(21,34). These differences from our findings may be due to the differences in the severity of Fe deficiency among the studies. Most of the children included in the pre-sent study were only mildly Fe deficient. South Africa fortifies wheat flour and maize meal with Fe, and the mean daily Fe intake in the present study population was found to be 9·8 (SEM 0·3) mg(3,45). Thus, colonic luminal Fe concentrations in children of the present study were unlikely to have been very low. In previous in vitro studies, we have shown that a dietary Fe concentration in this range is sufficient to maintain a stable gut microbiota(34).
During the study, there was an overall decrease observed in the concentrations of faecal lactobacilli, E. hallii, F. prausnitzii and sulphate-reducing bacteria, while concentrations of Bacteroides spp. slightly increased from baseline to the end-point in all the treatment groups. Since these changes were independent of Fe supplementation and also observed in the Fe-sufficient group, we assume that either seasonal changes or other alterations in dietary habits during the intervention (including a long school vacation between the midpoint and the endpoint, with no school lunch provided) may be responsible for these time effects.
SCFA acetate, propionate and butyrate are the major meta-bolites of the gut microbiota. In the present study, no differences in SCFA were observed between Fe-sufficient and Fe-deficient children at baseline, and Fe supplementation did not affect faecal SCFA concentrations. This is in contrast to previous studies in rats, where Fe supplementation increased the metabolic activity of the microbiota, particularly butyrate(21,22). However, generally, only about 5 % of the SCFA produced by the gut microbiota are excreted in the faeces; the remainder are readily absorbed by the host, which can lead to large variations in faecal SCFA concentrations(46). Nevertheless, faecal acetate or butyrate concentrations were modified in the Fe and placebo groups over time, which may be explained by seasonal alterations in diet or other factors, as discussed above, for the composition of the gut microbiota.
Because high luminal Fe concentrations can promote inflammation(18,43), in the present study, we assessed systemic inflammation by serum CRP and local colonic inflammation by faecal calprotectin, a peptide secreted by neutrophils infil-trating the gut mucosa. Serum CRP and faecal calprotectin concentrations did not differ between sufficient and Fe-deficient children at baseline. Furthermore, in this setting, high-dose Fe supplementation in Fe-deficient children did not measurably increase systemic or gut inflammation. Thus, our findings differ from the study conducted in rural Coˆte d’Ivoire, where provision of Fe-fortified biscuits increased faecal calprotectin concentrations compared with a control group(9). However, in that study, Fe fortification increased
80 (a) (b) (c) 70 60 50 40 50 40 30 20 10 40 30 20 10 0 Baseline 2 weeks * * * * * * * Midpoint Endpoint Acetate
concentration (µmol/g faeces)
Propionate
concentration (µmol/g faeces)
Butyrate
concentration (µmol/g faeces)
Fig. 4. (a) Acetate, (b) propionate and (c) butyrate concentrations in the
faecal samples of children in the placebo group ( ), iron group ( ) and
iron-sufficient group ( ) at baseline, 2 weeks, midpoint and endpoint of the study. No significant treatment£ time interaction was detected using repeated-measures ANOVA, with the sampling time point as the within-sub-ject variable and intervention group (iron and placebo groups) as the between-subject factor. Values are means (n 9 – 10 children per group and time point), with their standard errors represented by vertical bars. * Mean value was significantly different from that of baseline concentrations of the same metabolite within a treatment group (P, 0·05; repeated-measures ANOVA).
British
Journal
of
enterobacteria numbers (including many potential entero-pathogens causing gut inflammation), which correlated with faecal calprotectin. In the present study, the overall incidence of diarrhoea during the intervention was very low with an average of only 0·1 (SEM0·1) d absent due to gastrointestinal illness, and no differences between Fe- and placebo-supplemented children were observed. However, clinical data should be interpreted with caution, as they were based on self-reporting and the sample size of the present study was small. Calprotectin concentrations in our children were generally higher than those previously reported in African children at this age(9,47).
In summary, in South African school-aged children from a malaria-free rural area with a low gastrointestinal disease burden, we found no significant differences in the abundance of dominant bacterial groups or faecal SCFA concentrations in mildly Fe-deficient and non-Fe-deficient children. This suggests that dietary and luminal Fe levels in both groups were sufficient to maintain the gut microbiota. Furthermore, high-dose Fe supplementation had no measurable impact on the abundance of dominant bacterial groups in the gut, faecal SCFA concentration or gut inflammation. Therefore, it appears that Fe supplementation poses a low risk for negative modulation of the tested bacterial groups and/or adverse intestinal effects at this age and in this setting. Hence, our initial hypothesis that high-dose Fe supplementation would modify the tested bacterial groups and metabolites under all conditions could not be confirmed. The effects of Fe supplementation on the gut microbiota most probably also depend on environmental factors (e.g. presence of entero-pathogens) and gut inflammatory preset of the host. Future research should therefore investigate the potential effects of Fe supplementation on the gut microbiota in other age groups, in populations where Fe deficiency is more severe, and in settings where poor-quality water and food supplies increase exposure to potential enteropathogens.
Acknowledgements
The authors thank the fieldworkers, teachers and principals of the schools for their support of the study; the children and parents for their participation in the trial; the Medical Research Council and North-West University colleagues, especially Linda Malan and Ellenor Rossouw, and students, especially Jani Greeff, for their assistance during field and laboratory work; Nicola Mosca and Van Pham Thanh for assistance with the composition of the gut microbiota and faecal SCFA concentration analyses.
The present study was supported by the Swiss National Science Foundation (project no.: 310030_127272, Bern, Switzerland); Eunice Kennedy Shriver National Institute of Child Health and Human Development (award no.: U01HD0 64921); and Unilever Research and Development, Vlaardin-gen, The Netherlands. Paul Lohmann GmbH (Lomapharm, Emmertal, Germany) provided the Fe supplements. Travel support was provided by the European – South African Part-nership in Nutrition Research. None of the funders had a role in the design, analysis or writing of this article.
The authors’ contributions are as follows: A. D., J. B., C. C., C. M. S., M. B. Z. and C. L. designed the research; A. D., J. B. and N. R. conducted the research; A. D., J. B. and N. R. analysed the data; A. D., J. B., C. C., M. B. Z. and C. L. wrote the paper; C. L. had primary responsibility for the final content. All authors read and approved the final manuscript.
None of the authors had a conflict of interest to declare.
References
1. Zimmermann MB & Hurrell RF (2007) Nutritional iron deficiency. Lancet 370, 511 – 520.
2. Beard J (2003) Iron deficiency alters brain development and functioning. J Nutr 133, 1468S – 1472S.
3. Baumgartner J, Smuts CM, Malan L, et al. (2012) Effects of iron and n-3 fatty acid supplementation, alone and in com-bination, on cognition in school children: a randomized, double-blind, placebo-controlled intervention in South Africa. Am J Clin Nutr 96, 1327 – 1338.
4. WHO (2002) Iron Deficiency Anemia: Assessment, Preven-tion, and Control. A Guide for Programme Managers. Geneva: World Health Organization.
5. Stoltzfus RJ & Dreyfuss ML (1998) Guidelines for the Use of Iron Supplements to Prevent and Treat Iron Deficiency Anemia. Washington, DC: ILSI Press.
6. Gera T & Sachdev HP (2002) Effect of iron supplementation on incidence of infectious illness in children: systematic review. BMJ 325, 1142.
7. Iannotti LL, Tielsch JM, Black MM, et al. (2006) Iron sup-plementation in early childhood: health benefits and risks. Am J Clin Nutr 84, 1261 – 1276.
8. Hurrell RF (2011) Safety and efficacy of iron supplements in malaria-endemic areas. Ann Nutr Metab 59, 64 – 66. 9. Zimmermann MB, Chassard C, Rohner F, et al. (2010) The
effects of iron fortification on the gut microbiota in African children: a randomized controlled trial in Cote d’Ivoire. Am J Clin Nutr 92, 1406 – 1415.
10. Sekirov I, Russell SL, Antunes LC, et al. (2010) Gut micro-biota in health and disease. Physiol Rev 90, 859 – 904. 11. Flint HJ, Scott KP, Louis P, et al. (2012) The role of the gut
microbiota in nutrition and health. Nat Rev Gastroenterol Hepatol 9, 577 – 589.
12. Gordon JI, Dewey KG, Mills DA, et al. (2012) The human gut microbiota and undernutrition. Sci Transl Med 4, 137ps112. 13. Yatsunenko T, Rey FE, Manary MJ, et al. (2012) Human gut microbiome viewed across age and geography. Nature 486, 222 – 227.
14. Smith MI, Yatsunenko T, Manary MJ, et al. (2013) Gut micro-biomes of Malawian twin pairs discordant for kwashiorkor. Science 339, 548 – 554.
15. Monira S, Nakamura S, Gotoh K, et al. (2011) Gut microbiota of healthy and malnourished children in Bangladesh. Front Microbiol 2, 228.
16. Gupta SS, Mohammed MH, Ghosh TS, et al. (2011) Metagen-ome of the gut of a malnourished child. Gut Pathog 3, 7. 17. Tompkins GR, O’Dell NL, Bryson IT, et al. (2001) The effects
of dietary ferric iron and iron deprivation on the bacterial composition of the mouse intestine. Curr Microbiol 43, 38 – 42.
18. Werner T, Wagner SJ, Martinez I, et al. (2011) Depletion of luminal iron alters the gut microbiota and prevents Crohn’s disease-like ileitis. Gut 60, 325 – 333.
19. Lee SH, Shinde P, Choi J, et al. (2008) Effects of dietary iron levels on growth performance, hematological status, liver mineral concentration, fecal microflora, and diarrhea
British
Journal
of
incidence in weanling pigs. Biol Trace Elem Res 126, Suppl. 1, S57 – S68.
20. Benoni G, Cuzzolin L, Zambreri D, et al. (1993) Gastrointes-tinal effects of single and repeated doses of ferrous sulphate in rats. Pharmacol Res 27, 73 – 80.
21. Dostal A, Chassard C, Hilty FM, et al. (2012) Iron depletion and repletion with ferrous sulfate or electrolytic iron mod-ifies the composition and metabolic activity of the gut micro-biota in rats. J Nutr 142, 271 – 277.
22. Dostal A, Lacroix C, Pham VT, et al. (2014) Iron supplemen-tation promotes gut microbiota metabolic activity but not colitis markers in human gut microbiota-associated rats. Br J Nutr 21, 1 – 11.
23. Andrews SC, Robinson AK & Rodriguez-Quinones F (2003) Bacterial iron homeostasis. FEMS Microbiol Rev 27, 215 – 237. 24. Balamurugan R, Mary RR, Chittaranjan S, et al. (2010) Low levels of faecal lactobacilli in women with iron-deficiency anaemia in south India. Br J Nutr 104, 931 – 934.
25. Mevissen-Verhage EA, Marcelis JH, Harmsen-van Amerongen WC, et al. (1985) Effect of iron on neonatal gut flora during the first week of life. Eur J Clin Microbiol 4, 14 – 18. 26. Krebs NF, Sherlock LG, Westcott J, et al. (2013) Effects of
different complementary feeding regimens on iron status and enteric microbiota in breastfed infants. J Pediatr 163, 416 – 423.
27. Weinberg ED (2009) Iron availability and infection. Biochim Biophys Acta 1790, 600 – 605.
28. Doherty CP (2007) Host – pathogen interactions: the role of iron. J Nutr 137, 1341 – 1344.
29. Stecher B & Hardt WD (2008) The role of microbiota in infectious disease. Trends Microbiol 16, 107 – 114.
30. Soofi S, Cousens S, Iqbal SP, et al. (2013) Effect of provision of daily zinc and iron with several micronutrients on growth and morbidity among young children in Pakistan: a cluster-randomised trial. Lancet 382, 29 – 40.
31. Cunnington AJ, de Souza JB, Walther M, et al. (2012) Malaria impairs resistance to Salmonella through heme- and heme oxygenase-dependent dysfunctional granulocyte mobiliz-ation. Nat Med 18, 120 – 127.
32. Zimmermann MB (2008) Methods to assess iron and iodine status. Br J Nutr 99, Suppl. 3, S2 – S9.
33. Metzgeroth G, Adelberger V, Dorn-Beineke A, et al. (2005) Soluble transferrin receptor and zinc protoporphyrin – com-petitors or efficient partners? Eur J Haematol 75, 309 – 317. 34. Dostal A, Fehlbaum S, Chassard C, et al. (2013) Low iron
availability in continuous in vitro colonic fermentations induces strong dysbiosis of the child gut microbial consor-tium and a decrease in main metabolites. FEMS Microbiol Ecol 83, 161 – 175.
35. Zihler A, Gagnon M, Chassard C, et al. (2010) Unexpected consequences of administering bacteriocinogenic probiotic strains for Salmonella populations, revealed by an in vitro colonic model of the child gut. Microbiology 156, 3342 – 3353.
36. Bjarnason J, Southward CM & Surette MG (2003) Genomic profiling of iron-responsive genes in Salmonella enterica serovar Typhimurium by high-throughput screening of a random promoter library. J Bacteriol 185, 4973 – 4982. 37. Layton AN, Hudson DL, Thompson A, et al. (2010)
Salicyli-dene acylhydrazide-mediated inhibition of type III secretion system-1 in Salmonella enterica serovar Typhimurium is associated with iron restriction and can be reversed by free iron. FEMS Microbiol Lett 302, 114 – 122.
38. Janakiraman A & Slauch JM (2000) The putative iron trans-port system SitABCD encoded on SPI1 is required for full virulence of Salmonella typhimurium. Mol Microbiol 35, 1146 – 1155.
39. Raffatellu M, George MD, Akiyama Y, et al. (2009) Lipocalin-2 resistance confers an advantage to Salmonella enterica ser-otype Typhimurium for growth and survival in the inflamed intestine. Cell Host Microbe 5, 476 – 486.
40. Winter SE, Thiennimitr P, Winter MG, et al. (2010) Gut inflammation provides a respiratory electron acceptor for Salmonella. Nature 467, 426 – 429.
41. Winter SE, Lopez CA & Baumler AJ (2013) The dynamics of gut-associated microbial communities during inflammation. EMBO Rep 14, 319 – 327.
42. Winter SE, Winter MG, Xavier MN, et al. (2013) Host-derived nitrate boosts growth of E. coli in the inflamed gut. Science 339, 708 – 711.
43. Carrier J, Aghdassi E, Platt I, et al. (2001) Effect of oral iron supplementation on oxidative stress and colonic inflam-mation in rats with induced colitis. Aliment Pharmacol Ther 15, 1989 – 1999.
44. Mevissen-Verhage EA, Marcelis JH, Harmsen-Van Ameron-gen WC, et al. (1985) Effect of iron on neonatal gut flora during the first three months of life. Eur J Clin Microbiol 4, 273 – 278.
45. South Africa Department of Health (2003) Regulations relating to the fortification of certain foodstuffs. http:// www.doh.gov.za/docs/regulations/2003/ffortification.html 46. Cummings JH & Macfarlane GT (1991) The control and
con-sequences of bacterial fermentation in the human colon. J Appl Bacteriol 70, 443 – 459.
47. Hestvik E, Tumwine JK, Tylleskar T, et al. (2011) Faecal cal-protectin concentrations in apparently healthy children aged 0 – 12 years in urban Kampala, Uganda: a community-based survey. BMC Pediatr 11, 9.
48. Guo X, Xia X, Tang R, et al. (2008) Development of a real-time PCR method for Firmicutes and Bacteroidetes in faeces and its application to quantify intestinal population of obese and lean pigs. Lett Appl Microbiol 47, 367 – 373. 49. Ramirez-Farias C, Slezak K, Fuller Z, et al. (2009) Effect of
inulin on the human gut microbiota: stimulation of Bifido-bacterium adolescentis and FaecaliBifido-bacterium prausnitzii. Br J Nutr 101, 541 – 550.
50. Furet JP, Firmesse O, Gourmelon M, et al. (2009) Compara-tive assessment of human and farm animal faecal microbiota using real-time quantitative PCR. FEMS Microbiol Ecol 68, 351 – 362.
51. Bartosch S, Woodmansey EJ, Paterson JC, et al. (2005) Micro-biological effects of consuming a synbiotic containing Bifido-bacterium bifidum, BifidoBifido-bacterium lactis, and oligofructose in elderly persons, determined by real-time polymerase chain reaction and counting of viable bacteria. Clin Infect Dis 40, 28 – 37.
52. Pereyra LP, Hiibel SR, Prieto Riquelme MV, et al. (2010) Detection and quantification of functional genes of cellu-lose-degrading, fermentative, and sulfate-reducing bacteria and methanogenic archaea. Appl Environ Microbiol 76, 2192 – 2202.
53. Cleusix V, Lacroix C, Dasen G, et al. (2010) Compara-tive study of a new quantitaCompara-tive real-time PCR targeting the xylulose-5-phosphate/fructose-6-phosphate phosphoke-tolase bifidobacterial gene (xfp) in faecal samples with two fluorescence in situ hybridization methods. J Appl Microbiol 108, 181 – 193.