European Sociological Renew, Vol. 14 No. 2,151-175 151
The Dimensionality of Postmaterialism:
An Application of Factor Analysis to Ranked
Preference Data
Stefan Saccbi
Previous research indicates that the measurement instrument for postmaterialist value-orientations is not one-dimensional, as Inglehart assumed. Instead, it seems to capture three independent dimensions suggesting an interpretation based on Habermas's theory of a 'colonization' of the life-world. In particular, the dimensions seem to catch different political potentials provoked by the penetration of the lifeworld by the econo-administrative complex. Two questions raised by these findings are addressed. First, they are based on a special measurement model for ranked preference data with largely unknown properties - thus, the model's ability to uncover the dimensional struc-ture of Inglehart's instrument can be questioned. Second, the interpretation referring to Habermas requires that the dimensions are basically identical throughout advanced industrial countries and approximately stable over time. In this respect, the earlier findings are inconclusive. Results suggest that the measurement model accurately estimates number and structure of the latent dimensions implied by a set of rankings. In addition, the claim that Inglehart's instrument captures several independent and approximately identical dimensions in different industrial countries is confirmed with respect to Germany, the Netherlands, and the United States. Results also indicate that the dimensions are stable within countries.
Introduction ^c s uPe"mP°s e c :l by period effects (Inglehart, 1989;
de Graaf, 1989; Mnich, 1989; Klein, 1991; Sacchi, Sociological research on changing value orienta- 1992; Abramson and Inglehart, 1995).
tions has been strongly influenced by Inglehart's The ongoing debate about the stability of postma-concept of postmaterialism (Inglehart, 1977, 1989). terialist value orientations at both the cohort and the Compared to other value-concepts, it has been individual level has largely displaced the controversy more widely used over a relatively long time period, about the dimensionality of postmaterialism. Sev-In addition, Sev-Inglehart^ findings have attracted end researchers concluded that the instrument remarkable attention outside the scientific commu- designed to capture postmaterialist value orienta-nity. The scientific reception, as well as the public tions is not one-dimensional as Inglehart assumes, reception, was mainly focused on the controversial Their results rather seem to suggest that the instru-expectation of intergenerational value change to- ment taps several value dimensions (van Deth, wards a more postmaterialist society. This crucial 1983*; Here, 1979,1987; Flanagan, 1982,1987; Jagod-assumption is supported by some newer studies, zinski, 1984; Bean and Papadakis, 1994; Klein, 1995). although the predicted cohort differences seem to Up to now, the dimensionality problem has
remained unresolved, however, because the ranked preference data used for measurement have hindered a conclusive analysis. The main reason is that the standard methodology for solving dimen-sionality problems - factor analysis — should not be applied to rankings, since the evaluations of the individual items are not independent (Inglehart, 1979: 315). Therefore, most of the above-mentioned studies are based on a modified version of Ingle-hart^ measurement instrument, which is suitable for factor analysis. Correspondingly, the findings are only valid regarding the modified version. More-over, the modified versions are based on ratings, which are not very appropriate for the measurement of values, as I shall argue below. The few studies addressing the dimensionality problem on the basis of Ingleharts original instrument either ignore the fact that factor analysis should not be applied to rankings (Bean and Papadakis, 1994), or they use alternative statistical procedures, which do not allow unambiguous identification of the captured value dimensions (Herz, 1979; van Deth 1983*). In sum, research is inconclusive regarding the dimen-sionality of Inglehart's instrument, although there is evidence that the instrument is not one-dimen-sional.1
In a previous study, I have presented additional support for the notion that Ingleharts measurement instrument taps several value dimensions (Sacchi, 1994). The findings are based on a special factor model for ranked preference data, which was used to reanalyse some important studies on postmateri-alism. Results suggest that Inglehartls original instrument taps three independent dimensions of political values or conflict. The dimensions are remarkably similar throughout Western industrial countries, and they appear approximately un-changed during the 1970s and 1980s. Thus, a common political cleavage structure of advanced industrial societies seems to be reflected by the three value dimensions. The proposed theoretical explanation for these findings builds on Habermas's theory of communicative action, or, more precisely, on the thesis of the 'colonization of the lifeworld' (Habermas, 1987, 1981). Basically, it is maintained that in developed capitalist societies the reproduc-tion of the lifeworld is distorted by the expansion of media-driven subsystems, namely, the economy and the state. The colonization metaphor stands for
this process characterized by the extensive monetar-ization and bureaucratmonetar-ization of society, which, ultimately, is responsible not only for symptoms of reification and cultural impoverishment, but also for the rise of different types of new potential for pro-test. Interestingly enough, the three-dimensional cleavage structure caught by the Inglehart items seems to match Habermas's theoretical expectations very well, each dimension representing a different type of reaction provoked by the colonization tendencies.
The summarized findings are inconclusive in sev-eral respects, however. First, they are obtained with a special measurement model for ranked preference data, which builds on specific assumptions that can barely be tested empirically. Also, little is known regarding the properties of the model, as it has been applied only rarely up to now. Therefore, its capacity to uncover the structure of the dimensions tapped by Inglehart^ instrument remains rather unclear. Moreover, there are no unequivocal statisti-cal criteria to determine the number of relevant dimensions in the context of the model. Thus, the results reported earlier may be questioned regarding both the number and the internal structure of the latent dimensions.
Second, possible objections can also be directed against the notion that Inglehartls instrument essentially captures identical and stable dimensions in most industrial countries. This conclusion has mainly been drawn from a visual comparison of loading patterns over countries and time. How-ever, when the respective differences are not negligible, visual inspection opens a wide latitude for interpretation, and a systematic test regarding country variation and aggregate stability would be desirable. Obviously, both points are critical for the interpretation of the findings. Neither the claim that the items tap three independent dimen-sions nor their interpretation can be defended without the assumption that the measurement model performs well. In addition, the interpreta-tion referring to Habermas requires that the dimensions are approximately equal in all indus-trial countries and that they remain more or less stable over time. This follows from the claim that they reflect a common cleavage structure emerg-ing from general and long-term modernization processes.
THE DIMENSIONALITY OF POSTMATERIAUSM 153 In the present article, I hope to clarify the critical
points listed above. In particular, I will address three related questions:
1. Does the measurement model for ranked prefer-ence data give accurate estimates of latent dimensions implied by a set of ranked items? 2. Do the Inglehart items tap three approximately
identical, political value or conflict dimensions in different industrial countries?
3. Are the respective dimensions stable within countries?
In order to address these questions, two types of data will be analysed. On the one hand, artificial data with a known dimensional structure are ana-lysed to assess the properties of the measurement model. On the other hand, data from the Political Action Panel, collected between 1974 and 1981 in Germany, the Netherlands, and the United States will be reanalysed (Zentralarchiv fur empirische Sozialforschung, 1979, no date). In the first section, the application of the measurement model will be exemplified using data from the first panel wave. In the second section, I will investigate the perfor-mance of the measurement model by means of a Monte Carlo simulation. Thirdly, I will be con-cerned with the importance of national differences in the dimensions. Finally, the two panel waves will be analysed simultaneously, so that the stability of the dimensions on aggregate, as well as at the individual level, can be assessed.
Application of the Factorial Model
for Ranked Preference Data
Usually, values are defined with reference to Kluc-khohn (1976: 395) as a conception 'of the desirable which influences the selection from available modes, means, and ends of action.' Thus, in contrast to attitudes, values are seen as stable elements of per-sonality with a strong impact on individual behaviour. Definitions of this type are relatively undisputed.
The appropriate way to measure values is far less consensual, however. None the less, there are 'strong theoretical arguments for choosing rankings instead of ratings when political values are the objea of measurement.' (van Deth, 1983*: 410, Hellevik, 1994). Their theoretical superiority follows from
the fact that ranking procedures force respondents to choose among items: respondents arc most likely to reveal their values when goal conflicts and/or scarce resources make a choice between different claims inevitable. In contrast, rating methods — the most common alternative — allow respondents to give equal importance to every item. Ratings thus measure respondents' attitudes regarding the desir-ability of specific item-contents, rather than values. Moreover, since value-items in general arc highly evaluated almost by definition, one cannot expect much variation in the answers. As a consequence, rankings arc far better suited to the measurement of deep-rooted preferences, i.e. values, with high relevance for action. From this point of view, the ranking procedure applied by Inglehart contributes substantially to the strong impact of postmaterialist values on various forms of conventional and uncon-ventional political participation (Barnes and Kaase, 1979; Inglehart, 1989, 1990, Jennings et aJ., 1990; Sacchi, 1992). For similar reasons, the most impor-tant approaches to the study of value orientations do at least partly rely on ranked preference data.2
There are also possible objections to the applica-tion of ranking procedures. First, the criticism is made that respondents have no opportunity to give equal importance to different value-items and, con-sequently, such procedures imply that values are hierarchically ordered (Klages, 1992: 26; Bockler et
a/., 1991; Maag, 1989, 1991). Now, as mentioned
above, ranking procedures do indeed require that respondents' value orientations enable them to make a choice when faced by unresolvable goal-con-flicts or by a measurement strategy. In this slightly weaker formulation, on the other hand, the assump-tion does not seem unreasonable, since respondents have to choose among conflicting claims not only in the interview situation, but also in everyday life. Moreover, in the case of the Inglehart items, this argument is corroborated by empirical evidence: measured by the rate of refusals, respondents do not seem to have special difficulties in ranking the items - an indication that the underlying assump-tion is appropriate (Zentralarchiv rflr empirische Sozialforschung, 1979: 44 f.).
A second and more serious objection to the appli-cation of rankings is the absence of a standard methodology for analysing ranked preference data. Factor analysis should not be used, since the scores
(i.e. ranks) of the individual items sum up to a con-stant, and, therefore, are not independent (Jackson and Alwin, 1980). When there are only two items to be ranked, for example, it is obvious that there will be a perfect negative correlation between the result-ing scores. Although the strength of the interdependence diminishes as the number of items increases, ranks remain negatively correlated by definition. These so-called 'ipsative' properties of ranked preference data violate a basic assumption of factor analysis, and, therefore, impose serious limitations on data analysis.
To overcome the second objection, Jackson and Alwin proposed a measurement model appropriate for factor analysis of ranked preference data (Jack-son and Alwin, 1980, Alwin and Jack(Jack-son, 1981).3 Their model is built on the basic assumption that rankings reflect underlying evaluations, i.e. ratings, at an invariant scale, and that the ipsative properties stem solely from the ranking procedure. It is difficult to test this crucial assumption directly, since the sup-posed evaluations are not identical to observable ratings that allow respondents to change their eva-luation standard from one item to another. Nevertheless, the few comparisons of ratings and rankings for the items applied by Inglehart to some degree support the notion that observed rankings reflect underlying ratings at constant scales. It turns out that the two methods only differ for a group of respondents giving high scores to all items when rat-ing is applied - apart from that, rankrat-ings and
ratings give similar results (van Deth, \983b; Bacher, 1987).*
Starting from the observed rankings, the mea-surement model is designed to uncover the factor structure of the underlying non-ipsative and scale-invariant evaluations. The original Alwin—Jackson model assumes that respondents rank only one set of items. Inglehart^ most elaborate measure of post-materialism, however, relies on two independent rankings of four and eight items, respectively (Table 1). This does not impose serious obstacles to analysis, because a slightly modified version of the measurement model can be applied to indepen-dently ranked items, as de Graaf et al. (1989) have shown.
Following Alwin and Jackson, two measures have to be taken to control for ipsativity in factor analysis. First, the rank of one item selected at random is excluded from analysis — the excluded information is redundant since it is implied in the rankings of the other items. In the case of several independent rank-ings, one item out of each has been excluded (de Graaf etal., 1989). Second, for every item a phantom variable is introduced into the factor model, absorb-ing the negative correlations among the rankabsorb-ings induced by the ranking procedure. Figure 1 gives an example of a model with two common dimen-sions or factors in a LISREL-notation. The model is made up of two common factors (f/1( T]^), ten
non-redundant rank indicators (yi-yio), and twelve phantom variables (f/3 — r]u) correcting for the
Table 1. Item-sets ofhigftbarti measurement instrument First ranking Iteml Item 2 Item 3 Item 4 Second ranking Item 5 Item 6 Item 7 Item 8 Item 9 Item 10 Item 11 Item 12
Maintain order in the nation
Give people more say in the decisions of the government* Fight rising prices
Protect freedom of speech*
Maintain a high rate of economic growth
Make sure that this country has strong defence forces
Give people more say in how things are decided at work and in their communities* Try to make our cities and countryside more beautiful*
Maintain a stable economy Fight against crime
Move towards a friendlier, less impersonal society*
Move towards a society where ideas are more important than money*
THE DIMENSIONALITY OF POSTMATERIALISM 155
Figure 1. Two-dimtnsionalmtasitreMtntmoddfarpostmattriatism.
correlated error structure. Although the model con-tains no separate error terms, measurement error is taken into account by means of the phantom variable (Jackson and Alwin, 1980: 227).
Because measurement is based on two indepen-dent rankings in the case of the Inglehart items, the phantom variables or error variances are only corre-lated within each item set. The model also includes two phantom variables for the omitted rank-indica-tors (»73, Tfu\ controlling their negative correlation
with the analysed rankings (yi-yio)- Theoretical arguments referring to indicators with ipsative properties shows that the correlations between phantom variable (f/j) and rank indicators (yj) are a function of the number of ranked items. Specifically, the phantom variable fy assigned to a particular rank-indicator yj, which is part of a ranking of n items, is expected to exert a negative effect on the other rank-indicators, which amounts to —1/n. At the same rime, the effect of the phantom variable on its 'own' indicator equals 1 — 1/n.5
Following these general rules, the respective para-meters of the ^-matrix can be fixed when the model is estimated, and, because the latent dimensions are assumed to be independent, the factor loadings are identified. A formal derivation for the special case with two independent rankings is found in de Graaf et d. (1989). It should be noted that the
estimated factor loadings are deviations from the mean loading on the original non-ipsative factor. Since these deviations sum to zero for each ranking, the loadings of the excluded items can be calculated by adding all loadings of an item set and reversing the sign (de Graaf tfa/., 1989:187). Nevertheless, the resulting loading pattern can be interpreted as in conventional factor analysis, at least as long as the loadings of the original non-ipsative structure can be expected to have opposite signs.
The measurement model will first be applied to data from the first wave of the Political Action Panel, carried out in 1974 in Germany, the Nether-lands, and the United States (Zentralarchiv filr empirische Sozialforschung, 1979, no date). Despite considerable panel attrition, especially in Germany, the samples seem to be representative of the adult population (Hagenaars et aJ., 1990). The analysis includes adult respondents at least 20 years old. Rank indicators are coded as a simple numeration according to subjective priority, where the most important item is coded as one.6 The data-set and coding are thus identical to those used by de Graaf
etal. in estimating the intragenerational stability of
postmaterialist value orientations. Moreover, I have also excluded the rankings of the same items when estimating the model. Regarding the first factor, results can therefore by compared.
The parameters of the model arc estimated with LISREL by the method of unweighted least squares (ULS) (Joreskog and Sorbom, 1989). Ranked prefer-ence data in general, as well as in the present case, do not have a multinomial distribution, which is required for maximum likelihood estimation (ML) (Alwin and Jackson, 1981: 322). In contrast, the fit function of ULS can be justified without this requirement.
It is recommended to start the analysis with a model without common factors. This allows us to judge the improvement of fit associated with the extraction of the first factor (Jackson and Alwin, 1980: 228). After that, I will first estimate a model with one factor and then extend it step by step for additional dimensions. As in conventional factor analysis, this raises the problem of when the extraction has to be stopped. In principle, this could be decided with the ^-test for the respective LISREL-Model, which, however, would again require a multinomial distribution. Since this assumption is not met, there is no unequivocal criterion for deciding on the number of relevant dimensions (Jackson and Alwin, 1980: 228). For the moment, I assume that the ^-statistic is unbiased despite the skewed distributions of the rank indicators, and, consequently, that it can be used to decide on the number of dimensions. The performance of the ^-test for this type of model and data will be examined in detail in the next section.
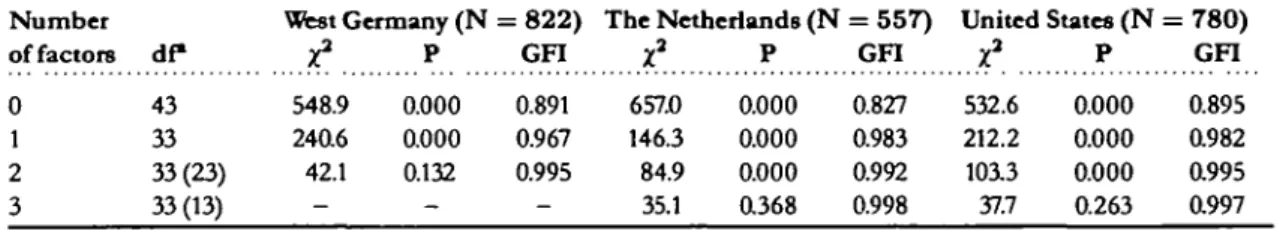
The baseline model without a common dimen-sion is expected to show a satisfactory fit, if the ranking procedure is the only source of correlation among the indicators. The results listed in Table 2 indicate that this is not the case. Compared to the 43 degrees of freedom, the ^-statistic of the base-line-model is very high in all countries.
The extraction of the first common value-dimension improves the fit considerably: there is a large j^-gain of several hundred points, com-pared to a loss of ten degrees freedom, and the goodness-of-fit index (GFI) indicates a better fit of the one-dimensional model as well (Table 2). Despite the improvement, the fit is not sufficient to accept the model and a second dimension is extracted. In order to identify the two-dimen-sional model, the loadings of the first factor have to be fixed on the estimates obtained from the one-dimensional solution (Joreskog and Sorbom, 1986: in. 103). Since the factors are orthogonal, it is possible to extract them step by step. It should be noted that due to the fixed loadings, the sub-model estimated in the second step has ten degrees of freedom more than the complete two-dimensional model. It turns out that the extrac-tion of the second dimension clearly improves the fit in all countries. The most substantial improvement is found in Germany, where the model with two factors can be accepted. For the other countries, the fit is still not satisfactory, and, consequendy, a third factor is extracted. Again, the loadings of the first two factors are fixed, when the additional dimension is estimated. This extension of the model leads to an acceptable fit in the remaining countries as well. Compared to the degrees of freedom, the j^-gain is substantial, but smaller than for the previous factors.
The results of the j^-tests are further confirmed when the residuals are inspected. A large residual indicates that the respective model is not able to explain the respective correlation between two indi-cators. This may also occur when the overall fit is good. For the preferred models, however, residuals are small and residual plots indicate a close corres-pondence between model and data.7
Table 2. Number of'txtracttdfactorsandfit oj'tbt measurementmoid
Number of factors df*
West Germany (N = 8 2 2 ) The Netherlands ( N = 557) United States ( N = 780)
GFI GFI GFI
0 1 2 3 43 33 33(23) 33(13) 548.9 240.6 42.1 -0.000 0.000 0.132 -0.891 0.967 0.995 -6570 1463 84.9 35.1 0.000 0.000 0.000 0.368 0.827 0.983 0.992 0.998 532.6 212.2 103.3 37.7 0.000 0.000 0.000 0.263 0.895 0.982 0.995 0.997
THE DIMENSIONALITY OF POSTMATER1AUSM 157 The superiority of the two- and
three-dimen-sional models also becomes visible when the GFI are compared as an alternative measure of overall fit. Contrary to the measure reported up to now, the GFI is neither very sensitive to deviations from the normal distribution, nor does it depend on sam-ple size. Unfortunately, the absolute level of fit cannot be judged with the GFI, since its statistical distribution is unknown (Jdreskog and S6rbom, 1986:1. 41). Hence, although the fit clearly improves as more factors are extracted, the significance of the gain cannot be assessed.
Disregarding the violation of the distributional assumptions for the moment, the conclusion seems clear: there are several dimensions underlying the ranking of the Inglehart items. This raises the ques-tion of how the dimensions have to be interpreted substantively. As in conventional factor analysis, one has to look at the estimated factor loadings to answer this question (Table 3). Unstandardized fac-tor loadings are reported, since the standardized coefficients are difficult to interpret in the context of the model.8
Obviously, the first dimension corresponds to the well-known postmaterialist value dimension in all countries. As Inglehart would expect, the loadings of postmaterialist (marked with asterisks in the Table) and materialist items have opposite signs. In addition, country differences are small, although probably not random. When the loadings are com-pared with the estimates by de Graaf et al. (1989),
the differences are negligible. With respect to the structure of the first value dimension, their findings are thus replicated by the present study. As a consequence, Inglehartls index construction is corroborated by the findings. However, his one-dimensional theory of value change cannot explain the additional dimensions, and therefore an alterna-tive explanation is required. An alternaalterna-tive inter-pretation would be desirable too with respect to the first dimension, postmaterialism, since Inglehart^ theory has a weak foundation, as many critics have noted (Thome, 1985; Flanagan, 1987; Bockler etal., 1991; Klages, 1992).
As mentioned at the outset, the dimensions sug-gest an interpretation based on Habermas's (1987) theory of communicative action. The dimensions are then tied to different types of reactions provoked by the 'colonization'of the lifeworld, that is, its pene-tration by the growing econo-administrative complex. I have elaborated this interpretation else-where (Sacchi, 1994, in press). In the present context, I shall confine myself to a brief sketch of the basic idea. For this purpose, it is useful to succinctly recall Habermas's argument. Basically, he postulates that in modern societies, there is a dose connection between growing monetarization and bureaucratization on the one hand, and aggravating symptoms of reification on the other hand. The ten-dencies to the former are pushed ahead by the dynamic of economic growth and the attempt to contain its negative consequences through political
Table 3. UnsUmdardrftdfactorloading (Xj)
Items (cf. Table 1)
Maintain order More say: Government* Fight rising prices
Economic growth
Strong defence forces More say: Work* Stable economy Frght against crime
l^ess impersonal society* Ideas versus money*
N o . 1 2 3 5 6 7 9 10 11 12 Dimension 1 (Potential for resistance) FRG 0.257 - 0 . 2 9 4 0.253 0.663 0.649 - 0 . 0 4 6 0.379 0.590 - 0 . 9 4 4 -1.145 N L 0.642 -0.510 0.169 0.512 0.828 -0.776 0.336 1.150 - 0 . 9 0 5 -1.091 USA 0.284 -0.210 0.292 0.746 0.851 - 0 . 4 8 8 0.451 0.459 -0.978 - 1 . 0 0 6 Dimension 2 (Potential for withdrawal) FRG -0.552 0.438 0.029 0.680 - 0 . 3 9 0 0.749 0.183 -0.675 -0.190 -0.125 N L -0.458 0.372 0.173 0.424 - 0 . 2 0 4 0.586 0.138 -0.162 -0.456 -0.455 USA - 0 . 4 6 5 0.496 0.007 0.253 -0.106 0.956 0.145 - 0 . 4 4 3 - 0 . 2 6 0 -0.128 Dimension 3 (Disorientation) N L 0.076 -0.027 -0.324 0.033 - 0 . 0 8 6 -0.241 1.257 - 0 . 3 8 5 -0.061 - 0 . 3 2 0 USA 0.180 -0.211 - 0 . 2 4 5 0.351 0.125 0.038 0.272 -0.416 - 0 . 0 4 9 0.412
regulation and administrative intervention; thus, they are seen as inevitable concomitants of capitalist modernization. The tendency to reification refers to the consequences of the expansion of the econo-administrative complex from the perspective of the lifeworld.
The intervention of this complex into spheres which are crucial for the reproduction of the life-world — cultural reproduction, social integration, and socialization - implies reification and devalua-tion of cultural tradidevalua-tions. Essentially, the reason is that the steering media of the economic and political system - money and power - cannot substitute for communicative action in these respects. As a conse-quence, the intervention of the steering media in these spheres, that is the 'colonization', provokes var-ious reactions on the side of the lifeworld. In the present context, one possible reaction is of special interest, namely, legitimation crises giving rise to potentials for protest.
Habermas (1987: ii. 578 f.;1981) distinguishes two types of political potentials.The first corresponds to a conservative, anti-modernist potential, defending structural niches against the penetration by the steering media of economy and administrative system, the second represents a progressive, emancipatory potential that tries out new forms of co-operation and living together. The former 'potential for withdrawal' becomes manifest, for example, in the traditional middle-class protests against modern comprehensive schools or against rising taxes, whereas the latter 'potential for resis-tance' is mobilized by new social movements, particularly by alternative, ecology, peace, and youth movements.
Thus, the potentials represent specific types of opposition to the modernization values embodied in the institutional orders of the economy and the state. More specifically, they are both opposed to modernization, in so far as it implies economic growth and state expansion (Habermas, 1987: ii. 577). However, the two potentials advance their modernization critique from very different angles. In the case of the second, emancipatory potential the opposition is grounded in the anticipation of a more democratic and just social order. In contrast, the first potential is rooted in conservative or even authoritarian traditions appropriate for the defence of particularist interests and traditional forms of life.
Although both potentials try to contain the further assimilation of the lifeworld into the expanding sub-systems, their political alignment is very different: the former is attached to the View' right, the latter to the 'new' left.
With the above considerations in mind, one can now ask how members of both potentials are likely to rank the Inglehart items. To answer this question, it is useful to start with those items that apparently have an intimate connection to the opposition of system and lifeworld as described by Habermas. This holds true for three items. First, it has been mentioned that the critique of economic growth (item 5) is common to both potentials. Second, the item 'move towards a friendlier and less impersonal society* (item 11) points to disturbances in the process of social integration. Moreover, the opposi-tion of 'friendlier'and 'less impersonal' implies that these disturbances are rooted in the substitution of communicative action by more anonymous forms of action coordination, such as Habermas's steering media. Third, the claim 'move towards a society where ideas count more than money' (item 12) essen-tially points to tensions between cultural values and economic constraints. In Habermasis terms, the item relates to distortions in the process of cultural repro-duction due to an unbounded monetarization of society. It follows that members of both potentials should give low priority to economic growth, and at the same time have high priority for the contain-ment of the pathological symptoms caused by the penetrating steering media, as expressed by items 11 and 12. In addition, the other items concerned with the economic system (items 3 and 9) are also likely to have rather low priority for both potentials. However, their evaluation of the remaining items can be expected to be clearly different. The left, emancipatory potential is most likely to combine its critique of modernization with claims for partici-pation and democratization, as expressed by items 2 and 7. In contrast, the conservative potential com-bines a similar critique with insistence on the traditional social order to be defended against the disintegrating forces of modernization. Thus, con-fronted with the item-list, members of the conservative potential are likely to give high priority to items 1 and 10, expressing a strong concern for law and order. Hence, the positions of both potentials are antagonistic regarding the contradictory goals
THE DIMENSIONALITY OF POSTMATERIA1JSM 159
of further democratization versus the defence of the established order (see also Habermas, 1987: ii. 507).
The empirical findings meet these expectations very well, as the loading patterns in Table 3 indicate. In the case of the first dimension, a preference for democratization and the protection of the lifeworld against the penetrating steering media goes hand in hand with low priority for all economic issues in all countries. Thus, the postmaterialist pole of the fac-tor is consistent with the expectation of an emancipatory potential reacting against the 'colon-ization' process. It is noteworthy that Habermas (1987: ii. 576 f.) posits explicitly this link between the rise of the political potentials reacting to the 'colonization' process and the growing share of post-materialist values observed by Inglehart. Moreover, previous research demonstrates that postmaterialist values in fact are a strong determinant of protest activities and of membership in new social move-ments (Barnes and Kaase, 1979; Jennings et a/., 1990; Inglehart, 1990; Dalton and Kuechler, 1990; Opp, 1990 Rohrschneider, 1990; Sacchi, 1992, 1994). These findings corroborate the suggested notion of postmaterialism as a potential for protest. For the second factor, the loading pattern is simi-lar regarding the items directly pointing to the opposition of system and lifeworld. Hence, people expressing high priority for the protection of the lifeworld against the penetrating steering media are again grouped together at one pole. However, con-trary to the postmaterialist potential captured by the first dimension, this group shows a strong prefer-ence for conservative claims for law and order (items 1 and 10), and strong defence forces (item 6). Thus, the factor perfectly meets the expectation of a conservative potential provoked by the 'coloniza-tion' tendencies. This interpretation of the loading patterns is also supported by previous studies on a much broader selection of industrial countries (Sacchi, 1994, in press). They reveal that the under-lying potential corresponds to a conservative, religious group of predominantly elderly people. Most notably, this group expresses pronounced support for authoritarian and repressive policies, as advocated by the 'new' right.
Before interpreting factor three, it is useful to consider a possible objection to the outlined inter-pretation of dimensions one and two.9 At a theoretical level, the emancipatory 'potentials for
resistance'and the conservative 'potentials for with-drawal' represent mutually exclusive categories: a person cannot be modernist and anti-modernist at the same time. In contrast, the statistical model implies that there are at least some people with high scores on both dimensions, since the factors are orthogonal (i.e. uncorrelated). Accordingly, it could be concluded that the statistical model is incompatible with the theoretical assumptions. I think, however, that this conclusion is inappropriate for two reasons.
First, theory predicts that despite all ideological discrepancies both potentials are opposed to the further expansion of the econo-administrative com-plex. In particular, they share the critique of the negative consequences of economic growth. In this respect, a certain overlap of both potentials is evident, even though the remedies they advocate -democratization versus the defence of the estab-lished order - are mutually exclusive.
Second, even if one is ready to assume that the theory allows an unequivocal distinction between modernist and anti-modernist goals (i.e. items), it is an empirical question as to whether or not such logical contradictions are reflected by the evalua-tions of the respondents. From this point of view, the high internal consistency of the two main dimensions inherent in the rankings is the remark-able finding, and not the observation that some respondents express preferences, which are self-con-tradictory in theoretical terms. People's claims are quite often paradoxical; for example, members of ecology movements generally advocate leftist and participatory reforms, while at the same time being clearly anti-modernist in other respects (Christ-mann, 1992; Rucht, 1988: 307 f). Taking the above arguments together, it is evident that an overlap of these two potentials does not undermine the sug-gested interpretation.
Turning to factor three, the loading patterns are difficult to interpret with reference to Habermas's theory. In addition, only some of the loadings are substantial and country differences seem more pro-nounced. Nevertheless, construct validation for a larger sample of industrial countries has revealed that the third dimension seems to be invariantly tied to an anomic, lower-class potential recruiting itself from the declining 'old' left (Sacchi, 1994, in press). Its outstanding characteristics are high scores
on various indicators for political disorientation and alienation. Although such potential is not explicitly predicted by Habermas, it is in line with his argu-ment. Specifically, he maintains that the interplay of colonization tendencies and the growing distance between expert cultures and the broader public implies disorientations and political apathy (Haber-mas, 1987: ii. 521 f.). It seems plausible that these phenomena arc more prevalent among lower social strata with less education and cognitive resources. Hence, the type of potential tied to the third factor is consistent with his theoretical expectations.
Moreover, the loading patterns also gain a cer-tain plausibility when interpreted against this back-drop. First, the loadings essentially indicate that the potential puts most weight on the items 'fight rising prices'and 'fight crime', while giving low priority to the items referring to the economic system. It seems reasonable that the former goals have a more obvious usefulness for disoriented people with a poor under-standing of politics, than the relatively abstract claims referring to the performance of the economic system. Second, if the underlying potential is inter-preted as a specific reaction to 'colonization' tendencies, it has to be explained why the contradic-tion of system and lifeworld is not consistently reflected by the loadings of the respective items (5, 11, and 12). Some of these loadings are close to zero, while the loading of item 12, which is substantial, does not show the expected sign for the United States. However, if disorientation is in fact the main characteristic of the underlying potential, its recognition of the contradiction between system and lifeworld will not be consistent almost by definition. Correspondingly, the loadings of the respective items are almost accidental and difficult to interpret. In sum, the loading pattern is quite understandable when related to the aforementioned construct validation, which shows that the third factor captures a lower-class potential of disorien-tated and alienated people.
Whether or not the suggested interpretation of the multi-dimensional solution is valid strongly depends on the assumption that the dimension are accurately estimated by the applied measurement model. Moreover, any interpretation of the above results is contingent on this assumption. In the next section I will therefore investigate the proper-ties of the measurement model, especially its
ability to assess number and structure of latent dimension implied by a set of rankings.
The Monte Carlo Simulation
Monte Carlo experiments can be defined as a method of investigating the performance of statisti-cal models and estimation techniques by applying them to artificially generated data-sets (Vogt, 1993). Hence, Monte Carlo simulation is an obvious way to examine some properties of the measurement model for ranked preference data, which has rarely been applied up to now. Thus, to some degree its applicability remains unclear (Jackson and Alwin, 1980: 229).
Below, the properties of the model will be tested with artificial data-sets that are drawn from the observed ranking data. The construction of data-sets for simulation relies on various theoretical assumptions about the structure of observed data. Because the structure of the artificial data is known, it can be used to test the ability of the model to uncover its 'true' structure. A limitation of this research strategy, however, is that the results cannot be generalized, given the specific assump-tions introduced for simulation. For the present article, the Monte Carlo experiment is designed to answer the following questions:
1. Is there a reliable criterion, and if so, which one, for deciding on the number of factors, that is, the dimensionality, within the framework of the Alwin-Jackson model for ranking data? 2. Do the loading patterns of the factors properly
reflect the structure of the underlying dimen-sions; and is the measurement model in this respect really superior to conventional factor analysis?
To start with, artificial data with known dimen-sionality, structure, and properties similar to those of the observed rankings have to be generated. In order to create such data, four assumptions about the measurement process and the nature of the latent value dimensions have to be introduced. Regarding the value dimensions, I first assume that they are independent and normally distributed. Second, it is assumed that the items have clear and identical meanings for all respondents, implying that they unambiguously mark positions in a value space
THE DIMENSIONALITY OF POSTMATERIAUSM 161
defined by the independent dimensions. This is rather a strong assumption, of course, which, how-ever, will be somewhat relaxed later by introducing an error term. Third, it is taken for granted that the evaluation of the items reflects the degree of agree-ment between item content and respondents' value orientations. Consequently, these evaluations may be expressed as (Euclidean) distances in the value space:
where
dg Euclidean distance between item / and
respondent/, including measurement error
fid position of item / on value dimension k jig position of respondent^ on value
dimen-sion k
n number of value dimensions
6 measurement error
Hence, the smaller the Euclidean distance between respondent / and the position of itemy, the 'closer* respondents' values and item-content. The Euclidean distances thus correspond to scale-invar-iant ratings of the items. As required by the measurement model, these evaluations - which unfortunately cannot be measured directly in empirical studies - do not have ipsative properties until they are subject to ranking (Jackson and Alwin, 1980: 222). From the third assumption, it follows that respondents, when asked to rank the items, will give highest priority to the item with the smal-l e s t ^ second priority to the item which is next, and so on. The transformation of the Euclidean dis-tances into rankings is thus straightforward. The fourth and last assumption refers to measurement error. It is supposed that respondents' evaluations contain an uncorrelated, normally distributed error component (e), representing, for example, random disturbances from the interview situation, or hazy item-formulations. The error is expected to affect only respondents' evaluations ((!£), not the ranking procedure itself. This seems to be a reasonable assumption, however, as an examination of the con-sistency of the observed rankings reveals.
These not-too-restrictive assumptions are suffi-cient to generate data-sets for the Monte Carlo experiment. Three data-sets comprising a different
number of latent value dimensions are generated. First, I will create a data-set with a one-dimensional structure, which will then be extended by additional dimensions. Since the existing dimensions remain unchanged, when a further dimension is added, the three data-sets have a nested structure. When the measurement model under investigation is used to analyse the artificial data, its capacity to assess the dimensionality correctly can be clarified. Provided that the model meets the expectations and that the fit statistics are not seriously affected by the skewed distributions, the model fit should be sufficient, as soon as all dimensions built into the data-sets have been extracted.
The generation of the data-sets starts with the creation of three uncorrelated, normally distributed random variables - each representing one indepen-dent value dimension - with a zero mean and a standard deviation of one.10 The number of cases is set at 700, that is, roughly the average of the three samples analysed in the previous section. In order to calculate the dg evaluations, it is necessary to
define the positions of the items on the value dimen-sions. By analogy with Ingleharts measurement instrument, twelve items are provisionally distribu-ted on the dimensions, so that their positions roughly reflect the pattern or observed factor load-ings (Table 3). Consequently, when the measurement model is applied to the artificial data, a similar factor pattern should be extracted from the artificial data. Once that the item-positions on the dimensions are defined, the Euclidean distances can be calculated and transformed into rankings. As in the original measurement procedure, the items are ranked in two separate groups of four and eight items.11
Yet, as mentioned above, the artificial data should possibly have the same properties as the observed rankings. This is especially important regarding the distributional properties of the rank-ings, which hinder an unequivocal assessment of dimensionality. The reason is that the skewed dis-tributions of the rankings may distort the j^-test, which is crucial when deciding on the number of underlying dimensions. In principle, the artificial rankings become more skewed the more the respective item is moved towards the extremes of a value dimension. Hence, the distributional prop-erties of the artificial data can be adjusted to the observed rankings by varying the item-positions.
As a reference, I choose the German sample, where the deviations from normal distribution are the most pronounced. Table 4 presents the respective descriptive statistics for the original German data, and the artificial one-dimensional data-set. As in the previous section, one item of each separate ranking has to be excluded from analysis, in order to correct for ipsativity. It turns out that the observed distribution can be very well reproduced by moving the items on the dimen-sions. The same also holds for the two- and three-dimensional artificial data-sets (not shown).
Artificial and observed rankings should not only have similar distributions, the correlations between the rankings should also be similarly strong. The level of correlation among the artifi-cial rankings is primarily a function of the amount of error variance (£). It turns out that the level of correlation among the artificial ranks approaches the observed level, when the variance of the error term is set at 1.5. For example, the resulting correlations range from —0.49 to 0.37
for the one-dimensional data-set, which is almost the same as the correlation observed in Germany ( — 0.49 to 0.34). A very similar range is found for the other data-sets, observed as well as artificial. Now, the artificial rankings with known dimension-ality are ready for analysis. This allows us to test the capacity of the measurement model and fit statistics to filter out the known underlying structure.
The analysis follows the same steps as in the pre-vious section. First, the number of underlying dimensions is determined. Then, the structure of the dimensions is inspected. The factors are extracted step by step with ULS, and after each extraction the model fit is evaluated. An overview of the results is found in Table 5. The main conclu-sion is that, despite the violated distributional assumptions, the ^-test is unbiased. The fit is not acceptable, until all built-in dimensions have been extracted; for the correct models, in contrast, it is very good. It is noteworthy that the behaviour, not only of the X2-test but also of the GFI is almost the same as in the empirical application (cf. Table 2).
T a b l e 4 . Monti Carlo simulation: distriimtions of observed versus artificial ranking
Descriptive statistics Item 1 Item 2 Item 3 Item 5 Item 6 Item 7 Item 9 Item 10 Item 11 Item 12 Observed rankings Mean 1.9 2.9 1.9 4.4 5.7 4.6 1.9 3.1 5.3 5.6 Standard deviation 1.0 1.0 0.9 2.1 1.9 1.9 1.4 1.7 2.1 2.0 (Germany, N Skewness 0.6 - 0 . 6 0.7 0.0 - 0 . 4 0.0 1.9 0.8 - 0 . 4 -0.7 = 822) Kurtosis - 0 . 6 -0.7 - 0 . 4 - 1 . 0 - 0 . 8 - 0 . 8 3.9 0.1 - 0 . 9 - 0 . 5 Artificial rankings ( N = Mean 2.1 2.7 2.0 4.6 5.7 4.2 1.9 3.3 5.0 5.5 Standard deviation ! 1.0 1.0 1.0 2.0 2,0 2.0 1.4 2.0 2,0 1.9 700) Skewness Kurtosis 0.4 - 0 . 4 0.6 0.0 - 0 . 4 0.0 1.7 0.6 - 0 . 2 - 0 . 4 - 1 . 0 - 0 . 9 -0.7 -1.1 - 1 . 0 - 1 . 0 2.8 -0.7 - 1 . 0 - 0 . 6
T a b l e S . Monti Carle simulation: assessing the numbtrof 'Intent dimensions
'True' structure of the data-set N = 700 Extracted factors df* o n e - d i m e n s i o n a l Za P GFI two-dimensional three-dimensional 3 P GFI 1 2 3 33 33(23) 33(13) 38.91 -0.221 -0.999 -306.4 28.2 -0.000 0.704 -0.962 0.999 -204.7 85.6 27.0 0.000 0.000 0.760 0.978 0.994 0.998
THE DIMENSIONALITY OF POSTMATER1ALJSM 163 Given that the results of Monte Carlo studies
strongly depend on the defined simulation condi-tions, one may ask how robust the finding is. Therefore, I have attempted to test the influence of some crucial conditions on the reliability of the jf 2-test. Sample size, error variance, and item discrimin-ability are considered as relevant conditions. Regarding sample size, it can be shown that the test is robust. Even when size of the artificial samples is increased by factor two or three, only the correct models are accepted. When the influence of mea-surement error is investigated, the test again proves to be very reliable, though only above a certain level of random error. As Figure 2 shows, the correct one-dimensional model is accepted if the variance of the
error term is greater than one (p > 0.05). In contrast, the true model would be rejected at lower error levels. This finding, which is perhaps rather aston-ishing at first sight, seems to result from the increase in correlations between the rankings accompanying every error reduction. Above a cer-tain correlation level, the absolute size of the residuals begins to exceed what might be expected by chance, even though their relative magnitude, remains unchanged. In addition, the loss of information implied by the ordinal level of measure-ment may reduce the fit more, when there is less noise in the data. However, the fit statistic gives accurate results, as soon as the correlations are con-strained to the empirically observed range by
X (df = 33) 90 n 80- 70- 605 0 - 40- 30-20 o 'S
8
"8
tos
Model-Fit <X2) 0.0 0.5 3.0\ I i
-.99 to -.63 to +.95 +.58 1.0 1.5 2.0 2.5 Variance of the error term (e)t t t
-.53 to -.49 to' -.47 to -.47 to +.43 +.37 +.33 + 3 0
Corresponding correlation-range between rankings
3.5 4.0
I ! I
-.47 to +.28 -.46 to +.25 -.45 to +.22 Figure2. MonUG^simulation:tbeimpactofma&mmttderrorontbcfitofa<mt-jiutormo<klapplttdtoao^blowing up the error term slightly. This is true for the grey area in Figure 2.
A third condition that may influence model fit is item discriminability, that is, the degree of distinc-tion between the item meanings with respect to a latent dimension. In fact, it can be demonstrated that the number of factors may be underestimated, when all items are closely clustered on a dimension. In this case, a sufficient fit may result, even if a minor factor with small variance has not been extracted. Much more important, however, is the fact that — even for large samples and a very unreliable measure-ment — the number of dimensions is not overestimated, that is, the extracted factors are not artefacts. Since the present simulation draws strongly on the Inglehart items, it remains somewhat unclear whether this result can be generalized to other applications. As long as the distributional assumptions are not violated anymore than in the present example, a generalization nevertheless seems quite reasonable.
The second question to be answered concerns the internal structure of the dimensions. Do the extracted factors give a realistic idea of the underly-ing dimensions? To answer this question, the following consideration is useful: the measurement model is designed to estimate the factor loadings of a set of non-ipsative evaluations underlying the observable rankings. In the Monte Carlo simulation, the <4 distances represent these underlying evalua-tions. Thus, when conventional factor analysis is applied directly to the dp the resulting loading
pat-terns should be close to those estimated by the measurement model on the basis of rankings. Per-fect correspondence cannot be expected for two reasons. First, the transformation of the d$ distances into rankings implies a loss of information; the latter being only a raw, ordinal approximation of the underlying d^. Second, strictly speaking, the mea-surement model does not estimate the factor loadings, but their deviations from the average load-ing (Jackson and Alwin, 1980: 231). In empirical applications, the average loading is unknown, so that there is a certain ambiguity in the interpretation of the loading patterns. For the present study, it seems plausible that the average loading is close to zero, since the items have opposite signs. Neverthe-less, the loading pattern is to some degree open to interpretation. In the simulation, the underlying
'true' factor pattern may be calculated by applying conventional factor analysis directly to the d^ dis-tances.12 The calculation is based on the three-dimensional data-set.
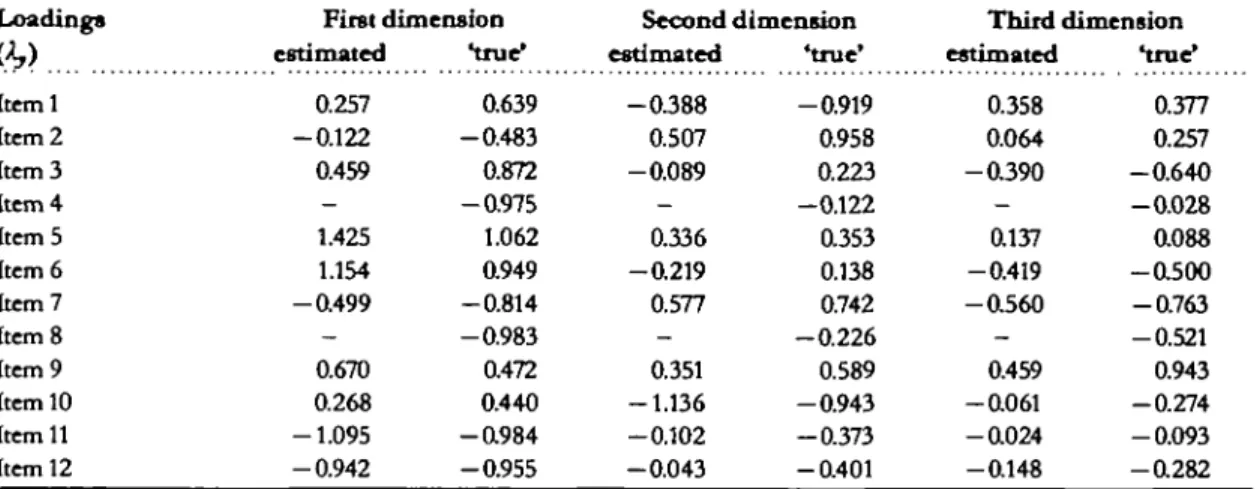
The loading patterns of the underlying non-ipsa-tive factors, as well as those estimated with the measurement model, are presented in Table 6. At first, it is striking how well the structure of the observed value dimensions can be reproduced artifi-cially (cf. Table 3). Of course, the aim was to reconstruct the structure of the observed dimen-sions by positioning the items, but nevertheless the quality of the reproduction comes as a surprise. The findings are thus in favour of both the design of the Monte Carlo experiment and the measurement model under investigation. Second, the results in Table 6 also suggest that the model is able to uncover the structure of underlying dimensions. There is a high degree of correspondence between the 'true' loadings directly extracted from the dy evaluations, and the estimates of the measurement model based on rankings. The latter thus seem to be interpretable in the usual way, despite the fact that they represent estimated deviations from the average 'true' loading. Since the average 'true' loadings are very close to zero, the estimated loadings remain more or less unchanged when the 'true' mean is subtracted. This, however, will only hold when there arc two item-groups with opposite loadings on a factor, as is the case for the Inglehart items.13
One might wonder whether the Alwin-Jackson model is in fact superior to standard factor analysis in capturing the structure of latent dimensions. In order to answer this question, standard factor analy-sis is also applied to the twelve rankings. Hence, the estimated loadings may be compared with those in Table 6, allowing us to judge whether the measure-ment model really performs better than the standard technique, and whether the warnings against its use are justified for the present application. The results arc in favour of the model. This can be illustrated by correlating 'true' and estimated loadings separately for the competing techniques. The correlations (Pearson's r) between standard estimates and 'true' loadings are 0.92 for the first, only 0.62 for the second, and 0.72 for the third factor. The respective correlations for the model estimates in Table 6 (0.94, 0.87, and 0.96) indicate a much higher degree of correspondence, especially regarding factors two
THE DIMENSIONAUTYOF POSTMATERIAUSM 165
Table 6. Monte CaHo simulation: modtl estimates and 'trut'factor loading
Loadings First dimension
estimated Hrue' Second dimension estimated 'true' Third dimension estimated 'true' Iteml Item 2 Item 3 Item 4 Item 5 Item 6 Item7 Item 8 Item 9 Item 10 Item 11 Item 12 0.257 -0.122 0.459 -1.425 1.154 -0.499 -0.670 0.268 -1.095 -0.942 0.639 -0.483 0.872 -0.975 1.062 0.949 -0.814 -0.983 0.472 0.440 -0.984 -0.955 - 0 3 8 8 0.507 -0.089 -0.336 -0.219 0.577 -0.351 -1.136 -0.102 -0.043 -0.919 0.958 0.223 -0.122 0.353 0.138 0.742 -0.226 0.589 -0.943 -0.373 -0.401 0.358 0.064 - 0 3 9 0 -0.137 -0.419 -O560 -0.459 -0.061 -0.024 -0.148 0.377 0.257 -0.640 -0.028 0.088 -O500 -0.763 -0.521 0.943 -0.274 -0.093 -0.282
: The HIM hems (4,8) u before are m-rnrlecj for eKururioa with the measurement model.
and three. Particularly when more than one factor is extracted, the standard estimate of the loading pat-tern is biased, and, therefore, the Alwin-Jackson model should be applied.
It is not clear to what extent this conclusion can be generalized. In any event, the effect of ipsativity — corrected quite successfully by the model — may be expected to be even stronger in many applications. The potential bias is especially large when the mea-surement is based on one ranking only, and/or the number of items is lower than in the present exam-ple. All in all, results suggest that under such conditions conventional factor analysis is not appro-priate, especially when the final solution has more than one dimension.
The findings - showing that the statistical model performs well - allow us to return to sub-stantive problems. Since results are promising, the model can now be used to address two unresolved problems, namely the importance of country differ-ences in the loading patterns (next section), and the stability of the dimensions over time (final section).
Cross-National Variation in the
Dimensions
In this section the importance of national differ-ences regarding the three dimensions, or more precisely, the loading patterns in Table 3, will be assessed. Is there non-random national variation,
and if so, do the dimensions nevertheless reflect var-iants of a common cleavage structure? If the interpretation in Habermas's framework is valid, there should be a common pattern, reflecting the contradiction of system and lifeworld. Nevertheless, a limited, but substantial, variation between the countries may be expected for two reasons. First, one of the 'colonizing' subsystems, namely, the state, is a national institution by definition. Although the autonomy of government seems to be more and more reduced due to the globalization dynamic, particularly of the economy, differences in political systems and programmes can still not be disregarded. Second, actors interpret the basic con-flict between system and lifeworld in the light of country-specific traditions of political culture. Thus, their understanding of the conflict will be influenced by specific ideologies and traditions. These arguments suggest that despite an invariant basic structure, the dimensions are unlikely to be identical.
T h e importance of country variations can be assessed with a multi-sample analysis, where the fac-tor loadings are constrained to be equal over countries (Joreskog and Sorbom, 1989: 227). T h e resulting fit should not be significantly worse than that of an unrestricted model, provided that the loading patterns arc equal in all countries. T h e respective models with one, two and three factors are again estimated step by step with ULS. Results show that the loading patterns are not identical for
the three countries under investigation (Table 7). It should be noted that the extraction of additional fac-tors is based on the better-fitting models without equality constraints. In addition, since no third fac-tor was found for Germany, the three-dimensional models are compared for the United States and the Netherlands only.
Differences between constrained and uncon-strained models in the right column of Table 7 are significant in all cases (Long, 1983: 65 Q. Thus, the loading pattern differs over countries for all three dimensions. The level of cross-national variation is quite low, however, and the factors therefore seem to represent national variants of a common structure, rather than completely different dimensions. This becomes obvious, when the j^-gain due to the extraction of a specific dimension is compared with the loss caused by the equality constraints.M These gains are approximately six times higher than the respective losses for dimensions two and three, and some fifteen times higher for the first dimension. With respect to dimensions one and two, the finding thus confirms the impression derived from a visual inspection of the loading patterns in Table 3: all loadings have the same signs and, with some signifi-cant exceptions, also similar magnitudes for all countries. In contrast, it comes as a surprise that country variation also appears to be relatively small for the third factor, even though this is partly due to the lower power of this test.15
Similar evidence for a broader pool of industrial countries, also based on visual comparison of load-ing patterns, is thus corroborated by this more systematic test (cf. Sacchi, 1994). This is in line with the expectation that the factors tap essentially iden-tical conflict dimensions in different industrial
societies. Therefore, any explanation should refer to general characteristics of those societies.
Aggregate and Individual-Level Stability
of the Dimensions
The question of whether the dimensions are stable over time is crucial not only in Inglehart's frame-work, but also for the interpretation suggested above. First, with regard to Inglehart's theory, one of the key assumptions is the so-called 'socialization hypothesis', maintaining that (postmaterialist) value orientations remain stable in adulthood. Without this basic assumption, the central expectations of an intergenerational value change towards a more postmaterialist society cannot be justified. Because of its crucial importance, the assumption has often been tested empirically, with controversial results (van Deth, 1983a, 1989; Bdltken and Jagodzinski, 1985; Inglehart, 1985, 1989; Langeheine, 1987a, 1987*; Jagodzinski, 1987a, 1987*; Mnich, 1989; Sac-chi, 199W). The most convincing attempt is that by de Graaf etal. (1989), to which I have already referred several times. Their findings suggest that postma-terialist values are very stable in the United States and the Netherlands, and somewhat less stable in Germany. Overall, Inglehart^ socialization hypo-thesis is corroborated.
Building on Habermas, it is difficult to derive precise expectations regarding the stability of post-materialism. The same also holds for the additional dimensions. However, some guesses may be derived from Habermas's argument that the probability of lifeworld reactions is smaller for the core strata directly involved in the production process
Table 7. Asscssmtnt of country differences in the loadingpatttrns
Equality constraints over countries* Extracted unconstrained loadings equal loadings
factors x3 df* y2 df* Country Differences y2-Diff. df P 1 2 3 599.0 230.3 72.8 99 99(89) 66 (46) 675.1 284.6 95.8 119 119 (109) 76 (56) 76.1 54J 21.0 20 20 10
oooo
0.000 0.020"Extraction builds on the better fitting models without equality constraints.
THE DIMENSIONALITY OF POSTMATERlAUSM
(Habermas, 1987: ii. 577; see also de Graaf ctal., 1989; Bornschier and Keller, 1984; Sacchi, 1991*. 1994). Since the degree of integration into this productive core, that is, into the 'colonizing* subsystems, varies over the life-course, some change may be antici-pated at the individual level. When this general argument is combined with empirical findings, even more precise expectations can be derived. It is well known that postmaterialist values are more widespread among young people, especially the well-educated entering late into the labour force. Moreover, the conservative potential captured by the second dimension seems to be strongest among elderly and retired people (Sacchi, 199LJ, 1994; see also Bornschier and Keller, 1994). Hence, the transi-tions into and out of the labour force, or the core strata, may be expected to have specific effects on each value-dimension, implying that they arc not entirely stable at the individual level. An additional hypothesis concerns their stability at the aggregate level. If the factors indeed capture deep-rooted con-flict dimensions emerging from long-term modernization processes, they will be more or less invariant in the short run. Consequently, at the level of countries, the structure of the dimensions should be approximately stable over a medium-range observation period.
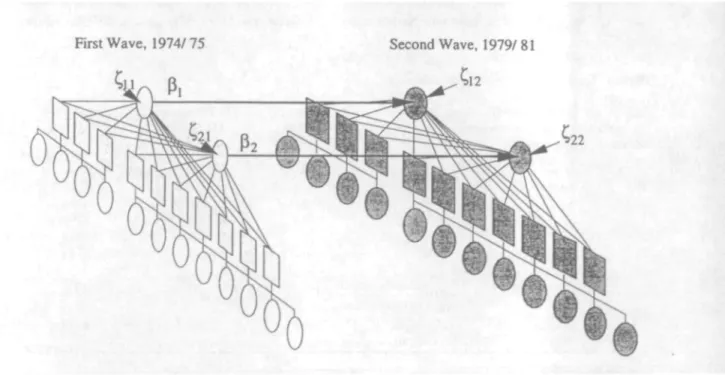
In order to test the stability of the dimensions at the aggregate as well as the individual level, the data from both panel waves arc analysed simultaneously. The second wave was carried out between 1979 and 1981, that is, about six to seven years after the first wave in all countries (Zentralarchiv fur empirische Sozialforschung, no date). Thus, the observation period is long enough to allow for a quite powerful test of the stability assumptions outlined above. In addition, due to the length of the interval, test-ret-est effects can almost be excluded.
A two-dimensional example of the modified mea-surement model for the panel is sketched in Figure 3. The submodels for the two waves now analysed simultaneously correspond to the model shown in more detail above (Figure 1). Together with the para-meters of these submodels, the model estimates the stability of the latent dimensions over the observa-tion period. The standardized coefficients (/?j) measure the individual-level stability of the dimen-sion, taking into account attenuation. First, an unconstrained baseline model is estimated. Then, it is compared with a model with equal factor loadings for both waves. If the dimensions are stable at the aggregate level, the fit of this second model should not be significantly worse. The three dimensions and the respective stability coefficients are again
First Wave, 1974/75 Second Wave, 1979/81
Cl2
'22
extracted step by step, and all parameters related to a given dimension are fixed on their estimates, when additional factors are extracted. Once all factors are extracted the model fit can be judged and additional restrictions may be introduced, or relaxed, if neces-sary. This especially refers to the rather strong implicit assumption that the latent dimensions are the only source of correlations between rankings over time. Since the number of dimensions is known from the cross-sectional part of the analysis, it seems reasonable to test this assumption after ter-minating extraction.
The first extraction step corresponds to a replica-tion of de Graaf et al.'s (1989) analysis of the intragenerational stability of postmaterialism. The only difference between their analysis and the pre-sent study is that the latter relies on ULS, whereas de Graaf et al. used ML. Regarding the first dimen-sion, results of both estimation techniques are similar, although not identical. A first common result indicates that the constrained model with equal loadings for both time-points has a better fit than the unrestricted model (de Graaf et al., 1989: 190, table 8). The ^-values show only a very small increase, which is not significant (p>0.10). Thus, the first dimension was stable over the observation period in all countries. Second, the findings are also very similar with respect to the stability coeffi-cients ( /?]) for the United States and the Netherlands.
Stability is highest for the Dutch sample, and, as already noted by de Graaf eta/., the fit even improves when perfect stability is assumed (fix = 1) by setting
the residual variance (Cu) t o zero. Possibly, some readers will not have much confidence in stability coefficients of this magnitude, however, the argu-ments against LISRELs correction- for attenuation do not hold in the present case (see de Graaf et al., 1989).16 Moreover, stability seems to be exception-ally high in the Netherlands even over a panel interval of eleven years. De Graaf et al. (1989: 183) found a stability coefficient as high as 0.87 for this time-span. Stability is also very high for the United States, where the respective coefficient of 0.86 comes close to the estimate by de Graaf et al. (0.81). The only remarkable difference between the find-ings concerns individual-level stability in Germany. De Graaf et al. - using ML-estimation - found a medium stability coefficient of 0.68. In contrast, the ULS estimate for Germany is 0.48, indicating rather low stability. Thus, both studies lead to the conclu-sion that stability is lower in Germany than in the other countries. The size of this difference seems to be considerably underestimated when using ML instead of ULS, which is superior, since does it not require a multinomial distribution. As a conse-quence, the level of stability in Germany is hardly consistent with Inglehartls socialization hypothesis. De Graaf et al. (1989: 193) explain the low stability
Table 8. Comparison oj'tbtfitof'varioustvo-vavt models
Number of factors 1 1 2 2 3 3 Models with 2/3/3 2/3/3 Model specification: Equality constrainti over waves" none equal Xj none equal Xj none equal Xj item-specific factors: equal Xy, ufl
equal Xj, ufl, ip i dfi 165 174 165 (154) 174 (163) 165(143) 174 (152) 172/171/171 (161/149/149) 184/183/183 (173/161/161) West Germany (N = 702) •e 550.1 563.4 308.0 322.5 -293.4 330.2 The Netherlands ( N = 508)
x
2 829.7 830.0 598.2 611.0 334.4 343.9 243.2 254.2 United States ( N = 716)z
3 929.2 932.3 622.6 629.4 526.9 530.2 405.7 445.4The loadings of previously extracted facton are constrained to be equal ora wives for*?models. ''Degrees of freedom for the respective atraction step tnd for the entire model (in brackets).