HAL Id: tel-02309181
https://pastel.archives-ouvertes.fr/tel-02309181
Submitted on 9 Oct 2019HAL is a multi-disciplinary open access archive for the deposit and dissemination of sci-entific research documents, whether they are pub-lished or not. The documents may come from teaching and research institutions in France or abroad, or from public or private research centers.
L’archive ouverte pluridisciplinaire HAL, est destinée au dépôt et à la diffusion de documents scientifiques de niveau recherche, publiés ou non, émanant des établissements d’enseignement et de recherche français ou étrangers, des laboratoires publics ou privés.
Numerical modeling of hydraulic stimulation and
induced seismicity in deep geothermal reservoirs
Dac Thuong Ngo
To cite this version:
Dac Thuong Ngo. Numerical modeling of hydraulic stimulation and induced seismicity in deep geothermal reservoirs. Applied geology. Université Paris sciences et lettres, 2019. English. �NNT : 2019PSLEM012�. �tel-02309181�
Préparée à MINES ParisTech
Numerical modeling of hydraulic stimulation and induced
seismicity in deep geothermal reservoirs
Modélisation numérique de la stimulation hydraulique et de la
sismicité induite dans des réservoirs géothermiques profonds
Soutenue par
Dac Thuong NGO
Le 27 juin 2019 Ecole doctorale n° 398Géosciences, Ressources
Naturelles et Environnement
SpécialitéGéosciences et géoingénierie
Composition du jury : Hervré, CHAURISProfesseur, MINES ParisTech Président Patrick, SELVADURAI
Professeur, McGill University Rapporteur
Jean, SULEM
Professeur, École des Ponts ParisTech Rapporteur
Eva, SCHILL
Professeur, University of Darmstadt Examinateur
Michel, GARCIA
Docteur, KIDOVA Invité
Frédéric, PELLET
Professeur, MINES ParisTech Directeur de thèse
Dominique, BRUEL
1
Résumé
La géothermie est une source d'énergie renouvelable pouvant servir de base pour la production d'électricité ou le chauffage, sans ou avec une émission limitée de gaz à effet de serre. Cependant, le développement et l'exploitation des réservoirs géothermiques profonds s'accompagnent généralement d'une sismicité induite - un effet secondaire qui peut susciter de vives inquiétudes auprès du public et empêcher une utilisation à grande échelle de l'énergie géothermique. La pièce maîtresse d’une installation géothermique est un échangeur de chaleur, c’est-à-dire un réservoir, situé dans des roches chaudes en profondeur. Ce réservoir de roche est créé en utilisant la technique de la stimulation hydraulique, qui consiste essentiellement à injecter un fluide à des pressions élevées pour créer de nouvelles fractures hydrauliques qui se connecteront au réseau de fractures ou de failles préexistantes. Ce faisant de nouvelles voies pour la circulation du fluide seront créées et la surface d’échange de chaleur sera considérablement augmentée.
Plusieurs processus physiques couplés interviennent lors de la stimulation et de l’exploitation de réservoirs géologiques profonds. Il s’agit essentiellement de la déformation et de la rupture de la roche, de l’écoulement du fluide, et des variations de température. Ces processus couplés et dépendants du temps sont à l’origine de la propagation des fractures et de la réactivation de failles, responsable de la sismicité induite.
Cette thèse de doctorat est axée sur l'utilisation de simulations numériques dans le but de mieux comprendre le comportement thermo-hydro-mécanique des réservoirs géothermiques fracturés et de déterminer le potentiel de sismicité induite. La propagation des fractures hydrauliques et la réactivation de failles préexistantes sont modélisées à l'aide du concept de matériau cohésif en combinaison avec des éléments finis cohésifs et en tenant compte des processus physiques sous-jacents (par exemple, écoulement de fluide, déformation de la roche). Différents facteurs pouvant avoir un impact majeur sur la propagation de la fracture et la réactivation de la faille sont étudiés, tels que le frottement des failles préexistantes, le débit d’injection de fluide et l’orientation des failles. Les variations de température résultant de
2
l'injection et de la circulation d'un fluide pouvant avoir un effet à long terme sont également étudiées séparément.
La sismicité induite est ensuite étudiée sous l'angle de l'utilisation de la loi de la conservation de l'énergie afin d'expliquer le mécanisme de génération d'ondes élastiques consécutif à la rupture. Le processus de conversion de l'énergie de déformation accumulée dans un système avant la rupture en énergie cinétique pendant la rupture, quelle que soit la vitesse avec laquelle la charge externe est appliquée au système, est clairement démontré. Cette approche permet de bien comprendre les facteurs qui ont un impact majeur sur l'intensité des ondes sismiques induites. Ensuite, une procédure de modélisation est proposée pour calculer les accélérations maximales induites à la surface du sol par le glissement de la faille. Ces accélérations sont utilisées pour évaluer l'intensité du séisme en relation avec la perception humaine des ondes sismiques et l'endommagement causé aux infrastructures, participant ainsi au processus d’acceptation par le public de tout nouveau projet d’exploitation géothermique.
3
Abstract
Geothermal energy is a renewable resource that can provide base-load energy for electricity production or heating purposes without, or with limited, emission of green house gases. However, the development and the exploitation of deep geothermal power plants is usually accompanied by induced seismicity – a side effect that can raise serious concerns to the public and may prevent large-scale application of geothermal energy. The centerpiece of a deep geothermal power plant is a heat exchanger, i.e., a reservoir, located in hot rocks at depth. This rock reservoir is created using a hydraulic stimulation technique, which essentially consists of injecting fluid at high pressures to create new hydraulic fractures that will connect with pre-existing fractures/faults, thus multiplying possible pathways for fluid circulation. Multiple physical processes are involved during the stimulation and exploitation of the rock reservoir, including fluid flow, rock deformation of the rock, and temperature changes. These processes are the origin of the rock failure (e.g., fracture propagation, fault reactivation) that is responsible for the induced seismicity. In return, the induced seismicity can be regarded as a real-time indicator of the spatial progress of the reservoir during hydraulic stimulation.
This doctoral research focuses on the use of numerical simulations to better understand the behavior of fractured geothermal reservoirs and the potential of induced seismicity. The propagation of hydraulic fractures and the reactivation of pre-existing faults are modeled using the cohesive material concept in combination with finite cohesive elements and taking into account the underlying physical processes (e.g., fluid flow, rock deformation). Various factors that may have a major impact on fracture propagation and fault reactivation are investigated, such as the friction condition of the pre-existing faults, the fluid injection rate, and the fault orientation. Temperature changes resulting from fluid injection and circulation that may have a long term effect are also separately investigated.
The induced seismicity is first studied from the standpoint of using the law of energy conservation in order to explain the mechanism of elastic waves generation due to failure. The process of converting the strain energy accumulated in a system prior to the failure into kinetic
4
energy during failure, regardless of how slowly the external load is applied to the system, is clearly demonstrated. This approach provides a good understanding of the factors that have a major impact on the intensity of the induced seismic waves. A modeling procedure is then proposed to calculate the peak ground accelerations that are induced by the fault slip. The computed accelerations on the ground surface are used to assess the earthquake intensity, the human perception of the seismic waves, and the damage potential to infrastructures.
5
Acknowledgement
I am grateful to the many people who participated in different ways in the success of my doctoral research.
First of all, I express my sincere gratitude to my advisors: Prof. Frédéric Pellet and Dr. Dominique Bruel, who entrusted me with this research topic. They gave me a lot of encouragement and guidance during my work at the Center for Geosciences of MINES ParisTech. Their advice was very valuable.
I thank Prof. Patrick Selvadurai from McGill University and Prof. Jean Sulem from Ecole des Ponts ParisTech for their acceptance of being the reviewers of my research work. I greatly appreciated their advice and all the discussions I had with them.
I thank Prof. Hervré Chauris from MINES ParisTech, who accepted to be president of the jury, as well as Prof. Eva Schill from University of Darmstadt and Dr. Michel Garcia from KIDOVA who accepted to participate in the evaluation of this work.
I would like also to thank Prof. Michel Tijani for all the helpful discussions and the tough questions he gave me as well.
My sincere thanks also go to my friends and colleagues: Zezhong, Hao, Xiangdong, Paule, Mejda, Sara, Hafsa, Aurélien, Qinglin and Shuaitao.
Finally, my last thoughts are with my family and all my loved ones for their unconditional support in difficult times. To all, thank you very much.
Fontainebleau, Juin 2019 NGO Dac Thuong
7
Table of contents
RÉSUMÉ ... 1 ABSTRACT ... 3 ACKNOWLEDGEMENT ... 5 TABLE OF CONTENTS ... 7 CHAPTER 1 INTRODUCTION ... 131.1 Introduction to geothermal energy ... 13
1.1.1 Geothermal resources potential ... 13
1.1.2 Hot Dry Rock concept ... 15
1.1.3 Enhanced Geothermal Systems ... 17
1.2 Pioneering EGS projects ... 19
1.2.1 Fenton Hill HDR project ... 19
1.2.2 Camborne School of Mines Project ... 21
1.2.3 Soultz-sous-Forêts project ... 23
1.3 Induced seismicity in EGS development ... 25
1.4 Objective of this research ... 29
CHAPTER 2 THEORETICAL FRAMEWORK AND NUMERICAL SIMULATION APPROACH ... 31
Résumé ... 31
Summary ... 32
2.1 Introduction ... 33
2.2 General governing equations ... 34
8
2.2.2 Pore fluid flow ... 36
2.2.3 Fluid flow in hydraulic fractures and existing fractures ... 37
2.2.4 Heat transfer ... 39
2.3 Fracture propagation ... 40
2.3.1 Fracture mechanics ... 43
2.3.1.1 Griffith energy balance approach ... 43
2.3.1.2 Irwin stress analysis approach ... 45
2.3.1.3 Relationship between the energy release rate and stress intensity factor .... 47
2.3.1.4 Equivalent fracture energy ... 48
2.3.1.5 Crack orientation ... 49
2.3.1.6 Comments on the Griffith energy and Irwin stress approach ... 50
2.3.2 Cohesive zone model ... 51
2.4 Dynamic fracture propagation and wave propagation ... 53
2.5 Fault reactivation ... 55
2.6 Hydraulic fracture models and interaction of fractures ... 60
2.6.1 Hydraulic fracture models ... 60
2.6.1.1 KGD model ... 64
2.6.1.2 Penny-shaped fracture model ... 66
2.6.2 Interaction of hydraulic fractures and natural fractures ... 67
2.7 Numerical methods for modeling fracture propagation ... 70
2.7.1 Extended finite element method ... 70
2.7.2 Cohesive element method ... 73
CHAPTER 3 THERMAL FRACTURE ... 77
Résumé ... 77
9
3.1 Introduction ... 79
3.2 Simulation of rock fracture in a thermal cooling experiment ... 80
3.2.1 Summary of the cooling experiment ... 80
3.2.2 Heat transfer simulation... 84
3.2.3 Fracture propagation simulation ... 90
3.3 Thermal fracture from a wellbore ... 98
3.3.1 Model setup ... 99
3.3.2 Simulation results ... 102
3.3.2.1 Results of heat transfer simulation ... 102
3.3.2.2 Results of fracture propagation simulation ... 104
3.3.3 Effect of the temperature of the injected fluid ... 107
3.4 Chapter conclusions ... 110
CHAPTER 4 SIMULATION OF FRACTURE PROPAGATION AND FAULT SLIP DUE TO HYDRAULIC STIMULATION ... 113
Résumé ... 113
Summary ... 115
4.1 Simulation of the propagation of a single hydraulic fracture ... 117
4.1.1 Plane strain KGD model ... 117
4.1.1.1 Geometry and finite element mesh... 117
4.1.1.2 Material properties and injection rate... 121
4.1.1.3 Initial and boundary conditions ... 122
4.1.1.4 Convergence issues and viscous regularization ... 122
4.1.1.5 Results and discussions ... 123
4.1.2 Penny-shaped model ... 129
10
4.1.2.2 Results and discussions ... 131
4.1.3 Concluding remarks ... 135
4.2 Propagation of a hydraulic fracture and slip of a pre-existing fault ... 135
4.2.1 Model setup ... 136
4.2.2 Simulation results for case S1 with μf = 0.35, Q = 0.5 L/s, and θ = 22° ... 140
4.2.3 Effect of friction coefficient on fault slip ... 144
4.2.4 Effect of injection rate on fault slip ... 150
4.2.5 Effect of fault orientation on fault slip ... 156
4.2.6 Concluding remarks ... 161
4.3 Propagation of multiple hydraulic fractures and interaction with existing faults... 161
4.3.1 Model setup ... 161
4.3.2 Sensitivity study of friction coefficient ... 164
4.3.3 Sensitivity study of injection rate ... 169
4.4 Chapter conclusions ... 172
CHAPTER 5 SIMULATION OF INDUCED DYNAMIC EFFECTS ... 175
Résumé ... 175
Summary ... 177
5.1 Introduction to induced microseismicity ... 178
5.2 Modeling of induced dynamic effects ... 181
5.2.1 Introduction ... 181
5.2.2 Explanations using discrete models ... 183
5.2.3 Explanations using continuum model: analytical calculation ... 187
5.2.4 Explanations using a continuum model: numerical simulation ... 190
11
5.2.4.2 Influence of the applied displacement rate ... 196
5.2.4.3 Influence of tensile strength on the intensity of induced elastic waves ... 198
5.3 Estimation of acceleration induced by fault slip ... 203
5.3.1 Model setup ... 204
5.3.2 Results of dynamic simulation to assess the effect of friction coefficient (cases S1, S2, and S3) ... 207
5.3.3 Results of dynamic simulation to assess the effect of the injection rate (cases Q1, Q2, Q3, and Q4) ... 216
5.4 Chapter conclusions ... 219
CHAPTER 6 CONCLUSIONS AND PERSPECTIVES ... 221
6.1 Conclusions ... 221
6.2 Recommendation for future research ... 223
APPENDIX 1: LIST OF PUBLICATIONS ... 225
APPENDIX 2: SIMULATION RESULTS FOR CASES MS1 AND MS3 OF SECTION 4.3.2 ... 227
APPENDIX 3: SIMULATION RESULTS FOR CASES MQ2, AND MQ3 OF SECTION 4.3.3 ... 231
APPENDIX 4: RESULTS OF DYNAMIC SIMULATION FOR CASES S2 AND S3 OF SECTION 5.3.2 ... 233
APPENDIX 5: RESULTS OF DYNAMIC SIMULATION FOR CASES Q1 TO Q4 OF SECTION 5.3.3 ... 237
APPENDIX 6: EFFECT OF FINITE ELEMENT MESH ... 245
13
Chapter 1
Introduction
1.1 I
NTRODUCTION TO GEOTHERMAL ENERGY1.1.1 Geothermal resources potential
Geothermal energy is the thermal energy contained in the Earth’s crust. The sources of geothermal heat are associated with the upward conduction and convection of energy from the Earth’s core and mantle, and with the decay of the naturally radioactive isotopes of uranium, thorium and potassium (Barbier, 1997; Boyle, 2004; Brown et al., 2012). These natural processes, which occur over geological time scales, maintain the renewal of the thermal energy content and make geothermal energy practically inexhaustible.
Geothermal energy exists in two major forms: natural hydrothermal systems and heat stored in hot rock formations. In natural hydrothermal systems, an interconnected network of open pores and fractures is present in the rock mass, which allows the flow of fluids. Natural groundwater is abundant in these systems; it is heated by the surrounding hot rock and is carried upward by natural convective circulation. These natural systems can be found in porous and/or naturally fractured rocks and are typically located at depths of 1 – 4 km in a number of locations e.g., New Zealand, Indonesia, Northern Italy, Japan, Mexico, Iceland (DiPippo, 1988; Mock et al., 1997; Tester, 1989). However, natural hydrothermal systems are the exception rather than the rule as heat, natural groundwater and permeability/porosity must be present.
14
The heat stored in hot rock formations, on the other hand, is in principle available anywhere around the world if one drills deep enough and can appropriately stimulate the rock (i.e., create sufficient permeability) at these depths. The reason is that the temperature of the Earth increases with depth. On average, the geothermal gradient is about 30 °C/km (Banks, 2012; Barbier, 1997; Brown et al., 2012). However, there are many areas where thermal gradients are considerably greater. A thermal gradient of 50 °C/km is commonly available in the Western U.S (Beckers et al., 2014) where the minimum temperature at a depth of 5 km is estimated to be 250 ºC. The same thermal gradient was also found in Southern Australia (Geodynamics, 2015) where temperatures of 273 ºC and 283 ºC have been found at depths of around 5 km. A local geothermal gradient on the order of 65 °C/km was found at the Fenton Hill site in the Jemez Mountains of New Mexico, United States. For regions that have an average geothermal gradient of 30°C/km, a temperature of 150 °C is expected at depths of around 5 km, depths that are accessible with current drilling technology; this temperature is considered to be suitable for efficient heat exploitation (Potter et al., 1974). The rock formations at depths where suitable temperatures can be found have two typical characteristics: low permeability to almost impermeable and essentially dry – the so-called hot dry rocks (HDR). HDRs hold an enormous amount of thermal energy that can be extracted for electricity production. A comparison of geothermal energy output with other energy sources is shown in Figure 1.1.
Figure 1.1 Estimates of the worldwide resource base for geothermal and other energy sources (Brown et al., 2012). Note: 1 quad = 293 x 109 kWh; world energy consumption in 2010 is 524 quads
15
It is obvious from Figure 1.1 that the geothermal energy stored in HDRs is second only to fusion energy, a source that is yet to be developed. It has been estimated that the total amount of thermal energy contained in HDR at accessible depths is about 300 times greater than the energy that oil, natural gas and coal combined could provide (Duchane and Brown, 2002; Tester, 1989). This amount of energy is enough to supply all the energy needs of the world for centuries to come (Edwards et al., 1982).
1.1.2 Hot Dry Rock concept
The importance of HDR resources originates not just from its huge quantity but also from its abundant availability throughout the world. However, the low permeability and the absence of natural water in HDRs require that permeability-enhancing operations have to be carried out and a heat transport medium, e.g., water or brine, must be supplied artificially. The first attempts to exploit the heat contained in HDRs were made in the United States by a group of researchers from the Los Alamos National Laboratory (Brown and Duchane, 1999; Smith, 1975), who conceived the HDR concept and began to develop the world's first HDR reservoir at Fenton Hill in New Mexico (USA) between 1974 and 1978 (Murphy et al., 1983). The original HDR concept, as shown in Figure 1.2, was simple (Abé, 1992; Brown et al., 2012; Potter et al., 1974): A well is drilled into the HDR formation. Through this well, water is injected at pressures high enough to create a single plane vertical fracture, perpendicular to the direction of the minimum compressive stress, which is often horizontal at depths greater than 500 – 1000 m. The vertical fracture would grow as a disc to a diameter of several hundred meters, creating a large reservoir of rock with sufficient area for heat exchange between the water and the hot rock. A second well is subsequently drilled to connect with the reservoir at some distance from the first well. Once the stimulation phase and the well completion are finished, water circulation and heat extraction can begin. Cold water is pumped into the reservoir through the first well. The water is heated by contact with the hot rock as it flows across the reservoir. The resulting superheated water is then pumped up to the surface via the second well and begins the power generation phase. After extracting the useful heat, the same water is re-injected back into the reservoir to begin a new circulation circle. Thus, an HDR system operates and recovers the heat from HDRs in a closed-loop circulation, making the
16
production operations sustainable to some extent, although some water loss from the system may still occur.
Figure 1.2 Original concept of an HDR geothermal system consisting of two wells and a vertical fracture created by hydraulic stimulation. Left: Front view showing typical dimensions for the wells, depth of the reservoir, and temperature. Right: 3D view showing the orientation of the fracture relative to the minimum stress. (Adapted from (Brown et al., 2012).)
For large HDR systems, larger areas are required for heat exchange. This could be achieved by creating a set of multiple parallel fractures using hydraulic stimulation in open uncased sections of the borehole (Nicol and Robinson, 1990). A schematic of such a system is illustrated in Figure 1.3.
The successful development of an HDR reservoir depends on the choice of a site that provides suitable rock at a depth that is reachable with limited drilling costs. The reservoir created should provide a sufficient area for rapid heat transfer between the rock and water and requires a reasonable amount of energy to pump water through it, i.e., resistance to flow must be relatively small. The reservoir must also operate with minimum water loss from the system and its temperature should not be drawn down too quickly.
Sh Sh
17
Figure 1.3 HDR concept for large geothermal systems that contains multiple parallel vertical fractures. Two deviated wells connect these fractures to create a closed-loop system (Adapted from (Jung, 2013))
1.1.3 Enhanced Geothermal Systems
This original HDR concept was based on a consideration of the crystalline formation at great depths as an intact and almost impermeable rock mass. However, this consideration was refuted based on further understanding gained from the work at the Fenton Hill HDR project and the Camborne School of Mines (CSM) geothermal project at Rosemanowes, Cornwall, England (Murphy et al., 1983). The existence of natural joints and existing fractures has been confirmed and their influence on the development of the geothermal reservoir is considered to be significant. In fact, high fracture densities can be expected in most deep rock formations, although only a fraction of them are likely to be conductive (Evans et al., 1999). Microseismic evidence at the Fenton Hill project showed that instead of generating a disc-shaped fracture, hydraulic stimulation leads to the opening and/or shearing of the natural joints and existing fractures, and permanently improves the permeability of the formation (Duchane and Brown, 2002; Evans et al., 1999; Murphy et al., 1983; Richards et al., 1994). The shearing and/or opening of existing fractures was also the main permeability enhancement mechanism observed in the CSM project (Baria et al., 1989; Green and Baria, 1989). In fact, the seismic investigations at the CSM project concluded that all detected microseismic activity indicated
Injection well Production well
18
shear sources that are consistent with known rock joint orientations and in-situ stress magnitudes and orientations. These observations and further experimental studies prompted the concept of Enhanced Geothermal Systems (EGS) in which natural joints and existing fractures play important role in the development of the rock reservoir (Batchelor, 1989a; Cornet, 1989). Instead of being considered as a continuum medium, the rock is treated as a discrete medium that contains natural joints and fractures. The permeability of this medium could be enhanced by massive water injection in long uncased borehole sections to shear and open the natural fractures. The EGS concept is illustrated in Figure 1.4.
Figure 1.4 Schematic of the EGS concept that contains one injection well and three production wells. The permeability of the rock mass is enhanced by the shearing and opening of existing joints/fractures. Source: DOE (2015).
Generally, an EGS reservoir must have a number of properties in order to be technically feasible and economically viable. These include the total volume, the total heat exchange surface, the flow impedance, and the thermal and stress-field properties. The reference limits for these properties are summarized in Table 1.1.
19
Table 1.1 Required properties for an EGS reservoir. Source: Rybach (2010)
Property Value
Fluid production rate Wellhead temperature
Total effective heat exchange surface Rock volume Flow impedance Water loss 50 – 100 L/s 150 – 200 °C > 2 x 10⁶ m2 > 2 x 10⁸ m3 < 0.1 MPa/(L/s) < 10%
1.2 P
IONEERINGEGS
PROJECTSSince the creation of the world’s first HDR reservoirs at Fenton Hill, many EGS projects have been developed in the United States, Europe and elsewhere. These projects have used a more or less similar approach to that used at Fenton Hill HDR reservoir, using the technique of hydraulic fracturing to create the large heat transfer areas necessary in a HDR reservoir. Major pioneering projects are summarized in the following paragraphs.
1.2.1 Fenton Hill HDR project
The first HDR geothermal project at Fenton Hill, New Mexico, United States, was initiated in 1971 by the Los Alamos National Laboratory (LANL). The primary objective of the project was to develop and demonstrate of an economical and commercially viable technology for extracting thermal energy stored in HDR. The site, located just outside of the ring fault structure of the Valles Caldera, was chosen primarily on the basis of favorable heat flow and the simplicity of the geologic structure in the anticipated reservoir rock (Brown and Duchane, 1999). The estimated thermal gradient is on the order of 65 °C/km. The basement rock is at a depth of about 730 m, and contains Precambrian igneous and metamorphic rocks. The rock mass is extremely tight with hydraulic conductivity in the range of nano-darcies (Brown et al., 2012). A geologic cross section of the rock mass with the geothermal gradient is shown in Figure 1.5.
20
Figure 1.5 Elevation view of the Phase I (GT-2B and EE-1) and Phase II (EE-2 and EE-3) wellbore at the Fenton Hill HDR project (Grigsby et al., 1989)
Two separate, confined HDR reservoirs were created at the Fenton Hill site in hot crystalline rock at different depths and then assessed and flow-tested for almost a year. Work on the shallower reservoir (Phase I reservoir) began in 1974 (Brown et al., 2012). The first borehole, GT-2 (Figure 1.5), was drilled into the granitic rock at a depth of 2900 m at a mean temperature of 195 °C. After a series of water injections to generate a hydraulic fracture from the bottom of the GT-2 borehole, the second borehole, EE-1, was directionally drilled beneath the bottom of the borehole GT-2 to intersect with the created hydraulic fracture. A good connection between the second borehole and the created reservoir was not immediately achieved, and sidetracking was necessary to establish contact with the initial well via a combination of induced and natural fracture pathways. In total, over 2000 m3 of water was
21
injected at average pressures of 10 MPa. Later, the reservoir was enlarged due to extensive testing. Using microseismic data, the final volume of the reservoir was estimated at 10 x 106 m3 (Brown, 2009). Circulation tests showed a thermal production power of 3 MW at a flow rate of about 6 L/s.
Development of the second, much larger, deeper, and hotter HDR reservoir began in 1980 (Phase II). The initial intent of this reservoir was to create a series of vertical, disc-shaped fractures connecting two inclined, vertically separated wellbores (Brown and Duchane, 1999). This concept is presented in Figure 1.3. The two boreholes were drilled sequentially, one above the other. The first borehole EE-2 (Figure 1.5) was drilled to a vertical depth of about 4400 m, with the lower 1000 m directionally drilled at an angle of 35° to the vertical. The second borehole EE-3 (Figure 1.5) was then drilled in a similar manner to the first, but with the directionally drilled segment positioned 380 m above the directionally drilled portion of the first borehole. A number of hydraulic stimulations were carried out in an effort to connect these two boreholes by multiple vertical fractures. In total, over 21000 m3 of water was injected at average pressures of 48 MPa. However, all these stimulations failed to connect the two boreholes. A satisfactory connection between the boreholes was then achieved after sidetracking the upper borehole into the stimulated region, which had been identified using induced microseismic data. The Phase II reservoir operated at a much higher temperature, above 300 °C, than the Phase I reservoir. A circulation test revealed a thermal power production of 10 MW at a circulation flow rate of 12 – 14 L/s. Water loss during circulation was estimated to be extremely low due to the inherent tightness of the surrounding sealed rock mass, combined with the stress cage effect (Brown et al., 2012). However, the resistance to flow was 2.1 MPa/(L/s), which is unacceptably high compared to the reference limit value given in Table 1.1. It was believed that much of the impedance was concentrated in the zones immediately surrounding the boreholes. The Fenton Hill project was terminated in 1995 due to lack of financial support.
1.2.2 Camborne School of Mines Project
The Camborne School of Mines project at Rosemanowes Quarry in Cornwall, England started in 1977 and proceeded in 3 phases (Batchelor, 1989a; Parker, 1989). The Phase 1 of the
22
project involved preliminary experiments at shallow depths. The objective of this phase was to understand the role of the natural fracture system and find the best way to establish and control flow paths within the fracture system. Four boreholes were drilled to a depth of 300 m; explosives and hydraulic fracturing were used in combination to connect the four boreholes. The circulation test later showed that the impedance was greatly reduced. The lowest impedance achieved was close to 0.1 MPa per L/s. Temperature gradients at the site were estimated at 30 – 40 °C/km, the highest in England (Parker, 1989).
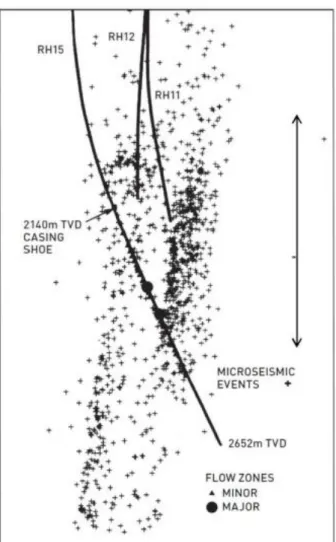
The next phase of the project, Phase 2A, began in 1980 and lasted until 1983. The goal of this phase was to learn how to create and manage a full-size reservoir that has all the parameters necessary for commercial operation, except the depth of the reservoir. During this phase, two boreholes (RH11 and RH12) deviated from the vertical by 30° and spaced by 300 m were drilled to a depth of 2000 m. The reservoir was created by explosive fracturing near the wellbore, followed by hydraulic stimulation of the lower borehole using water injected at flow rates up to 100 L/s to try to open up the existing joints to connect to the upper borehole (Parker, 1989). However, the circulation test, in which water was injected through the lower borehole revealed, that a massive amount of water was lost from the system and the pumping pressure required was too high (Baria et al., 1989). Seismic monitoring showed that during the stimulation and subsequent circulation, the reservoir grew vertically downwards, as shown in Figure 1.6, probably extending to a depth of two kilometers below the two boreholes.
During Phase 2B, a third borehole RH15 was drilled to a depth of 2600 m to access the stimulated zone below the existing two boreholes (Batchelor, 1989b). Its position was selected to penetrate through the microseismic cloud. Stimulation was then performed on RH15 using viscous gel. A substantial thermal drawdown was observed during the first year of a circulation test. Circulation tests later suggested that the optimum hydraulic performance at Rosemanowes would have an injection flow rate of 24 L/s, a flow impedance of 0.6 MPa/(L/s) and water loss of 21%. This is still far from the requirements, as given in Table 1.1, for this EGS reservoir to be considered to be economically viable.
23
Figure 1.6 Front view of the seismic cloud of the EGS-system at Rosemanowes (Jung, 2013)
1.2.3 Soultz-sous-Forêts project
The Enhanced Geothermal System (EGS) of Soultz-sous-Forêts (France) is a European research program for the extraction of energy from deep hot fractured rocks. The site of Soultz is located in the central part of the Upper Rhine Valley 6 km east of the Western main fault. The Soultz granitic basement lies below 1.4 km of sediments, goes down to 5 km, and is strongly fractured (Genter and Traineau, 1996; Ledésert et al., 1993; Sausse, 2002). The joint systems are clustered, with a high density of joints in the fracture zones and a much lower density in the competent rock. The fracture zones and joints are mainly subvertical at a strike of 160°. The geostatic stress state includes a minimum horizontal stress Sh, which is about 54% of the vertical stress Sv (Sh = 0.54 Sv), and a maximum horizontal stress SH, which is
24
almost equal to the vertical stress (SH = Sv) (Cornet et al., 2007; Ledésert et al., 2010; Sausse and Genter, 2005). Temperature anomalies have been documented at the site and in the region around Soultz (Dèzes et al., 2004; Ziegler, 1992), which indicate that some of the faults are permeable, transporting water from great depth up to the cap rock. The temperature at 5 km in the granitic basement is about 200 °C (Freymark et al., 2017; Held et al., 2014; Hettkamp et al., 2004) and the lower part of the temperature profile indicates a conductive heat transfer regime.
In total, five deep boreholes have been drilled at the Soultz site (Hébert et al., 2010). The two initial boreholes (GPK1, 3600 m deep and EPS1, 2200 m deep) were mainly for the purpose of investigating the nature and the structure of the rock mass. The other three boreholes (GPK2, GPK3 and GPK4) are located at depths 4400 to 5000 m. These boreholes form a triplet system in which GPK3 is used for injection of fluids, while GPK2 and GPK4 are dedicated to production. An elevation showing the relative locations of the four boreholes GPK1 to GPK4 is presented in Figure 1.7. All boreholes drilled had open sections of 500 – 750 m in the lowest part that would be stimulated. Each borehole of the triplet system was stimulated by injecting large volumes of water at various flow rates. A volume of 22000 m3 was injected at 50 L/s into borehole GPK2, which resulted in a wellhead pressure of 14.5 MPa at shut-in. Stimulation of the borehole GPK3 involved pumping of 34000 m3 of water at a flow rate from 50 to 90 L/s. The maximum wellhead pressure produced was 17.9 MPa. The borehole GPK4 was stimulated by injecting 21500 m3 of water at a flow rate from 30 to 45 L/s and the peak wellhead pressure was 17.5 MPa (Evans et al., 2012). The permeability of the rock mass was significantly improved after stimulation. Transmissibility of single fractures after the stimulation could exceed 1 d.m and was only slightly pressure dependent (Schill et al., 2017). Several circulation tests were later performed. The production flow rate for the two production boreholes GPK2 and GPK4 reached 30 L/s, which is still far from the requirement of 50 – 100 L/s (Table 1.1). Long term circulation of the triplet system with power production commenced in 2010 (Genter et al., 2010).
25
(a) (b)
Figure 1.7 (a) Schematic map of the Rhine graben and location of the Soultz-sous-Forêts EGS site (Calò et al., 2014), (b) Simplified deep geology, well trajectories and location of open sections and leakages in the Soultz-sous-Forêts reservoir (Held et al., 2014)
1.3 I
NDUCED SEISMICITY INEGS
DEVELOPMENTThe centerpiece of an EGS project is the heat exchanger created in the hot rock at depth. Hydraulic stimulation has become a common technique to achieve this result. Fluid, such as water, is injected at sufficiently high pressure into the rock mass to create new fractures or activate the pre-existing ones. Given the high pressures and the massive amount of water needed in the stimulation, the seismic risk has increasingly become a major concern (Evans et al., 2012; Zang et al., 2014). In fact, one of the main challenges for the development of an EGS is associated with assessing the induced seismicity that may be triggered by hydraulic pressurization during the stimulation and circulation phases (Ellsworth, 2013; Pellet, 2017; Wohlenberg and Keppler, 1987). Thousands of seismic events are generated during the stimulation and exploitation of EGS reservoirs. In some sites, events of high magnitude were induced and could be felt on the ground surface.
26
At Soultz-sous-Forêts, massive water injections into the boreholes GPK2, GPK3 and GPK4 (located at depths from 4400 to 5000 m) resulted in approximately 90,000 micro-earthquakes. The stimulation of the borehole GPK2 alone triggered over 700 events of magnitude between ML 1.0 and 2.5 during injection. A large event of magnitude ML 2.6 occurred after the shut-in (Dorbath et al., 2009; Evans et al., 2012). More than 200 event of magnitude between ML 1.0 and 2.5 occurred during the stimulation of borehole GPK3; the largest event that had a magnitude ML 2.9 also occurred after the shut-in. Stimulation of the borehole GPK4 also resulted in multiple seismic events, some reaching a magnitude ML 2.7; in total, more than 30 events of magnitude above ML 2.0 were triggered (Rybach, 2010). The circulation tests performed in 2005 and 2008 also induced seismicity with the largest event having a magnitude of ML 2.3 (Cuenot et al., 2008; Dorbath et al., 2009).
At the Basel EGS site in Switzerland, the stimulation of a 5000 m deep borehole in 2006 triggered multiple seismic events that were clearly perceived by the public. The first event of magnitude ML 2.6 occurred during fluid injection, followed by two larger events of magnitude ML 2.7 and 3.4 that occurred during shut-in. After the bleed-off, three aftershocks of ML > 3 were recorded (Deichmann and Giardini, 2009; Häring et al., 2008). These induced seismic events raised concerns among the public, which led to the cancelation of the project by the Basel government at the end of 2009 and the borehole was closed in 2011.
Induced seismicity has also occurred during the development phase of many other EGS projects. For instance, multiple induced seismic events of magnitude approaching ML 3.7 were recorded at the Cooper Basin EGS project in Australia after the injection of 20,000 m3 of water (Asanuma et al., 2005; Baisch et al., 2006). As recently as 2017, an earthquake of magnitude MW 5.5 that struck South Korea in November 2017 was believed to be linked to the stimulation activities at the nearby Pohang EGS project (Grigoli et al., 2018).
Many induced microseismic events have also been reported during the production phases of various EGS projects. At the Hellisheidi geothermal power plant, which is located within the Hengill volcanic system in Iceland, microseismic activity increased immediately after reinjection of geothermal waste water began (Flóvenz et al., 2015; Juncu et al., 2018), with two largest induced seismic events of magnitude 4. Later investigations showed that the fluid reinjection caused an increase in pore pressure which led to increased seismicity and fault slip
27
(Juncu et al., 2018). Both the pore pressure increase and the fault slip resulted in the observed surface deformation. An induced event of magnitude ML = 2.7 was also recorded in August 2009 during the circulation phase at the geothermal project in Landau, Germany (Gaucher et al., 2015).
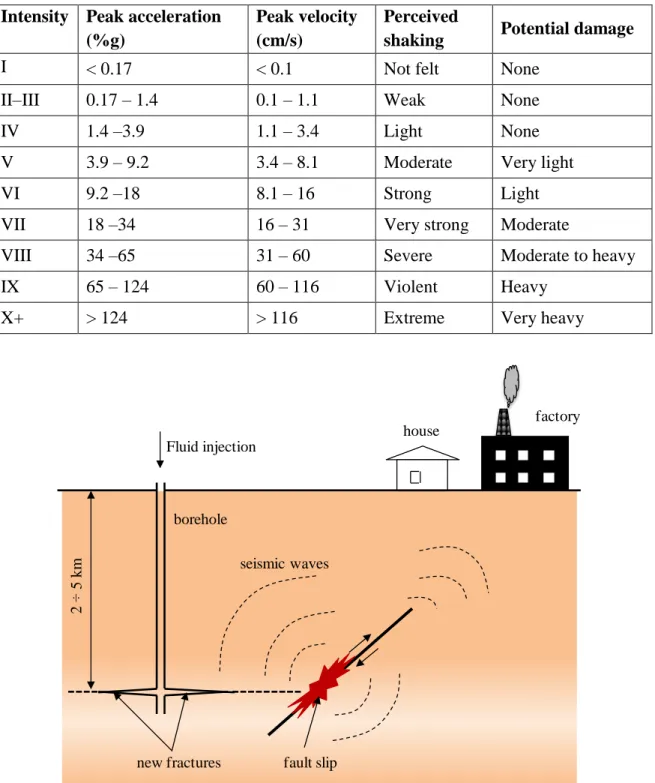
The risk of induced seismicity has to be thoroughly assessed and quantified before an EGS project can begin, especially for projects located near urban areas. Otherwise, this issue can impede the development or even lead to the cancelation of the project as was seen in Basel, Switzerland. Seismicity induced during the injection and withdrawal of fluids is believed to be associated with the slip of pre-existing faults and the propagation of new tensile fractures (Pearson, 1981). Both the fault slip and the fracture propagation are related to the in-situ stress variation, which is induced by thermo-poromechanical processes involved during the injection and withdrawal of fluids (Ghassemi and Tao, 2016; Ghassemi and Tarasovs, 2015; Ghassemi and Zhang, 2004; Segall and Fitzgerald, 1998). The thermo-mechanical coupling (i.e., changes in in-situ stress due to temperature variations) is important on long time scales from months to years (Ghassemi, 2012; Ghassemi and Tarasovs, 2015). While the poro-mechanical effect due to changes in pore pressure affects the deformation of the rock mass more quickly. Consequently, seismic events induced during the fluid injection are usually considered to be caused by the shear slip on natural faults in response to a reduction of the shear strength the faults due to an increase in pore pressure. However, thermoelastic perturbations can cause an increase of the deviatoric stress in the cooled portion of the reservoir, potentially provoking an unstable condition (De Simone et al., 2013). Thus, a comprehensive approach to assess the risk of induced seismicity should take into consideration the effects of both thermo- and poromechanical processes. A schematic of the fault slip due to fluid injection, the propagation of the induced seismic waves and the potential impact on surface structures is illustrated in Figure 1.8. The intensity of induced seismicity can be estimated based on the peak accelerations or peak velocities recorded on the ground surface and using the modified Mercalli intensity scale (Wald et al., 1999; Wood and Neumann, 1931). Figure 1.2 provides a relationship between the peak ground accelerations or peak ground velocities and the seismic intensity, human perception and potential structural damage. The consequences of the induced
28
seismicity can range from a nuisance to the population to structural damages to the infrastructure.
Table 1.2 Modified Mercalli intensity scale and corresponding peak ground acceleration and peak ground velocity. Source: Wald et al. (1999), Wood and Neumann (1931)
Intensity Peak acceleration (%g)
Peak velocity (cm/s)
Perceived
shaking Potential damage
I < 0.17 < 0.1 Not felt None
II–III 0.17 – 1.4 0.1 – 1.1 Weak None
IV 1.4 –3.9 1.1 – 3.4 Light None
V 3.9 – 9.2 3.4 – 8.1 Moderate Very light
VI 9.2 –18 8.1 – 16 Strong Light
VII 18 –34 16 – 31 Very strong Moderate
VIII 34 –65 31 – 60 Severe Moderate to heavy
IX 65 – 124 60 – 116 Violent Heavy
X+ > 124 > 116 Extreme Very heavy
Figure 1.8 Slip of fault due to fluid injection, propagation of induced seismic waves, and potential impact on surface structures and human perception. Adapted from Rutqvist et al. (2014)
house factory seismic waves fault slip borehole Fluid injection new fractures 2 5 km
29
1.4 O
BJECTIVE OF THIS RESEARCHThis research is a part of the major project GEOTREF – a multidisciplinary platform for innovation and demonstration activities for the exploration and development of high geothermal energy in fractured reservoirs. The project is funded by the Investissement d'avenir program of the French government through the Agence de l'Environnement et de la Maitrise
de l'Energie (ADEME) and the Guadeloupe region. The aim of the project is to improve the
understanding of fractured geothermal reservoirs in order to reduce geothermal “geological risk” and to ensure sustainable exploitation of the reservoir during the production phase. As part of the Research and Development group of the project GEOTREF, this work is mainly concerned with modeling the propagation of new tensile fractures and the slip of pre-existing faults during the stimulation of deep geothermal reservoirs and proposing a numerical procedure to modeling the seismicity induced by fault slip. The following objectives are set for this work:
Simulate the propagation of hydraulic fractures and their interaction with pre-existing faults during the hydraulic stimulation of deep geothermal reservoirs; study the thermal effects on long term propagation of hydraulic fractures.
Study the reactivation and the slip of the pre-existing faults to determine parameters that control the fault slip and propose a procedure to estimate the peak ground acceleration that is induced by the fault slip
Explain and model the dynamic effects induced by the fracture propagation in a rigorous manner using conservation laws
31
Chapter 2
Theoretical framework
and numerical simulation approach
R
ÉSUMÉCe chapitre décrit d’abord le problème central de cette thèse de doctorat, à savoir la propagation des fractures hydrauliques et leurs interactions avec des failles préexistantes lors de la mise en valeur de réservoirs géothermiques. Ce chapitre fournira ensuite un résumé de la base théorique des processus physiques impliqués. Les équations de la théorie des milieux thermo–poroélastiques saturés en fluide sont présentées en premier. Celles-ci incluent les équations de déformation des milieux poreux, les équations d’écoulement du fluide dans les pores, dans les fractures et les failles, ainsi que celles du transfert de chaleur. Ensuite, les critères de propagation de la rupture basés sur la mécanique de la rupture et sur le concept de matériau cohésif sont présentés. L'aspect dynamique de la propagation de la fracture est également inclus. Puis, le phénomène de réactivation des failles et le critère de réactivation des failles sont passés en revue, l'accent étant mis sur l'utilisation du critère de Coulomb pour évaluer la réactivation de la défaillance. Les équations des modèles de fractures hydrauliques simples sont également présentées. Ces modèles servent de solutions de référence pour la validation des modèles numériques. Enfin, les méthodes numériques de modélisation de la propagation des fractures sont exposées, notamment la méthode des éléments finis étendus et la technique des éléments cohésifs.
32
S
UMMARYThis chapter first describes the central problem of this doctoral research which is the propagation of hydraulic fractures and their interactions with pre-existing faults during the development of geothermal reservoirs. The chapter then provides a summary of the theoretical basis for the physical processes that are involved. The equations of the theory of fluid– saturated thermo–poroelastic media are presented first. These include equations for deformation of porous media, the fluid flow in the pores and in the fractures and faults, and the heat transfer. Next, the criteria for fracture propagation, based on fracture mechanics and the concept of cohesive material, are presented. The dynamic aspect of fracture propagation is also included. The phenomenon of fault reactivation and the criterion for fault reactivation are then reviewed with an emphasis on using the Coulomb friction criterion for assessing fault reactivation. The equations for single hydraulic fracture models are also presented. Those models serve as reference solutions for the validation of the numerical models. Finally, the numerical methods for modeling fracture propagation are presented, which include the extended finite element method and the cohesive element technique.
33
2.1 I
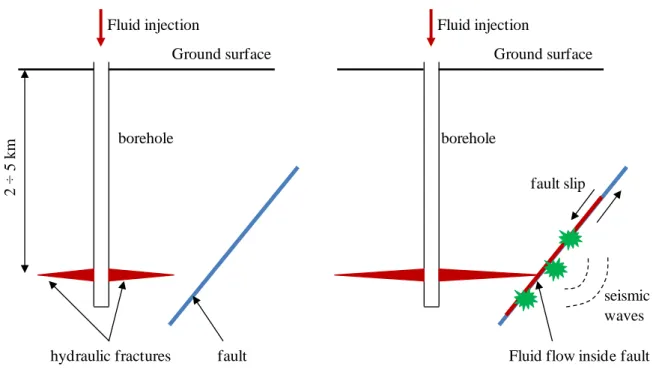
NTRODUCTIONThis doctoral research is centered on the numerical modeling of the propagation of hydraulic fractures and the potential reactivation of pre-existing faults during hydraulic stimulation of deep geothermal reservoirs. The process of hydraulic stimulation is schematically presented in Figure 2.1. A borehole is drilled into a hot dry rock formation and fluid is injected at pressures high enough to create new hydraulic fractures (Figure 2.1a). As the hydraulic fractures propagate they may intersect pre-existing faults (Figure 2.1b). The fluid then flows into these faults, leading to an increase in the fluid pressure in the faults, which in turn causes the faults to slip. The fault slip is both beneficial and hazardous. On the one hand, the fault slip will improve the fault permeability due to dilatancy effects and fault roughness, thus enhancing the overall permeability of the reservoir which is beneficial. On the other hand, the fault slip may also be unstable, which means that the fault slip may induce seismic waves; if the induced seismic waves are strong enough, they can cause harm to people and damage structures on the ground, which is hazardous.
(a) Propagation of hydraulic fractures (b) Intersection of hydraulic fractures with pre-existing faults
Figure 2.1 Schematic representation of the hydraulic stimulation of geothermal reservoirs
borehole Fluid injection fault hydraulic fractures 2 5 km Ground surface borehole Fluid injection
Fluid flow inside fault fault slip
seismic waves Ground surface
34
The propagation of hydraulic fractures or the reactivation of pre-existing faults in a permeable porous rock mass that is fully saturated due to the injection of fluid is a coupled problem that involves multiple physical processes:
(i) deformation of the porous rock mass; (ii) flow of the fluid within the pores;
(iii) flow of the fluid within the hydraulic fractures and the pre-existing faults;
(iv) propagation of the hydraulic fractures or the reactivation of the pre-existing faults; (v) heat transfer.
In-situ conditions such as the presence of natural fractures, incomplete data regarding the initial conditions (e.g., stresses and pore pressure) or physical properties of the rock mass, may add additional complexities to the problem. Furthermore, the propagation of brittle fractures is inherently a dynamic process that releases energy in the form of elastic waves. The effects of these waves may be significant over a short time period (on the order of seconds) following the sudden propagation of the fracture. Meanwhile, the diffusion of fluid within the pores and the fluid injection operation itself occur over much longer time period (on the order of hours or even days). Thus, coupling the inertial effects with the fluid diffusion is an unrealistic task. A modeling procedure to quantify the induced dynamic effects is presented in Chapter 5. Thermal effects also need to be accounted for since hydraulic stimulation of EGS involves temperature changes of significant orders as cold water is pumped into hot rock formations. The above phenomena and the equations for describing these phenomena are presented in the next sections.
2.2 G
ENERAL GOVERNING EQUATIONS2.2.1 Deformation of porous rock mass
The rock mass is macroscopically considered as a homogeneous, isotropic, and poroelastic medium whose constitutive relation is expressed as (Coussy, 2004):
,0 0 0 2 2 3 3 ij ij K G kk ij G ij K T T ij b p p ij (2.1)35
where ij is the current total stress (compression is negative), ij,0 is the initial stress; ij is the current strain of the skeleton, kk is the volumetric strain (summation over the repeated indices kk 112233); p and p are the current and initial pore pressures, respectively; 0 T and T are the current and initial temperatures, respectively; K and G are the bulk modulus 0
and the shear modulus of the skeleton, respectively; α is the linear thermal expansion coefficient of the skeleton; and b is the Biot's coefficient, which is related to the bulk modulus
K of the skeleton and the bulk modulus KS of the solid phase as:
1 S K b K (2.2)
The bulk modulus K and the shear modulus G are related to the Young's modulus E and the Poisson's ratio ν of the skeleton as:
3 1 2 2 1 E E K G (2.3)Equation (2.1) can be interpreted as follows: on the left hand side is the total stress, while on the right hand side is the stress supported by the skeleton, i.e., the first two terms, and the stress supported by the fluid, which is the last term. Thus, the effective stress, which is the stress supported by the skeleton, is expressed as:
" " ,0 0 2 2 3 3 ij ij K G kk ij G ij K T T ij (2.4)Comparing equation (2.4) with equation (2.1), the effective stress can be expressed as function of the total stress and the pore pressure as:
"
ij ij bp ij
(2.5)
Equation (2.5) is the expression for Biot's effective stress, which applies when the solid phase is either compressible or incompressible. For an incompressible solid phase (i.e., KS →∞), according to equation (2.2) the Biot's coefficient is b = 1, and thus equation (2.5) becomes the familiar expression for Terzaghi's effective stress:
36
"
ij ij p ij
(2.6)
All the field quantities (stresses, strains, pressure, and temperature) in equation (2.1) are functions of coordinates x( ,x x x1 2, 3) and time t. Under conditions of small perturbations, the
strain ij can be related to the displacement components u as: i
, ,
12
ij ui j uj i
(2.7)
where the comma denotes the partial derivative with respect to the spatial variable.
The skeleton of the rock mass must always be in a state of equilibrium. The equilibrium equations under quasi-static conditions and when body forces are absent are:
, 0
ij j
(2.8)
Substitution of equation (2.4) into equation (2.8) while taking into account equation (2.7) leads to the equation that governs the kinematics of the skeleton:
, , 3 , , 0 3 k ki i kk i i G K u Gu K T bp (2.9)
The unknown variables in equation (2.9) include the displacements u , the pore pressure p and i
the temperature T.
2.2.2 Pore fluid flow
The continuity equation for the pore fluid under small perturbations conditions is given by, (Coussy, 2004; Selvadurai and Suvorov, 2016):
1 3 . 0 kk m p T b v t M t t (2.10)where M is the Biot modulus; αm is a coefficient; v is the fluid velocity vector; and .() is the divergence operator.
The Biot modulus M is related to the bulk modulus of the fluid K , the bulk modulus of the f
37 0 0 1 f S b M K K (2.11)
The coefficient αm is a function of the linear thermal expansion coefficients αs and αf of the fluid and the solid phases (Selvadurai and Suvorov, 2016):
m f b S
(2.12)
The fluid flow within the pores is assumed to follow Darcy’s law. The velocity vector v is expressed as: k v p (2.13)
where k is the hydraulic conductivity, in m2; η is the dynamic viscosity of the fluid, in Pa.s Substituting equation (2.13) into equation (2.10) leads to the field equation that governs the fluid flow in the pores:
2 1 3 kk m p T k b p t M t t (2.14)
It should be noted from equation (2.14) that the partial derivative with respect to time of the volumetric strain kk shows the coupling between the mechanicals response of the skeleton and the fluid diffusion.
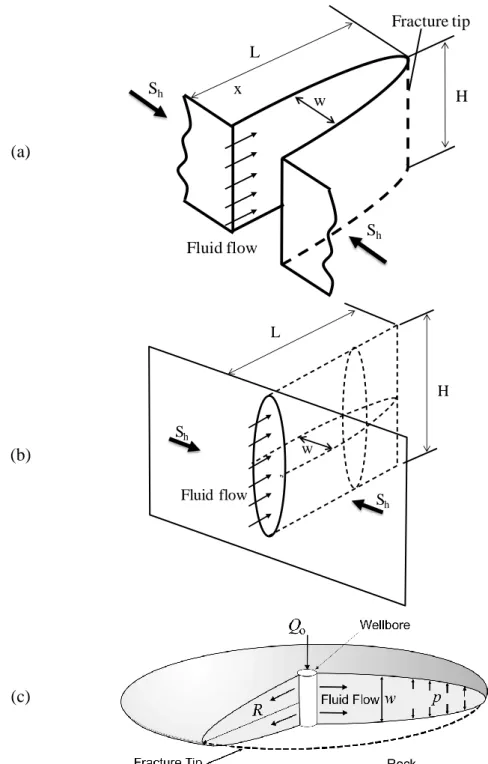
2.2.3 Fluid flow in hydraulic fractures and existing fractures
In permeable reservoirs, fluid loss from fractures is considered to be a pressure-independent process. The Carter’s leakoff model gives an expression for the infiltration rate of fluid from the fracture as (Carter, 1957):
0 2 ( , ) CL g t t t x (2.15)
where g( , )x t is the infiltration rate from both faces of the hydraulic fracture; C is the L
38
The Carter's model is obtained from the pressure diffusion equation, assuming that the leakoff is one-dimensional. The model is used to describe the physical phenomenon that occurs as the fracturing fluid deposits a thin layer of material on the fracture faces. This phenomenon of material deposition is usually observed in hydraulic stimulation of oil and gas reservoirs where proppants and chemical additives (e.g., polymers) are used. In hydraulic stimulation of deep geothermal reservoirs, fresh water or brine is usually used. Thus, we assume that there is no material deposition on the surfaces of the hydraulic fracture. Therefore, the leakoff flow rate will depend only on the permeability of the rock mass and the difference in pressure between the inside of the fracture and inside of the reservoir, and can be expressed as:
0( f r)
g C p p (2.16)
where C0 is the constant leakoff coefficient; pf and pr are the pressure inside the fracture and inside the reservoir (Figure 2.2), respectively.
With leakoff included, the continuity equation for the incompressible fluid flow in the fracture is given by: 0 w q g t s (2.17)
where w is the fracture aperture; q is the longitudinal fluid flow rate, as shown in Figure 2.2. When two surfaces of the fracture are considered as parallel and smooth plates and the fluid is Newtonian and incompressible, the longitudinal flow rate q in steady state is related to the pressure gradient as (i.e., the Poiseuille equation):
3 12 f p w q s (2.18)
where η is the dynamic viscosity of the fluid. From equation (2.18), the transmissivity of the fracture is defined as:
3 12 t w k (2.19)
39
Substituting the Poiseuille equation (2.18) into the continuity equation leads to the field equation that governs fluid flow in the fracture, as:
3 12 f p w w g t s s (2.20)
Figure 2.2 Fracture geometry and fluid flow in the fracture. w is the fracture aperture, q is the longitudinal flow, g is the leakoff flow rate
2.2.4 Heat transfer
As stated previously, hydraulic stimulation of EGS reservoirs involves temperature changes of significant magnitudes. Rock formations, e.g., crystalline rock masses, where EGS reservoirs are developed, usually have a very low permeability. In these formations, the predominant mode of heat transfer in the rock mass is conduction. The convective heat transfer associated with the slow diffusion fluid flows is negligible (Selvadurai and Suvorov, 2016). Therefore, Fourier's law of heat conduction can be used to describe the heat transfer in the rock matrix as:
q T (2.21)
where q is the heat flux vector; λ is the thermal conductivity of the rock mass. The thermal energy conservation equation for the rock mass is given as:
. 0 P T C q t (2.22)
where CP is the overall heat capacity of the rock mass.
The heat equation is obtained by substituting Fourier's heat conduction equation (2.21) into the equation of thermal energy conservation (2.22):
g g w q s pf pr
40 2 0 P T C T t (2.23)
where 2() is the Laplace operator.
At the interface between a flowing fluid and a solid, such as fluid – rock interface, heat transfer takes place by convection. The basic relationship for heat transfer by convection is:
( a)
q n h TT (2.24)
where q is the heat flux vector, n is the unit normal vector, Ta is the temperature of the fluid,
T is the temperature on the surface of the solid, and h is the convective heat transfer coefficient
2.3 F
RACTURE PROPAGATIONFor brittle rocks such as granite under in-situ conditions of stress, fracture is the main mechanism of failure. Other processes that may lead to failure include corrosion and wear. However, these processes happen slowly over long time periods and are less of a concern, especially for rock masses where EGS rock reservoirs are to be created. In general, the fracture process is divided into three distinct phases (Broberg, 1999): (1) loading without crack growth, (2) stable crack growth, and (3) unstable crack growth. Stable crack growth can be controlled by controlling the applied load and a prescribed slow crack growth may be obtained. This is not possible for unstable crack growth, which occurs spontaneously and is usually accompanied induced dynamic effects such as elastic waves.
In the vicinity of the tip of a crack, two distinctly different zones exist, as shown in Figure 2.3. These include a small zone immediately next to the crack tip known as the process zone and a plastic zone outside the process zone. The fracture process always starts from the process zone, where stress and strain concentrations occur. When subjected to high stress, the nucleation and growth of micro-separations takes place in the process zone, i.e., material separation, such as the breakage of atomic bonds. Micro-separations are nucleated at inhomogeneities in the material, e.g., flaws or boundaries between grains. As these micro-separations extend and propagate, voids are created, which in turn propagate and coalesce with other voids and with the main crack, allowing the main crack to grow.
41
Figure 2.3 Two distinct zones in the vicinity of a crack tip. The nucleation and growth of micro-separations take place in the process zone, leading to the creation of voids. The propagation and coalescence of voids allow the crack to grow. After (Broberg, 1999)
For polycrystalline materials such as rocks, the separations are in the form of micro-cracks. The nucleation and growth of these micro-cracks in the process zone is the kernel for the propagation of macro-crack in these materials. (Atkinson, 1989) used the loading of a blunt notch, as shown in Figure 2.4, to illustrate the formation and propagation of a macro-crack. Several micro-cracks exist in the initial configuration (Figure 2.4-a). As the applied load is increased, more micro-cracks are nucleated in the process zone (Figure 2.4-b) and propagate (Figure 2.4-c). The coalescence of these micro-cracks allows the macro-crack to propagate (Figure 2.4-d,e). A new process zone develops a head of the tip of the macro-crack in parallel with the propagation of the macro-crack. The size of the process zone depends on the nature of the material and its internal structure. For brittle rocks, the size of the process zone is relatively small in comparison with the dimensions of the cracked body and hence a large part of the body remains elastic.
There are three basic modes of crack tip displacement, as illustrated in Figure 2.5. Mode I is the opening mode where the principal load is applied normal to the crack plane and the crack tends to open. Mode II corresponds to the case where the crack faces tend to slide over each other due to in-plane shear. Mode III occurs when out-of-plane shear is the predominant applied load. A cracked body can be loaded in any one of these modes, or a combination of two or three modes.
Process zone
Plastic zone
42
Fracture propagation can be studied and modeled using either the theory of fracture mechanics or the cohesive zone model. The fundamental elements of these concepts and related issues are presented in the following sections.
Figure 2.4 Development of a process zones and extension of the macro-crack from the tip of a blunt notch due to applied load σy. The applied load increases from drawings (a) to (e). (a) Existing
cracks. (b) Nucleation of cracks. (c) Propagation of cracks. (d) Coalescence of micro-cracks. (e) Extension of the macro-crack. Source: adapted from Atkinson (1989)
Figure 2.5 Three fundamental modes of fracture: Mode I, tensile or opening mode; Mode II, in-plane shear or sliding mode; Mode III, out-of-plane shear or tearing mode
Applied load (a) (b) (c) (d) (e) Mode I (Opening) Mode II (In-plane shear) Mode III (Out-of-plane shear)