Dennis Gallagher/) Francis Scanlan, - Raymond Houriet, Hans Jorg Mathieu, and Terry A. Ringc)'d>
Laboratoire de Technologie des Poudres, Ecole Polytechnique Federate de Lausanne, CH-1015 Lausanne, Switzerland
(Received 22 June 1992; accepted 26 July 1993)
l n203- S n 0 2 films were produced by thermal decomposition of a deposit which was dip
coated on borosilicate glass substrates from an acetylacetone solution of indium and tin acetoacetonate. Thermal analysis showed complete pyrolysis of the organics by 400 °C. The thermal decomposition reaction generated acetylacetone gas and was found to be first order with an activation energy of 13.6 Kcal/mole. Differences in thermal decomposition between the film and bulk materials were noted. As measured by differential scanning calorimetry using a 40 °C/min temperature ramp, the glass transition temperature of the deposited oxide film was found to be —462 °C, and the film crystallization temperature was found to be —518 °C. For film fabrication, thermal decomposition of the films was performed at 500 °C in air for 1 h followed by reduction for various times at 500 °C in a reducing atmosphere. Crystalline films resulted for these conditions. A resistivity of — 1.01 X 10"3 O • cm, at 8 wt. % tin oxide with a transparency of —95% at 400 nm, has been achieved for a 273 nm thick film.
I. INTRODUCTION
Ceramic films are important for optical and protec-tive coatings, and are becoming increasingly important in the production of electronic devices. For many of these coating applications, films can be deposited from metal-organic solutions. Indium-tin oxide (ITO) films are useful for electrical contacts as well as antireflec-tive coatings because they combine high transparency (>87%) with low resistivity (<29 ohm/cm2).1"3 Several effective methods are used to prepare these coatings, which include sputtering, evaporation, and metal-organic processes.1 The economical metal-organic process is particularly attractive because of its applicability to diverse shapes and large objects. Arfsten et al?A first showed that ITO films prepared by a sol-gel process could have good electrical and optical properties. Later, Maruyama and Kojima1 produced low resistivity films made from acetylacetonate solutions and described some of the thermal treatment and compositional effects on the conductivity of such ITO films. For the metal-organic processing of ITO to become a more attractive processing route, a basic understanding of the chemistry and processing characteristics is needed.
The processing of ITO by any deposition route is complex because of the difficulty to control the tin-doping level, the oxide reduction, the microstructure, and the crystallinity. For evaporated and sputter-coated ITO films, these relationships have been well studied. The tin dopant improves the film conductivity when Sn4+ replaces In3+ in the In2O3 cation sublattice, behaving
as an n-type donor.5 This is true for tin levels up to 6 ± 2 at. %,6 its substitutional limits in the crystal structure. At higher tin concentrations, ionizable Sn2O-'
and nonionizable Sn2O4 structural defects1 as well as
tin oxide (SnO, SnO2, Sn3O4) phases7 form, thus
de-creasing conductivity. Experimentally, improvements in conductivity have been seen for tin levels up to 9 at. % in sputtered films, 11 at. % in evaporated films, and 16 at. % in pyrolytic and sol-gel films. Conductivity can also be increased by the reduction of In2O3, thus creating
doubly charged oxygen vacancies.
To better understand metal-organic processing, films were dip coated on a substrate using an acetylacetone solution of In(NO3)3 and SnCl4. These films were then
thermally decomposed to the oxide which were further reduced yielding higher electrical conductivity while maintaining their transparency.
a)
Present address: Phillips Laboratories, 345 Scarborough Road, Briarcliff Manor, New York 10510.
b)
Present address: Anjou Recherche-CGE, B.P. 76, F-78600 Maisons-Lafitte.
c)
Present address: Department of Chemical and Fuels Engineering, University of Utah, Salt Lake City, Utah 84112.
d)
Author to whom correspondence should be sent.
II. EXPERIMENTAL PROCEDURE
Alkali free borosilicate glass substrates8 were used to avoid sodium diffusion into the ITO layer during the thermal treatments, as is seen with ordinary soda glass substrates. An x-ray fluorescence9 spectrum of the borosilicate substrate, obtained by illumination with a
rhodium x-ray tube operated at 40 keV, showed that it contains: Element Counts/s Ba(LA) Sr(KA) Si(KA) Zr(KA) Ti(KA) Al(KA) Y(KA) Ca(KA) As(LA) 252.2 ± 1.3 96.8 ± 1.0 94.9 ± 1.2 47.1 ± 0.9 43.4 ± 2.0 13.2 ± 0.5 1.4 ± 0.3 1.2 ± 0.2 0.8 ± 0.4
A measure of the surface roughness of the substrate was measured by atomic force microscopy,10 which showed a root mean square (RMS) roughness of 6.7 A. To provide good substrate wetting by the acetylacetone solutions, the substrates were cleaned with laboratory detergent, rinsed with de-ionized water, soaked in con-centrated nitric acid for 1 h, rinsed again with de-ionized water, dried in a vacuum oven at 60 °C, rinsed with methanol, and dried again before being used for dip coating.
A. Dip coating solution preparation
Separate 0.5 M stock solutions of indium and tin acetylacetonate were prepared from indium nitrate [In(NO3)3] • 2 H2On and tin chloride (SnCl4)12 by
dis-solving each separately in an acetylacetone (C5H8O2)12
solvent. These solutions were refluxed for 24 h at 150 °C (boiling point of acetylacetone, 143 °C) followed by a distillation at 120 °C to remove water, nitric acid, and hydrochloric acid which had been introduced by the hydrated indium nitrate and tin chloride. Complexation reactions took place in each solution, which were characterized by Fourier Transform Infrared13 and uv-visible spectroscopy. The solution used for dip coating was diluted to 0.25 M indium to reduce its viscosity. Various amounts of tin dopant were added to study the effect on the resulting oxide film. These levels of tin affected the solution viscosity slightly. The infrared spectra13 of the 0.5 M acetylacetonate solutions were recorded using a 0.05 mm path length liquid cell.
B. Film formation
The substrates were dipped in the 0.5 M acetylace-tonate solution by a simple mechanical pulley system where the weight of the substrate was offset by a sealed cylinder that floated on a column of water; as water flowed out of the cylinder at a constant rate, the substrate was pulled from the solution at a constant velocity. All samples were prepared by a single dip in the acetylace-tone solution and were withdrawn at different constant velocities. The resultant films were then dried in a
vacuum drying oven at 100 °C overnight. Film thickness measurements were made using a Tencor Alpha-Step 200 profilometer. The film thicknesses measured for these samples ranged between 250 and 500 nm after thermal decomposition, depending on the dipping velocity and the solution viscosity.
For accurate thermal gravimetric analysis (TGA), an increase in the film weight was necessary. This was accomplished by using silica spheres as the substrate in contrast to the flat borosilicate glass substrate. The cleaning procedure for these spheres was the same as that for the borosilicate substrates. After pretreatment, the spheres were coated by flowing the 0.5 M acetylace-tonate solution over them and through a 1 /nm vacuum filter and then dried in a vacuum drying oven at 100 °C overnight.
For generation of bulk material, 20 ml of 0.5 M acetylacetonate solution was dried in a vacuum drying oven at 100 °C overnight. This material was used in TGA to compare the thermal decompositions of film and bulk material.
C. Heat treatment
During heat treatment, a 200 ml/min gas flow was maintained through a 10 cm outside diameter quartz tube mounted within a box furnace. The various gases used for the thermal treatments included dry air, argon, forming gas (92% N2, 8% H2), and nitrogen. All were
obtained from Carbagas.14 The samples were initially heated in dry air to decompose thermally the metal-organic film. The resulting oxide was then reduced by heat-treating in forming gas. These reduced samples were cooled to room temperature in reducing gas to avoid oxidation of the surface layer. The effects of heat treatment alone were studied using either nitrogen or argon atmospheres.
The weight loss of the film-coated silica spheres and bulk material during thermal decomposition was evaluated by TGA15 from room temperature to 550 °C with a heating rate of 40 °C/min in a 200 ml/min dry air flow. Differential scanning calorimetry16 (DSC) measurements were also performed for the film coated on glass spheres and bulk material at a heating rate of 40 °C/min with a 50 ml/min dry air flow.
The gases given off during thermal decomposition were analyzed at various pyrolysis temperatures using a temperature programmed pyrolysis17/gas chromato-graph1 Strapped ion mass spectrometer19 system under conditions similar to those described previously.20 The film-coated glass spheres were heated at 200 °C/s up to the desired pyrolysis temperature in a helium14 carrier gas flow where the temperature was held for 10 min. A 10 s pulse of dry air was added during heatup to give an oxidizing atmosphere. The gases from pyrolysis
were conveyed in a heated line to the gas chromatograph equipped with a 30 m long, 0.032 mm (i.d.) capillary column with methylsilicone phase, maintained at 100 °C, which separated the various gases such that their time of arrival at the mass spectrometer was different. The transfer line to the mass spectrometer was also heated to prevent condensation. Once inside the mass spectrom-eter, the gas molecules were ionized and their masses determined. A mass range of 1 to 3300, as well as the total accumulated mass, was measured as a function of time. The time dependence of the total mass accumulated can be interpreted as a signal similar to that of a gas chromatograph detector.
The surface chemistry and structure of the film were analyzed by electron spectroscopy for chemical analysis (ESCA),21 secondary ion mass spectrometry (SIMS),22 and atomic force microscopy10 (AFM). SIMS experi-ments were performed with Ar+ ions as the sputtering gas at an acceleration voltage of 5 kV and a current of 50 nA.
D. Optical and electrical properties of the films The film conductivity was measured by the van der Pauw method23 and the four point probe tech-nique.24 Optical transparency of the film was measured by uv-visible spectroscopy25 over a wavelength range of 300 nm to 900 nm.
III. RESULTS AND DISCUSSION A. Dip-coating solution chemistry
The solvent acetylacetone (2,4 pentanedione) exists as two tautermers: the ketone CH3COCH2COCH3
and the enol CH3C(OH)CHCOCH3 forms.26 The enol
form, corresponding to 85% at room temperature, is stabilized by hydrogen bonding between the alcohol (OH) group and the ketone group. Separate 0.5 M stock acetylacetonate solutions were prepared. Solutions of SnCl4 immediately changed color and gave off a
gaseous HC1, indicating a chemical reaction. Solutions of In(NO3)3 underwent a slower photodecomposition,
as shown in the uv-vis spectra of Fig. 1. After 17 h at 25 °C, In(NO3)3 in acetylacetone has an absorption
maxima at 346 nm.27 This datum was analyzed for its reaction kinetics and was found to be pseudo-first order with a rate constant of 1.81 X 10"4 min"1 at 25 °C and 6.67 X 10"4 min"1 at 150 °C, which gives an activation energy of 7.2 kcal/mole. The color change was accelerated slightly by exposure to light.
In order to characterize the chemistry of these start-ing solutions, both Fourier Transform Infrared Spec-troscopy (FTIR) and Mass SpecSpec-troscopy measurements were performed on the separate precursor solutions. The FTIR spectrum for the reacted indium solution is shown in Fig. 2 and bears a close resemblance to
— • Refluxed and distilled, diluted — 1 month, diluted
— 68 hours — 17 hours
200 300 400 500 600 700 800 WAVELENGTH (nm)
FIG. 1. The uv-visible spectrum of indium nitrate mixed with acetylacetone.
that of the Fe(C5H7O2)3 spectrum. As a result similar
peak assignments seem appropriate, suggesting that in-dium acetylacetonate [In(C5H7O2)3] is the product of
the reaction between [In(NO3)3] • 2H2O and
acetylace-tone. The FTIR spectrum for the reacted tin solution is shown in Fig. 3 and suggests that tin acetylacetonate [Sn(C5H7O2)4] is the product of the reaction between
SnCl4 and acetylacetone. The peak assignments for both
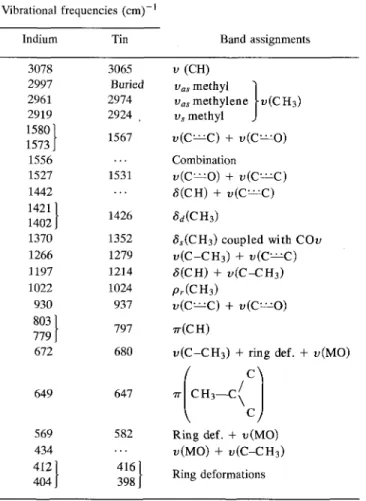
indium28 and tin29"31 solutions are given in Table I. Thermal desorption mass spectroscopy measurements of the indium acetylacetonate with its characteristic peaks at masses 412, 313, 214, and 115 (not shown) compare favorably to those measured by Inagaki and Ohkubo.32 As a result, the following reactions result for the dissolution of In(NO3)3 • 2H2O and SnCl4 in
acetylacetone.
In(NO3)3 -2H2O + 3C5H8O2 —>
In(C5H7O2)3 + 3HNO3 + 2H2O
SnCl4 + 2C5H8O2 -^ Sn(C5H7O2)4 + 4HC1
After distillation, these starting solutions are chelates of acetylacetone with the indium probably in a bi-pyramid bonding configuration with each acetylacetonate
CD CO
3200 2790 2380 1970 1560 1150 710 330 WfWENUMBER
S rr o en m CH3 CH3 3500 30*0 2580 2120 1660 1200 7>tO 280 WfiVENUMBER
FIG. 3. FTIR spectrum of tin acetylacetonate solution.
complexing two of the six bonding sites and the tin in a sp3 tetrahedral bonding configuration with the four bonding sites occupied by the acetylacetonate, as presented in Fig. 4. These structures have not been independently confirmed.
The distillation step served to remove water, nitric acid, and hydrochloric acid from the stock solutions
TABLE I. Frequencies and band assignments for indium and tin acetylacetonate complexes. Vibrational Indium 3078 2997 2961 2919 1580} 1573 J 1556 1527 1442 1421} 1402 J 1370 1266 1197 1022 930 803} 779 J 672 frequencies (cm) ' Tin 3065 Buried 2974 2924 , 1567 1531 1426 1352 1279 1214 1024 937 797 680 Band assignments v ( C H ) vas methyl *| u,,s methylene D ( C H3) vs methyl J v(C— C) + v(C— O) Combination v(C—O) + v(C—C) <5(CH) + u(C~C) sd(cn3)
<5S(CH3) coupled with COv v(C-CH3) + v(C— C) S(CH) + v(C-CH3) Pr(CH3)
v(C— C) + v(C—O)
TT(CH)
v(C-CH3) + ring def. + v(MO)
649 569 434 412} 404 J 647 582 416 398 77" CH3—C \
Ring def. + u(MO) D ( M O ) + D ( C - C H3)
Ring deformations
(v) stretching, (8) in-plane bending, (pr) rocking, and (ir)
out-of-plane bending.
CH3
(a)
CH3
CH
FIG. 4. Probable bonding of acetylacetonate complexes of (a) indium and (b) tin in acetylacetone solution.
which had been introduced by the metal salt raw materi-als. If distillation was not performed, white precipitates were formed that thermally decompose starting at 450 and ending at 550 °C. Identification of the chemical na-ture of the precipitates has been inconclusive. However, the tin stock solution is responsible for their appearance; the indium solution alone without distillation did not show precipitate formation. Only in mixture with the
tin solution were precipitates observed. With distillation, a mixed solution that causes these white precipitates can be restored to a solution which does not form these precipitates. The final solution used for dip coating was diluted to 0.25 M indium to reduce the viscosity. Various amounts of tin dopant were added, which consequently affected the solution viscosity slightly.
B. Dip coating
Samples were prepared by a single dip in the indium-tin acetylacetonate solution and were withdrawn at a constant velocity. The deposited thicknesses ranged be-tween 250 and 380 nm after thermal decomposition, depending on the solution viscosity altered by the tin dopant concentration. The thickness, S, of the oxide layer after thermal decomposition can be correlated (after consideration of the resulting oxide content in the metal-organic solution after thermal decomposition, C) with an equation developed by Deryagin33 for dip coating of Newtonian solutions given by:
3 y pg sin 6
where V is the constant dipping speed, g is the gravita-tional constant, 6 is the angle that the substrate is pulled from the solution (90° in this case), 17 is the solution viscosity, and p is the solution density. This relationship relates the film thickness to the dipping velocity. C. Thermal decomposition
The decomposition of the ITO film was evaluated by TGA using 200 /mm amorphous silica spheres as the substrate. These results are contrasted with those of a bulk powder produced by evaporation of the same starting solution. Figure 5 presents these TGA results. The bulk ITO powders showed discrete decomposition steps at 120, 180, 320, and 440 °C, although reactions were not completed until almost 500 °C. The steps at
0.001 - 0.0000.001 0.002 0.003 0 . 0 0 4 0.005 - 0.0OS0.007 -
-o.ooe-- Solution I on Glass Spheres — Solution I Powder
0 50 100 150 200 250 300 350 400 450 500 550 Temperature (*C)
FIG. 5. DTG of 8% tin oxide ITO film and powder derived from dried solution.
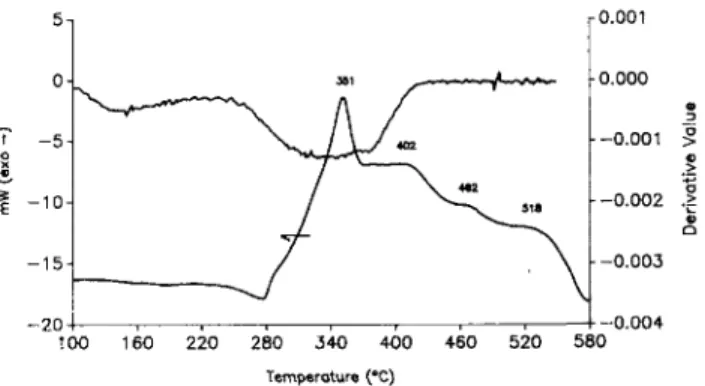
180, 320, and 440 °C are likely to be the removal of one acetylacetonate group per metal, polymerization where the metal atoms is joined by shared acetylace-tonate ligand, and then a stepwise removal and further polymerization, followed by oxidative removal of bridg-ing acetylacetonate groups, as was observed with thermal decomposition of iron acetylacetonate in oxygen.34 The ITO film-coated silica spheres decomposed quite dif-ferently, producing only two decomposition steps: at 145 °C, near the boiling point of acetylacetone, 143 °C, and a broad step at 335 °C. All weight loss reactions were completed by 400 °C, nearly 100 °C less than that for the bulk material. This completion temperature cor-responds to one where visual inspection of samples pre-pared on the flat glass substrates showed transparency. A DSC of the film thermal decomposition is shown in Fig. 6. The broad step at 335 °C is exothermic. The thermal decomposition at 335 °C, thought to be the rupture of the metal oxygen bond, is expected to be endothermic as it is with predictions35 for V, Cr, Mn, Fe, Co, and Ru acetylacetonates and with experiments34 for Fe acetylacetonate decomposed in helium. But once this bond is broken, the volatile acetylacetonate species will undergo oxidation reactions that are highly exothermic, as was observed with the thermal decomposition of Fe acetylacetonate in oxygen.34 In addition, hydrogen is a likely volatile product of thermal decomposition which will readily oxidize to H2O, adding to the exothermicity.
The broad thermal decomposition centered at 335 °C was further studied kinetically by performing TGA at various constant temperatures between 300 and 400 °C. Samples of dried solutions coated onto glass spheres were placed in the TGA apparatus and heated at 50 °C/min to the desired temperature and held at this operating temperature while monitoring the weight loss as a function of time. Figure 7 is an example of this time dependent weight loss for a decomposition temperature of 400 °C. At all temperatures in this 100 °C range, a first-order reaction was observed. The rate constants obtained are plotted as a function of temperature in Fig. 8
0.001
100 160 220 280 340 400
Temperature (°C)
460 520 580-0.004
FIG. 6. Weight loss as a function of time for ramp of 50 °C/min to 400 °C and hold. The weight loss at 400 °C is first order with a rate constant of 0.217 min"1.
- r 1 i '
30.
1 I '
40.
0. -CO. 10. 20.
FIG. 7. DSC and DTG of 8% tin oxide ITO film.
from which an activation energy of 13.6 Kcal/mole was determined.
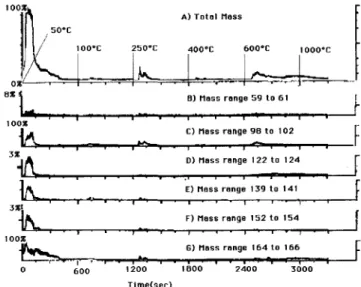
Based on these TGA results, pyrolysis/gas chro-matography/mass spectroscopy measurements were per-formed for the temperatures 50, 100, 250, 400, 600, and 1000 °C in ascending order for the 8% tin oxide sample. These results are shown in Fig. 9. Here we see the total accumulated mass as well as selected narrow mass ranges plotted as a function of time. At 50 °C a large amount of gas evolves in a large peak at 2 min retention time followed by a smaller peak at 4 min retention time. The peak at 2 min retention time is composed primarily of mass 98 to 102 and mass 164 to 166. The peak at 4 min retention time is composed primarily of mass 164 to 166. This double peak is identical to that obtained for acetylacetone solvent (mass 100) under the same exper-imental conditions. The mass 164 to 166 is probably a product of an autocatalytic reaction of acetylacetone in the pyrolyzer. Thus, the thermal decomposition at 50 °C can be interpreted as the evaporation of solvent left in
= 0.988 -3 0.0013 0.0014 0.0015 0.0016 0.0017 00 0 1 oo*c A) Total Mass 2S0"C
K
40CC 600"C 1000-C[
L
B) Mass range 59 to 61K
c ) Mass range 9 8 to 102 D) Mass range 122 to 124 E) Mass range 139 to 141 F) Mass range 152 to 154 G) Mass range 164 to 166 1200 I BOO T l m e ( s e c )FIG. 9. Mass spectra as a function of time for the step pyrolysis to 50, 100, 250, 400, 600, and 1000 °C: (A) total accumulated mass and (B-G) specific mass ranges.
the film after drying. At 100 °C, there is very little gas evolution detected. At 250 °C, a small amount of gas evolves with a peak at 1.5 and 2.5 min retention times. These peaks are primarily mass 98 to 102 and 164 to
166 again corresponding to the mass signature of the acetylacetone solvent. At 400 °C, there is very little gas evolution detected. At 600 °C, a broad peak centered at 2.5 min retention time is produced, which is expanded in Fig. 10. Again this peak consists primarily of mass 98 to 102 and mass 164 to 166. The initial part of the total accumulated mass peak is the result of the 98 to 102 mass, and the breadth of the peak is a result of the 164 to 166 mass. The reaction occurring at this temperature does not contribute very much to the weight loss as seen in Fig. 5, and for this reason we do not speculate as to what is taking place. At 1000 °C, there is very little gas evolution detected. Signals for HC1 (mass range 34 to 39) or nitric acid (mass range 62 to 64) in the mass spectra of the products of film thermal decomposition at any temperatures were not found.
ioo% 600"C A ) T o t a l Mass 1000-C 13X
B)Masses 98 to 102
OMasses 164 to 166
2400 2600 2800 TimeCsec) 3000 3200FIG. 10. Expanded mass spectra as a function of time for the step FIG. 8. Decomposition rate constant as a function of 1/T for pyrolysis to 600 and 1000 °C: (A) total accumulated mass and ITO films. EA = 13.6 Kcal/mole. (B, C) specific mass ranges.
Thus, we can deduce that the thermal decomposition of ITO films in air occurs by the following reactions:
2In(C5H7O2)3(s) + 3O2(g) — In2O3(s)
+ 6C5H6O2(g) + 3H2O(g)
Sn(C5H7O2)4(s) + 2O2(g) — SnO2(s)
+ 4C5H6O2(g) + 2H2O(g),
giving an amorphous oxide film. Furthermore, the volatile acetylacetonate residue may be further frag-mented and/or oxidized. Smaller fragments were cer-tainly observed in the mass spectra, but it is difficult to determine if this fragmentation was caused during thermal decomposition (at 1 atm) or in the detector of the mass spectrometer (high vacuum with high voltage). The formation of the ceramic phase in the ITO films was investigated by DSC and x-ray analysis. Figure 6 shows a large exothermic decomposition peak for the loss of the organic molecules in the 280 to 400 °C range and an exothermic crystallization peak at approximately 518 °C with a heating rate of 40 °C/min. The crystal-lization of the film, confirmed by x-ray analysis shown in Fig. 11, occurs at the same temperature as that of the bulk ITO powders. The x-ray patterns show that some degree of crystallinity is present at 500 °C below the bulk crystallization temperature for the film on the borosili-cate glass substrate, but it is minor in comparison to the crystallization of the remainder of the film above 518 °C. There is also a transition in the 450-470 °C range, which is the glass transition of the amorphous film. When repeated thermal cycles are applied to this film across the glass transition temperature, this transition is seen to reduce and then disappear. After 120 min above 518 °C, the glass transition was virtually nonexistent, indicating a uniform crystalline structure had been formed. Films that were heated in air at 500 °C for 1 h were transparent, but
2 O 2 5 3 0 3 5 4 0 4 5 5 0 5 5 8 O
Film 50CC Coated Spheres 6OO-C
, — Coated Spheres 475'C
FIG. 11. X-ray diffraction of 8% tin oxide ITO film.
were not electrically conductive. Increasing the time held at 500 °C in reducing gas (until metallization) improved the electrical conductivity, but not as much as thermal treatments in air above 462 °C, suggesting that improved microstructure and/or crystallinity is needed to enhance electrical conductivity.
As a result of these thermal decomposition ex-periments, the following heat treatment schedule was developed for ITO films dip coated on borosilicate glass substrates: (i) drying in air at 25 °C for 1 h, then at 100 °C in a vacuum oven overnight, (ii) thermal decomposition in dry air at 500 °C for 1 h (giving a crystalline film), and (iii) reduction at 500 °C for various periods of time in forming gas.
The surface chemistry of the 8% SnO2 film after
thermal treatment, including reduction, was measured by ESCA21 (not shown). It showed In, Sn, and O as major peaks [i.e., N(E)/E > 60 X 103 counts/s] and C, N, and Al as minor peaks [i.e., N(E)/E < 1.5 X 10³ counts/s]. The presence of nitrogen is probably due to its adsorption from air. The carbon is most likely residual from the thermal decomposition of the
metal-so 30 40 SPUTTER-TIME [mln]
organic deposit, and the aluminum is probably due to substrate diffusion through the film.
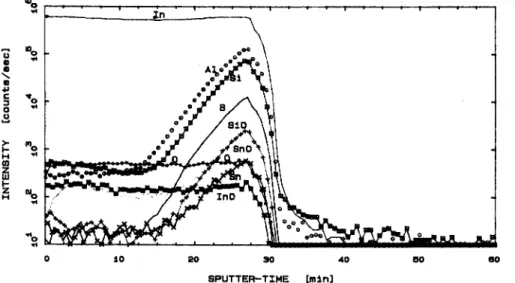
An argon ion sputtered SIMS22 profile of the 8% SnO2 film after all thermal treatments, including
reduc-tion, is shown in Fig. 12. Here we see that the interface between the film and the substrate is easily observed. The sputtering rate was not calibrated for this sample. But for a sample of Ta2O5/Ta36 under identical sputtering
conditions, the sputtering rate was found to be 12 A/min, allowing a crude calculation of the film thickness as - 5 0 0 A. The SIMS profile shows that the In and O remain relatively constant over the thickness of the film. In addition SnO is deficient at the surface of the film and appears to diffuse to the film/substrate interface where it is concentrated. Several elements diffuse from the substrate into the film. These include Al, Si, and B. Indium may also diffuse into the substrate since it was not found by x-ray fluorescence of the substrate, yet is observed in the SIMS profile of the substrate below the surface of the film. The reason that the Si, Al, and B signals drop off at the same depth as the In and Sn signal is that the ITO film and the glass substrate are different matrices. The ITO film is more easily sputtered than the borosilicate glass substrate giving a larger signal.
The surface structure of the 8% SnO2 film is shown
in Fig. 13 using atomic force microscopy (AFM10). Here we see there is a uniform surface structure for a 9.9 by 10 fim cross section [see Fig. 13(a)]. At further mag-nification [see Fig. 13(b) and 13(c)j we can see un-dulations to the surface which are probably grains of the ITO crystal structure since their RMS roughness is 44 A compared to a value of 6.7 A for the substrate alone. At the highest magnification [Fig. 13(c)], we can see that the crystallites are approximately 50 A in diameter.
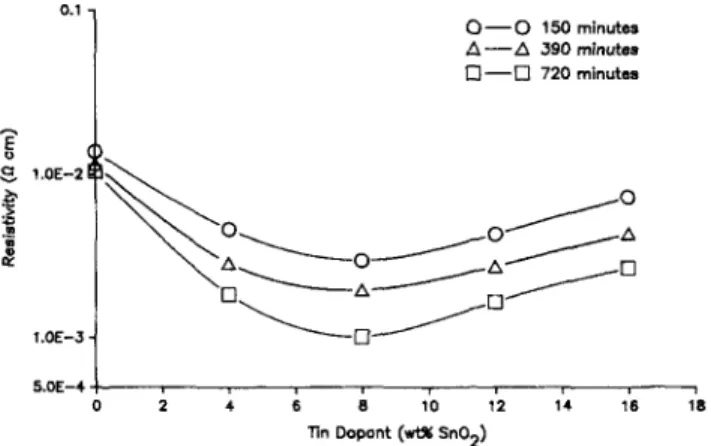
D. Optical and electrical property measurement Samples prepared with various tin dopant levels and thermal reduction treatments gave conductivity curves which are similar to those seen by others.1-37 Figure 14 shows a decrease in film resistivity as the reduction time increases. For each reduction time, the resistivity shows a minimum near 8-10% weight SnO2 (the optimal dopant
level). The best measured resistivity value in these experiments was 1.01 X 10~3 ft -cm for a film with 8% weight SnO2 reduced in forming gas for 720 min.
Longer reduction times to the point of converting the oxide film to a metal film (not shown in this figure) did not produce lower resistivity values than those shown for 720 min reduction time in forming gas. The formation of a metal film is easily observed by its change from transparent to a grey-brown color.
The optical transmittance curve for the film with 8% weight SnO2, reduced for 720 min, was measured
FIG. 13. AFM of 8% tin oxide ITO film at three magnifications: (a) 9.9 X 10 ^m, (b) 0.89 X 0.9 /un, and (c) 650 X 680 A.
O — O 150 minutes A — A 390 minutes • • 720 minutes
2 4 6 8 10 12 14 16 18 Tin Dopant (wt* SnO2)
FIG. 14. Resistivity as a function of time dopant concentration and reduction time at 500 °C in reducing gas.
over a wavelength range of 300 to 900 nm, as shown in Fig. 15. The sample had a transmittance of 89.7% at 400 nm for a sample coated on two sides, which corresponds to a calculated transmittance of 94.9% for a single film 273 nm thick. The minimum resistivity at 8 wt. % tin oxide occurs at a greater tin doping level than that in sputtered films, which may indicate either a greater solubility of tin in the indium oxide structure, or a difference in the excess tin phases.
IV. CONCLUSIONS
Thermal decomposition of an indium and tin acetyl-acteonate deposit dip coated onto a borosilicate glass substrate from an acetylacetone solution produced good In2O3-SnO2 films. Film thicknesses of 273 nm,
contain-ing 8 wt. % tin oxide, thermally decomposed at 500 °C and reduced for 720 min in forming gas at 500 °C gave resistivities of —1.01 X 10~3 D, • cm with an optical transparency of ~ 9 5 % at 400 nm. This optical trans-parency is similar to that obtained by sputtering. The electrical resistivities of these films are a factor of two less than the best produced by sputtering. Controlled microstructure, electrical and optical properties of the
7a.
oo-60.00
600 •AVELEN8TH Cn«) FIG. 15. Optical transmittance of 8% ITO film.
ITO films result from an understanding of the film thermal decomposition, crystallization, and reduction steps which must be further optimized to give electrical resistivities as good as sputtered films.
ACKNOWLEDGMENTS
This research was sponsored by the Swiss National Science Program NFP No. 19. The authors would like to thank Jean Daniel Neuvecelle for the AFM photographs, Brian Senior for the SEM photographs used, and Anahita Jamshidi for her work in preparing the samples for the resistivity measurements.
REFERENCES
1. T. Maruyama and A. Kojima, Jpn. J. Appl. Phys. 27 (10), L1829-1831 (1988).
2. A.L. Dawar and J.C. Joshi, J. Mater. Sci. 19, 1-23 (1984). 3. N. J. Arfsten, R. Kaufman, and H. Dislich, in infrastructure
Pro-cessing of Advanced Ceramics, edited by J. D. Mackenzie and
D.R. Ulrich (John Wiley, New York, 1984), pp. 189-196. 4. N. J. Arfsten, R. Kaufman, and H. Dislich, German Patent DE
3300589, July 12, 1984.
5.1. Hamberg and C.G. Granqvist, J. Appl. Phys. 60 (11), R123-R159 (1986).
6. G. Frank, H. Kostlin, and A. Rabenau, Phys. Status Solidi (A) 52, 231-238 (1979).
7. J. C. C. Fan and J. B. Goodenough, J. Appl. Phys. 48 (8),' 3524-3531 (1977).
8. Desag, Griinenplan, Germany (AF-45).
9. Omicron Spectrometer, Kevex Instruments, San Carlos, CA 94070.
10. SFM-BD2-210, Park Scientific Instruments, Mountain View, CA 94043.
11. Fluka, Buchs, Switzerland (technical grade). 12. Fluka, Buchs, Switzerland (reagent grade).
13. Nicolet 510 FTIR spectrometer, Nicolet Analytical, Madison, WI. 14. Carbagas, Lausanne, Switzerland (technical grade).
15. Mettler TG 50, Mettler, Zurich, Switzerland. 16. Mettler DSC 30, Mettler, Zurich, Switzerland.
17. Chemical Data System Pyroprobe 200, CDS, Oxford, PA. 18. Varian 3400, Varian Ass., Sunnyvale, CA.
19. MAT Ion Trap Mass Spectrometer ITMS, Finnigan-MAT, San Jose, CA.
20. F. P. Scanlan and R. Houriet, J. Trace Microprobe Technol. 9, 177-199 (1991).
21. PHI 5500 Perkin-Elmer, Norwalk, CT 00856.
22. A-DIDA 3000(Atomika) Perkin-Elmer, Norwalk, CT 00856. 23. L. J. van der Pauw, Philips Res. Rep. 13 (1), 1-9 (1958). 24. S.M. Sze, Physics of Semiconductor Devices, 2nd Edition (John
Wiley & Sons, New York, 1981), pp. 31-33. 25. Perkin-Elmer Lambda 6, Norwalk, CT 00856.
26. J. D. Roberts and M. C. Caserio, Basic Principles of Organic
Chemistry (W. A. Benjamin, Inc., New York, 1965), p. 498.
27. This peak at 346 nm is similar to that observed for A1(C5H7C>2)2. 28. A.L. Allred and D.W. Thompson, Inorg. Chem. 7, 1196-1201
(1968).
29. R.W. Jones and R.C. Fay, Inorg. Chem. 12, 2599-2606 (1973). 30. J.W. Faller and A. Davidson, Inorg. Chem. 6, 182-184 (1967). 31. D.W. Thompson, J.F. Lefelhoxz, and K.S. Wong, Inorg. Chem.
32. N. Inagaki and J. Ohkubo, J. Appl. Polym. Sci. 43 (4), 793-800 35. P. Sharpe and D.E. Richardson, J. Am. Chem. Soc. 113, (1991). 8339-8340 (1991).
33. B.V. Deryagin, DAN USSR. 39, 11 (1943); reviewed in B.M. 36. Ta2O5/Ta certified reference material, CRM 261 R, BCR Deryagin and S.M. Levi, The Focal Press, London (1964). Brussels.
34. N.B. Morozova, V.N. Mit'kin, and I.K. Igumenov, Russ. 37. J.L. Vossen, RCA Rev. 32, 289-296 (1971). J. Inorg. Chem. 33 (10), 1459-1464 (1988).